


New setups
TICKERS: CSTM(NYSE), CLBT(NASDAQ), SKWD(NASDAQ), BLD(NYSE), ORRF(NASDAQ)
Constellium SE-(CSTM/NYSE)-Short Idea
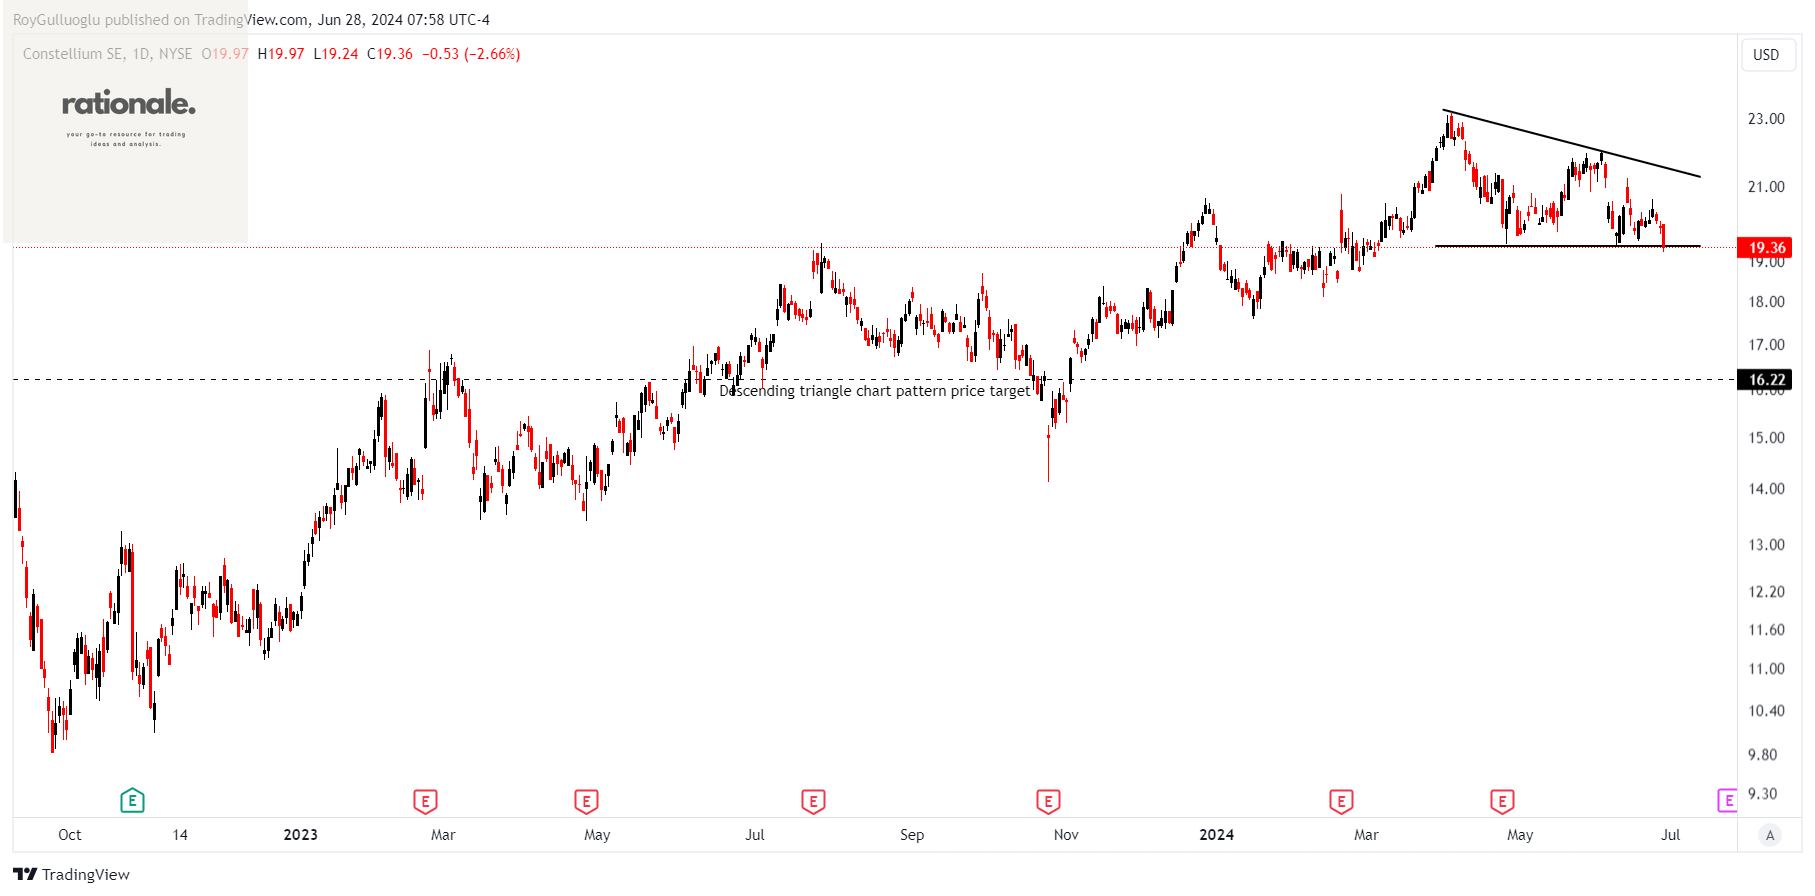
Constellium SE, along with its subsidiaries, designs, manufactures, and sells rolled and extruded aluminum products for various end-markets, including packaging, aerospace, automotive, defense, transportation, and other industrial sectors.
The above daily chart formed an approximately 2-month-long descending triangle chart pattern as a bearish reversal after an uptrend.
The horizontal boundary at 19.36 levels acts as a support within this pattern.
A daily close above 18.78 levels would validate the breakdown from the 2-month-long descending triangle chart pattern.
Based on this chart pattern, the potential price target is 16.22 levels.
CSTM, classified under the "basic materials" sector, falls under the “Mid Cap - Value” stock category.
Cellebrite DI Ltd.-(CLBT/NASDAQ)-Long Idea
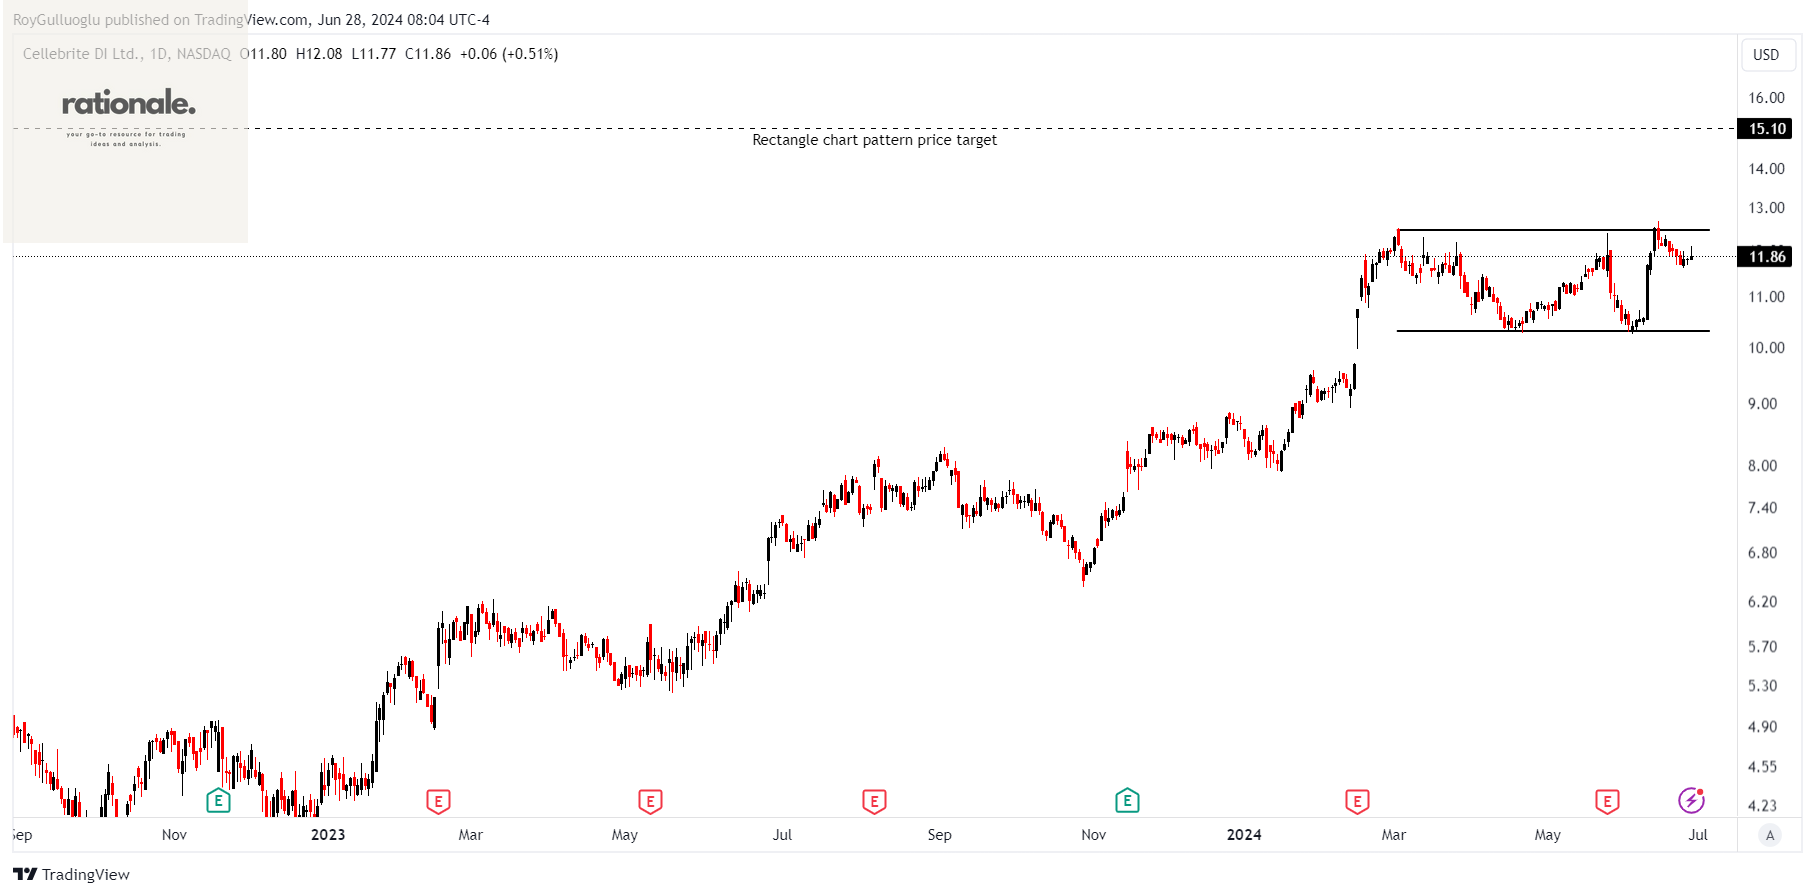
Cellebrite DI Ltd. develops solutions for legally authorized investigations across Europe, the Middle East, Africa, the Americas, and the Asia-Pacific regions.
The above daily chart formed an approximately 3-month-long rectangle chart pattern as a bullish continuation after an uptrend.
The horizontal boundary at 12.45 levels acts as a resistance within this pattern.
A daily close above 12.83 levels would validate the breakout from the 3-month-long rectangle chart pattern.
Based on this chart pattern, the potential price target is 15.1 levels.
CLBT, classified under the "technology" sector, falls under the “Mid Cap - Growth” stock category.
Skyward Specialty Insurance Group, Inc.-(SKWD/NASDAQ)-Long Idea
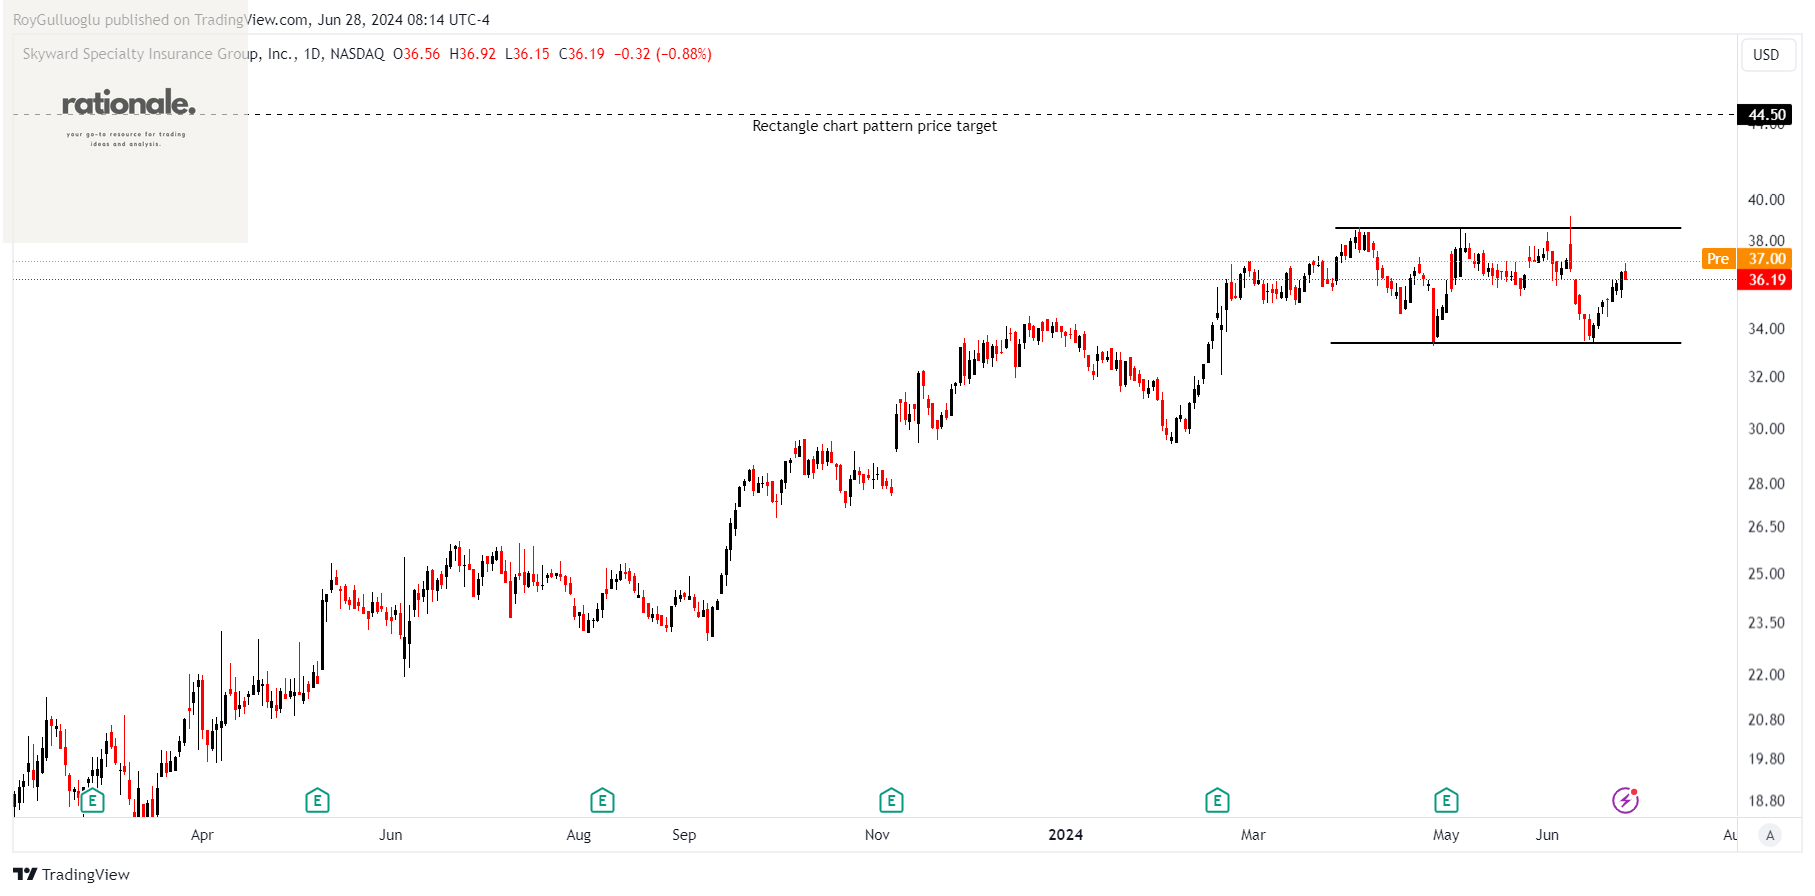
Skyward Specialty Insurance Group, Inc., an insurance holding company, provides underwriting services for commercial property and casualty insurance products in the United States.
The above daily chart formed an approximately 2-month-long rectangle chart pattern as a bullish continuation after an uptrend.
The horizontal boundary at 38.5 levels acts as a resistance within this pattern.
A daily close above 39.65 levels would validate the breakout from the 2-month-long rectangle chart pattern.
Based on this chart pattern, the potential price target is 44.5 levels.
SKWD, classified under the "financial services" sector, falls under the “Small Cap - Income” stock category.
TopBuild Corp.-(BLD/NYSE)-Short Idea
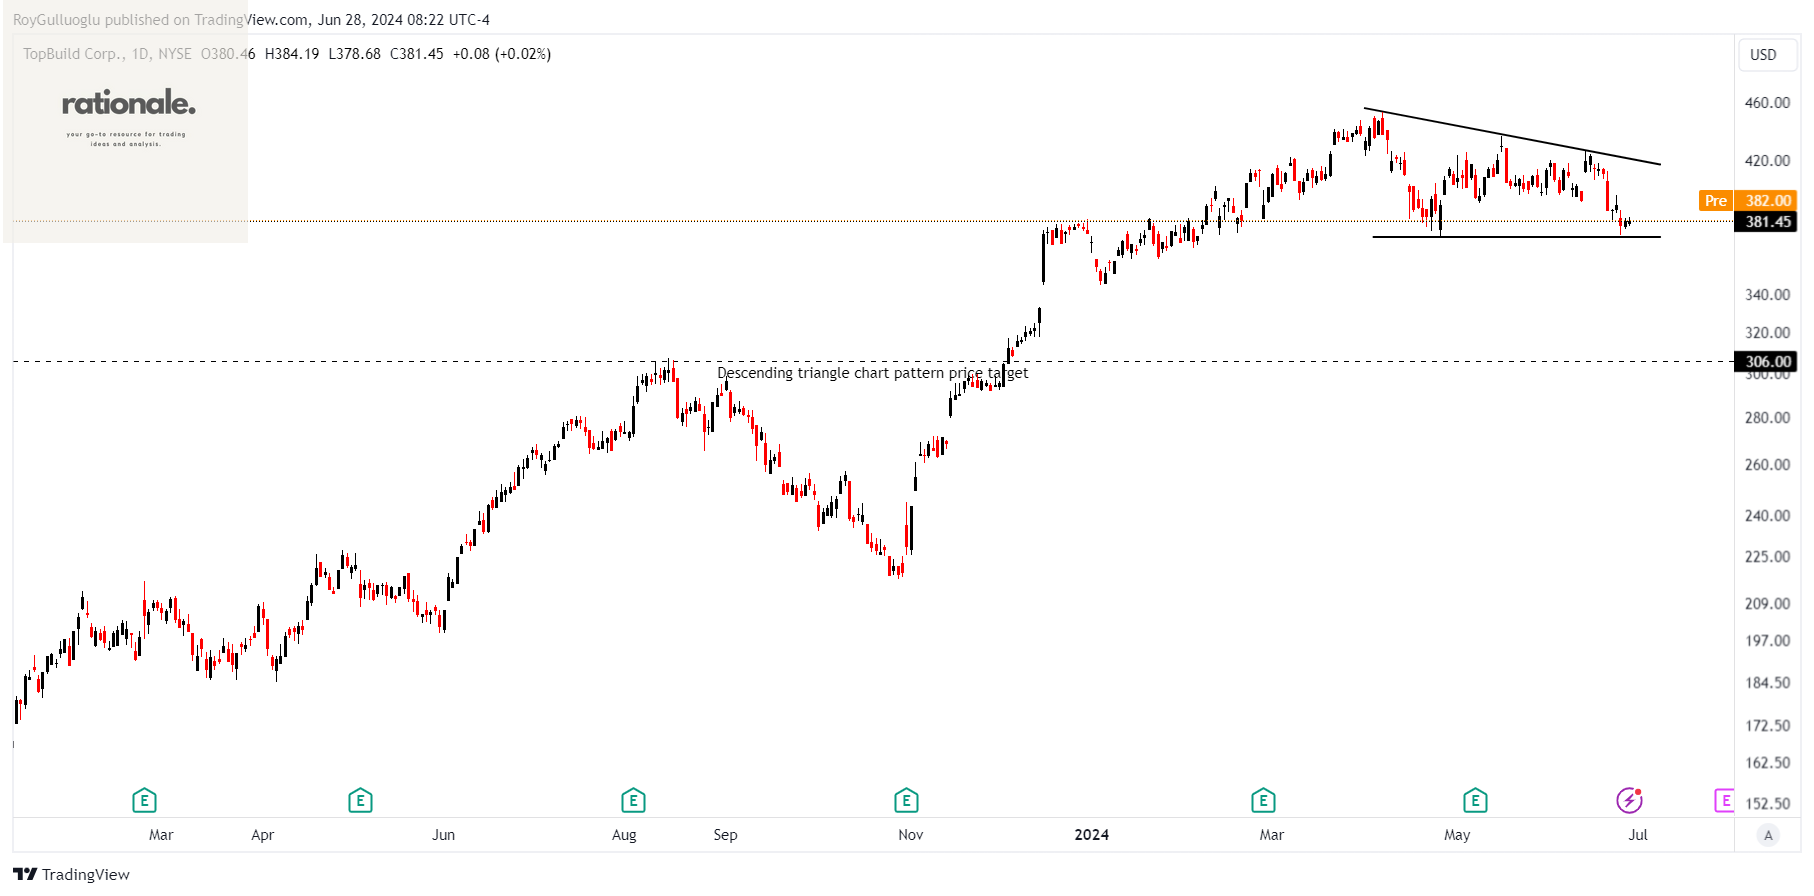
TopBuild Corp., along with its subsidiaries, is involved in the installation and distribution of insulation and various building materials for the construction industry.
The above daily chart formed an approximately 2-month-long descending triangle chart pattern as a bearish reversal after an uptrend.
The horizontal boundary at 372 levels acts as a support within this pattern.
A daily close below 360.84 levels would validate the breakdown from the 2-month-long descending triangle chart pattern.
Based on this chart pattern, the potential price target is 306 levels.
BLD, classified under the "industrials" sector, falls under the “Large Cap - Value” stock category.
Orrstown Financial Services, Inc.-(ORRF/NASDAQ)-Long Idea
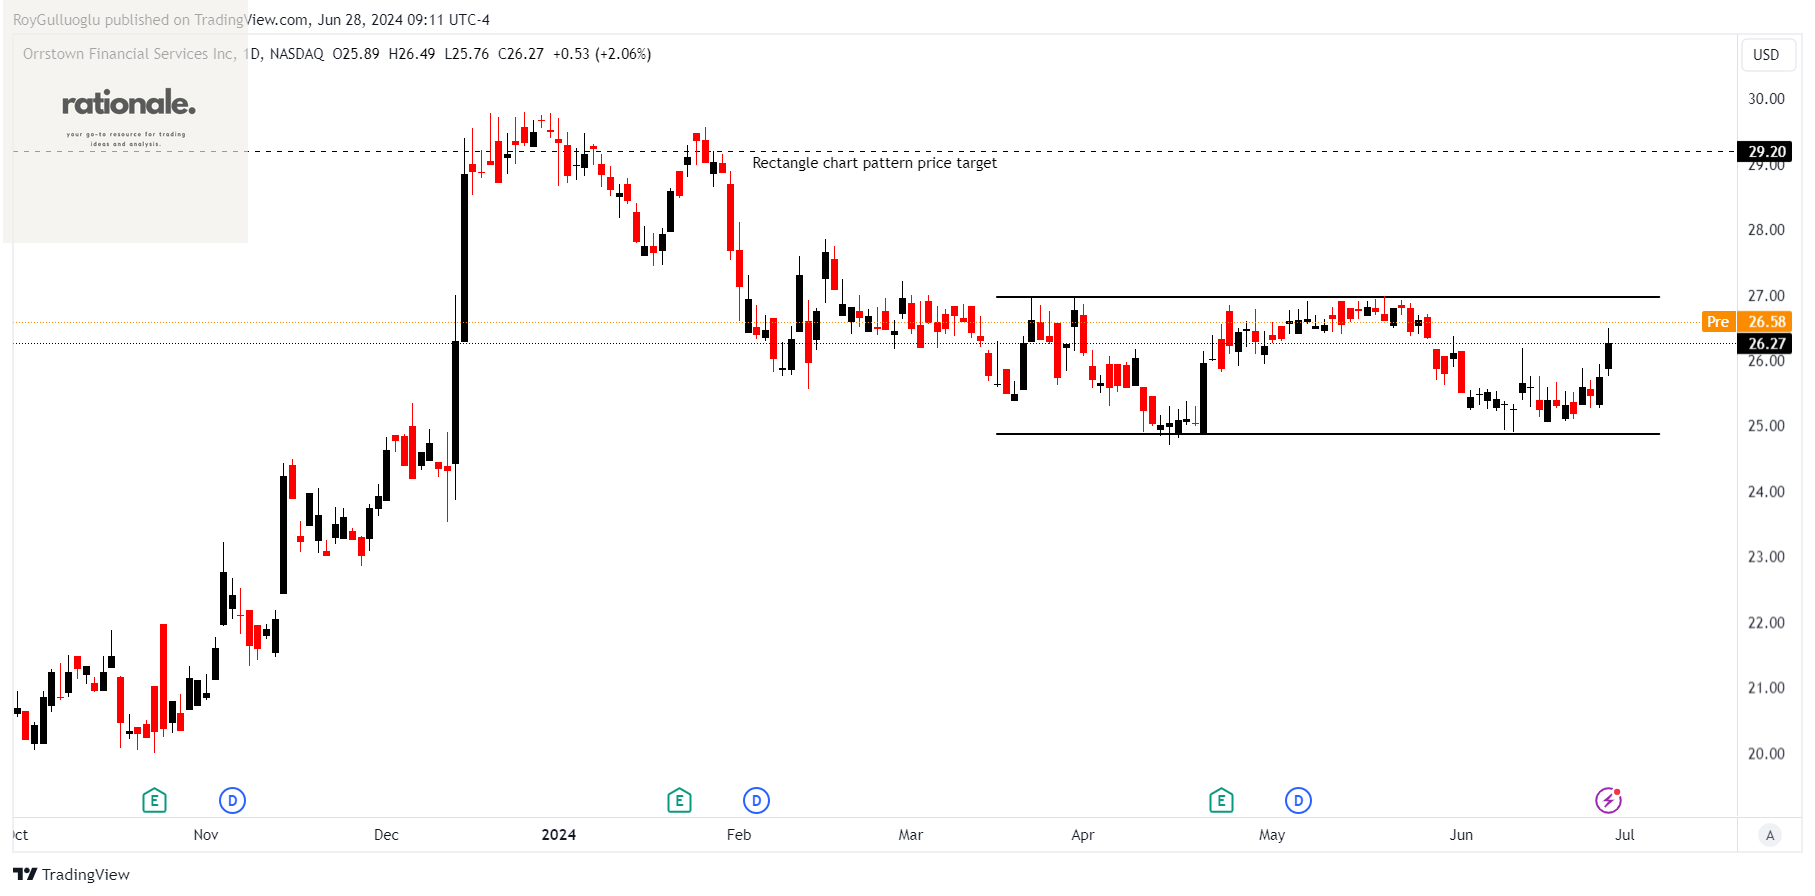
Orrstown Financial Services, Inc., the financial holding company for Orrstown Bank, offers commercial banking and financial advisory services to retail, commercial, non-profit, and government clients in the United States.
The above daily chart formed an approximately 3-month-long rectangle chart pattern as a bullish reversal after a downtrend.
The horizontal boundary at 27 levels acts as a resistance within this pattern.
A daily close above 27.81 levels would validate the breakout from the 3-month-long rectangle chart pattern.
Based on this chart pattern, the potential price target is 29.2 levels.
ORRF, classified under the "financial services" sector, falls under the “Small Cap - Income” stock category.
Teşekkürler