


Hewlett Packard Enterprise Company -(HPE/NYSE)-Short Idea
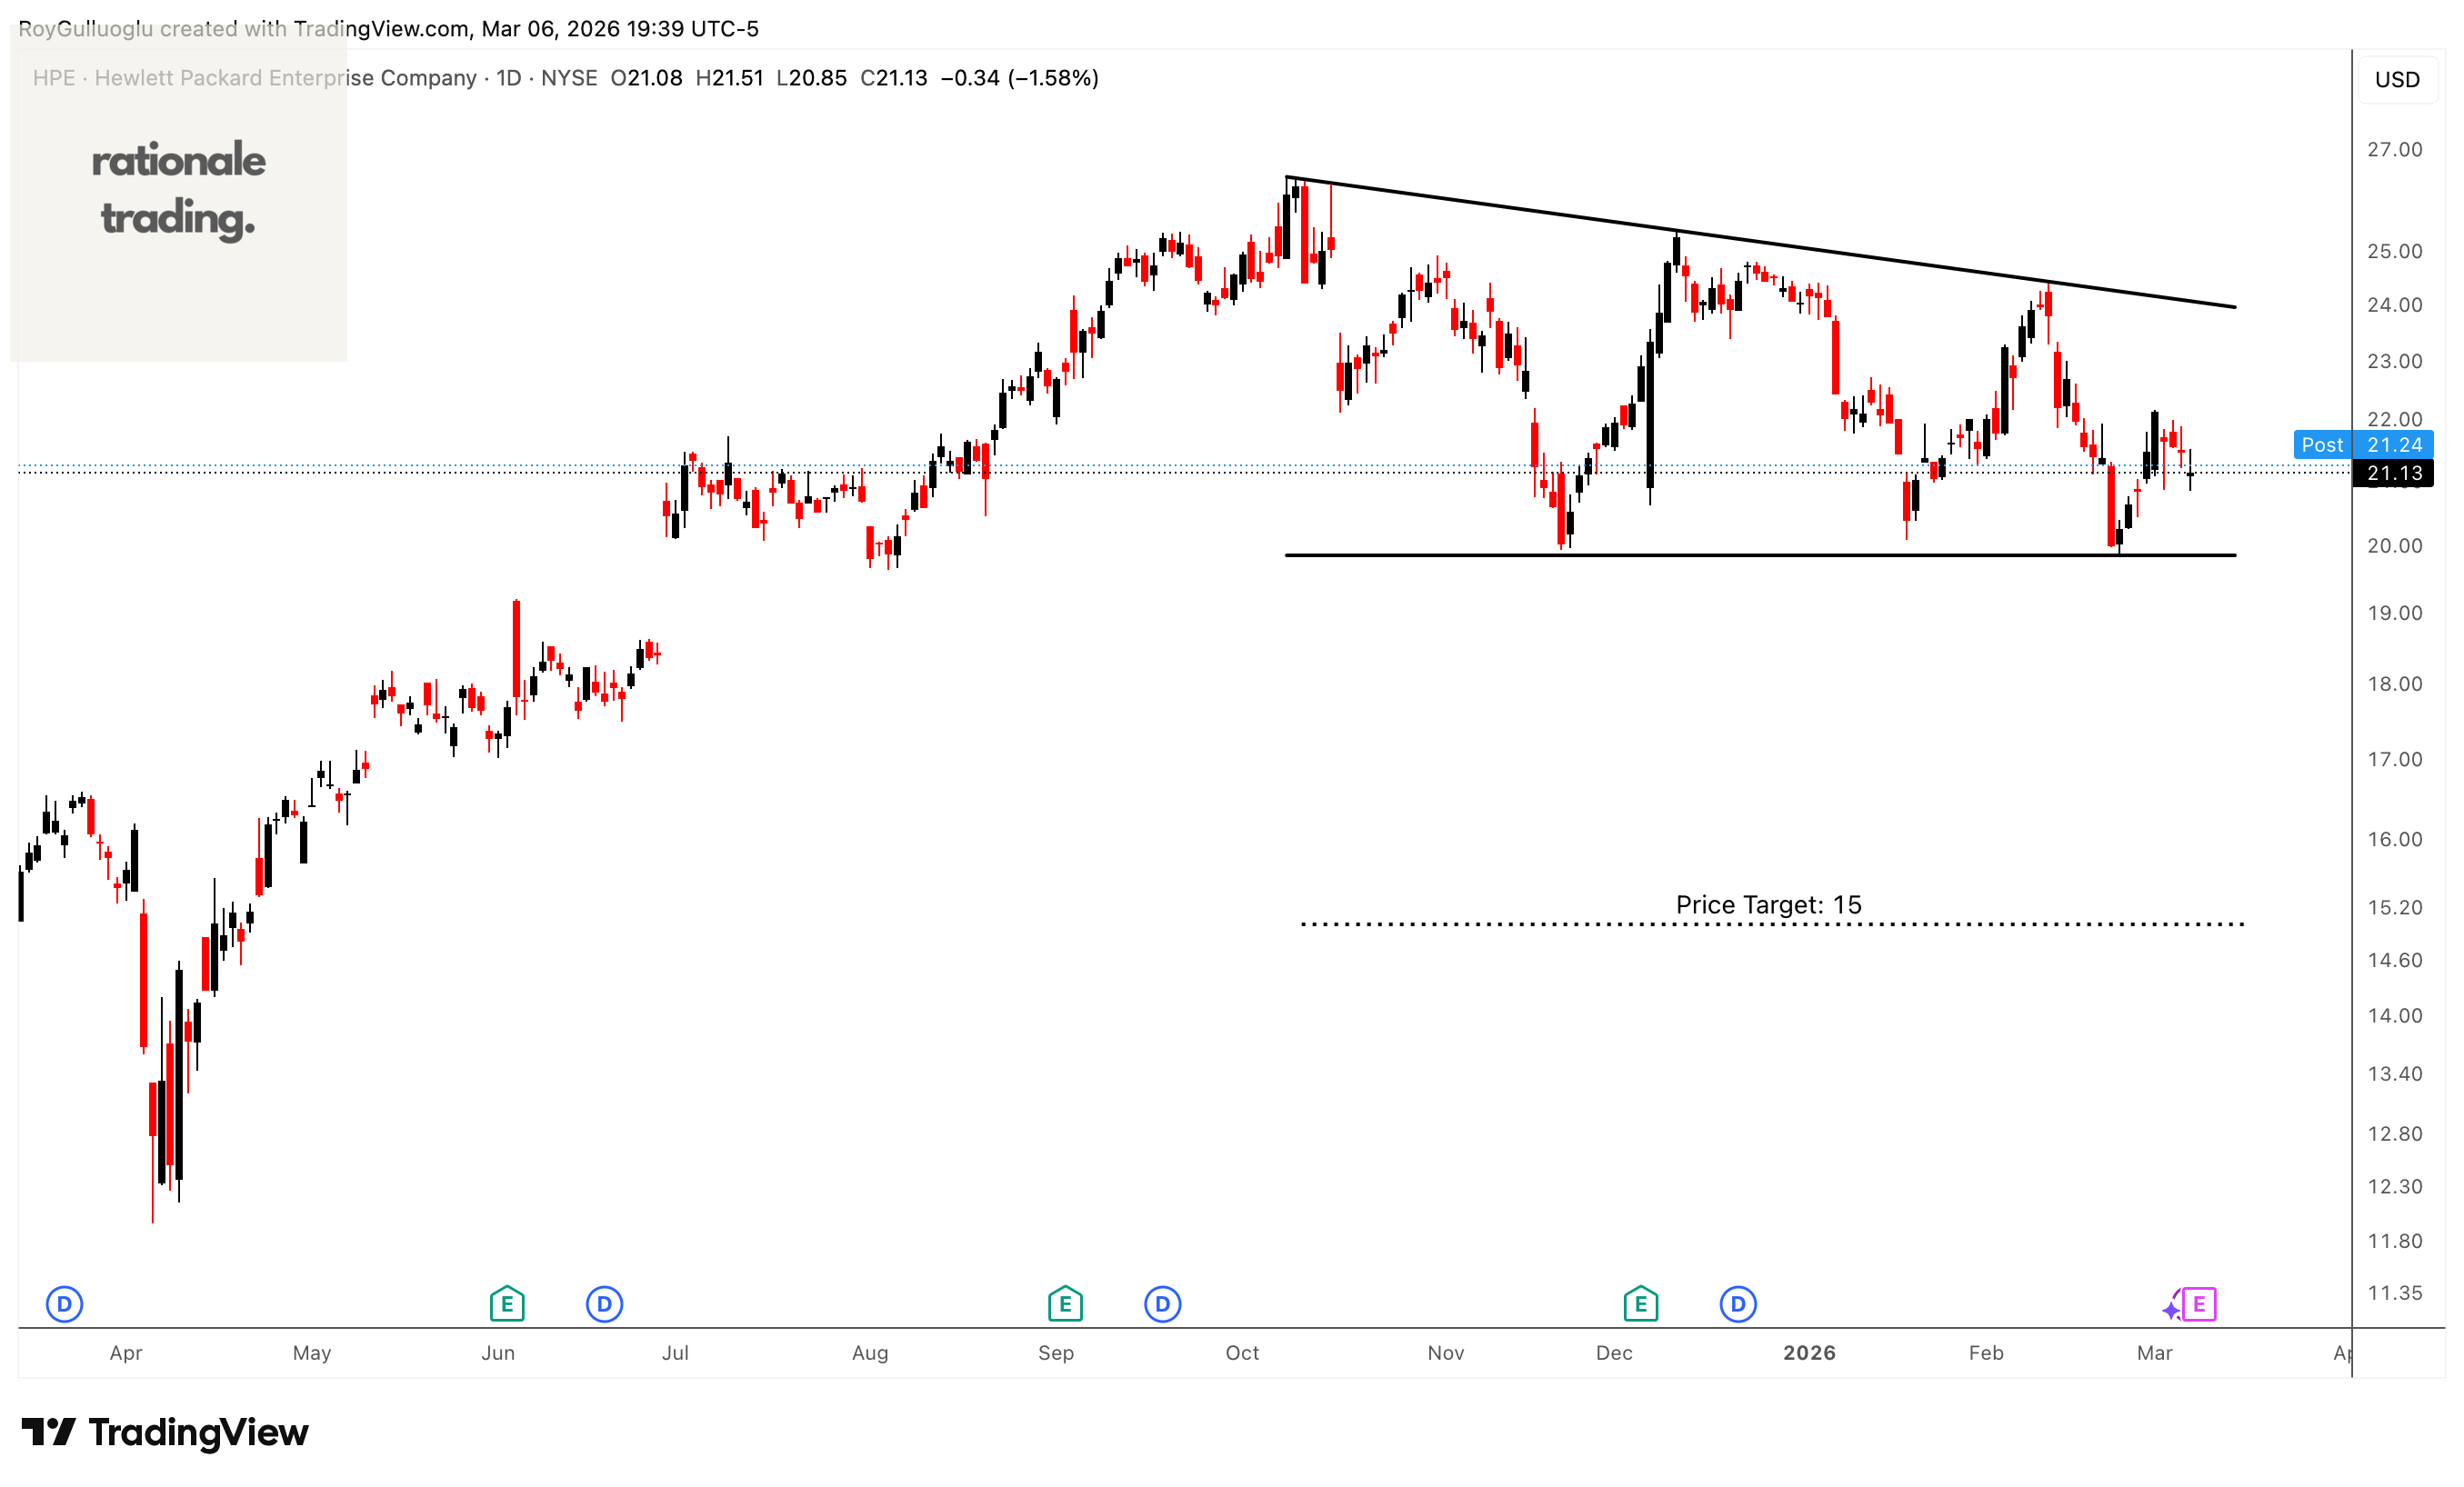
Hewlett Packard Enterprise Company, together with its subsidiaries, develops intelligent solutions in the United States, the Americas, Europe, the Middle East, Africa, the Asia Pacific, Japan, and internationally. The above daily chart formed an approximately 3-month-long rectangle chart pattern as a bullish reversal after a downtrend.
The horizontal boundary at 19.84 levels acts as a support within this pattern.
A daily close below 19.25 levels would validate the breakout from the 3-month-long descending triangle chart pattern.
Based on this chart pattern, the potential price target is 15 levels.
American Tower Corporation-(AMT/NYSE)-Long Idea
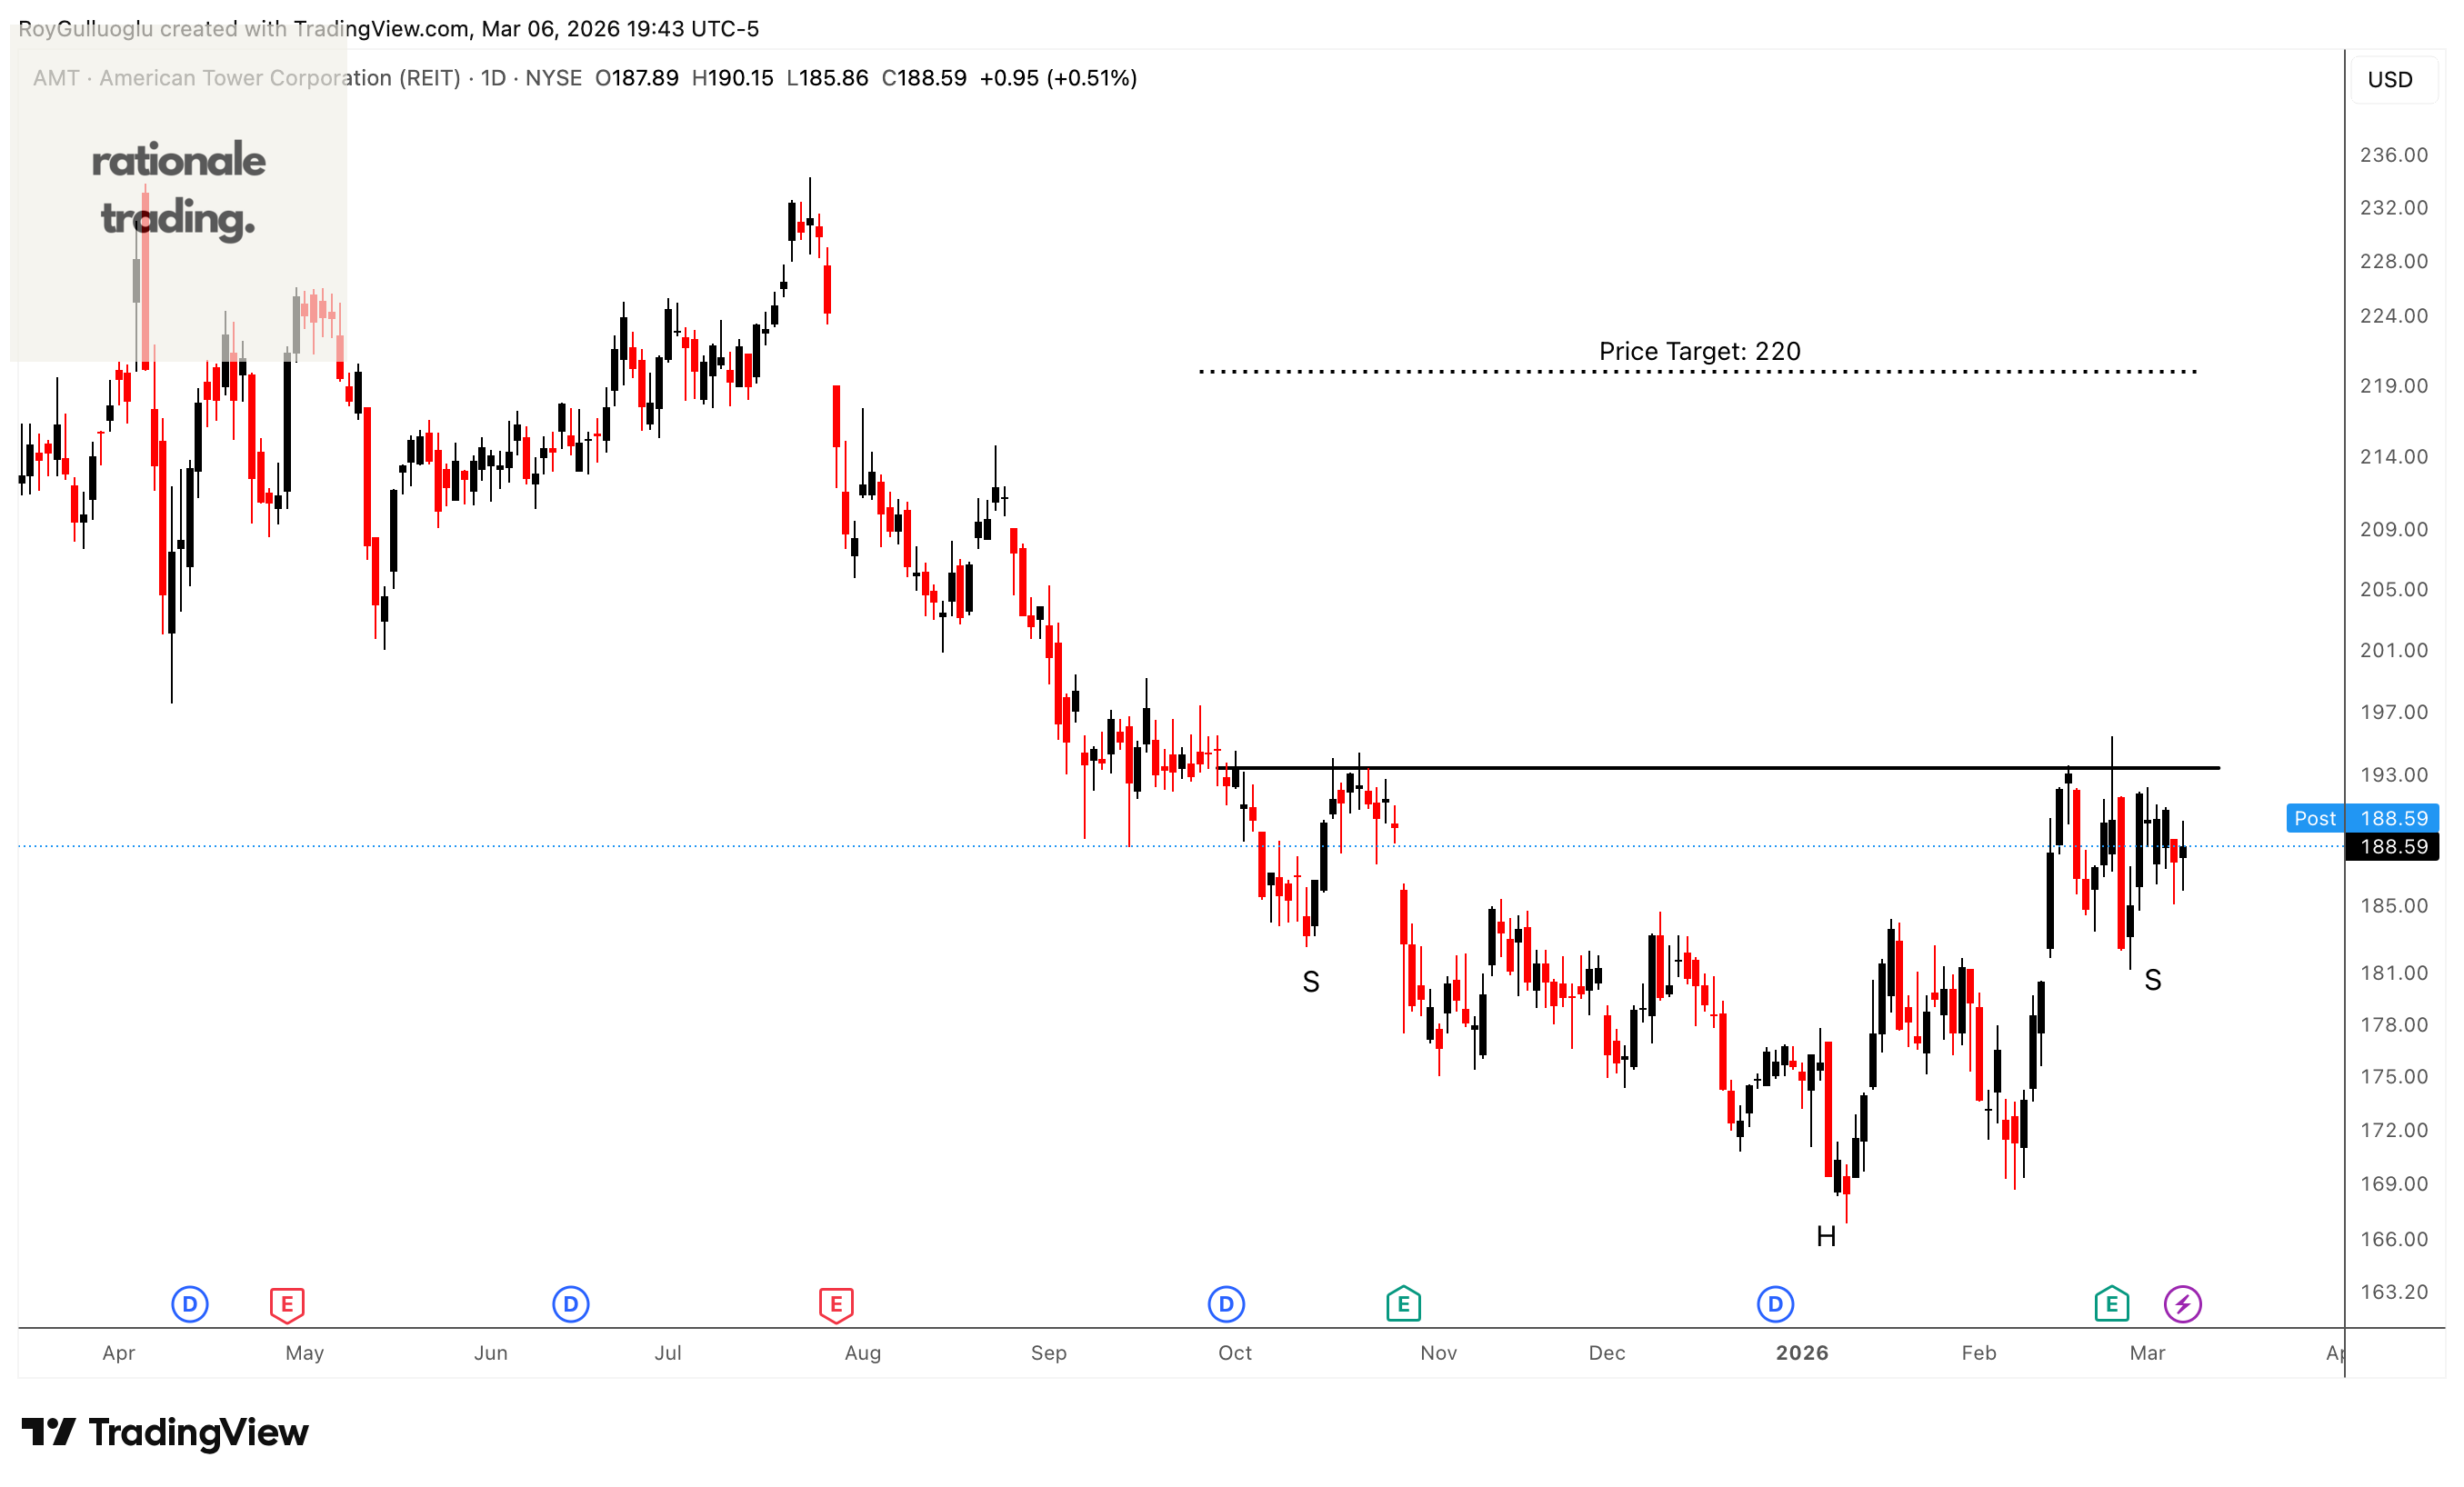
American Tower Corporation (together with its subsidiaries, ATC or the Company) is one of the largest global real estate investment trusts and a leading independent owner, operator and developer of multitenant communications real estate.
The above daily chart formed an approximately 3-month-long H&S bottom chart pattern as a bullish reversal after a downtrend.
The horizontal boundary at 193.43 levels acts as a resistance within this pattern.
A daily close above 199.2 levels would validate the breakout from the 3-month-long H&S bottom chart pattern.
Based on this chart pattern, the potential price target is 220 levels.
CNX Resources Corporation-(CNX/NYSE)-Long Idea
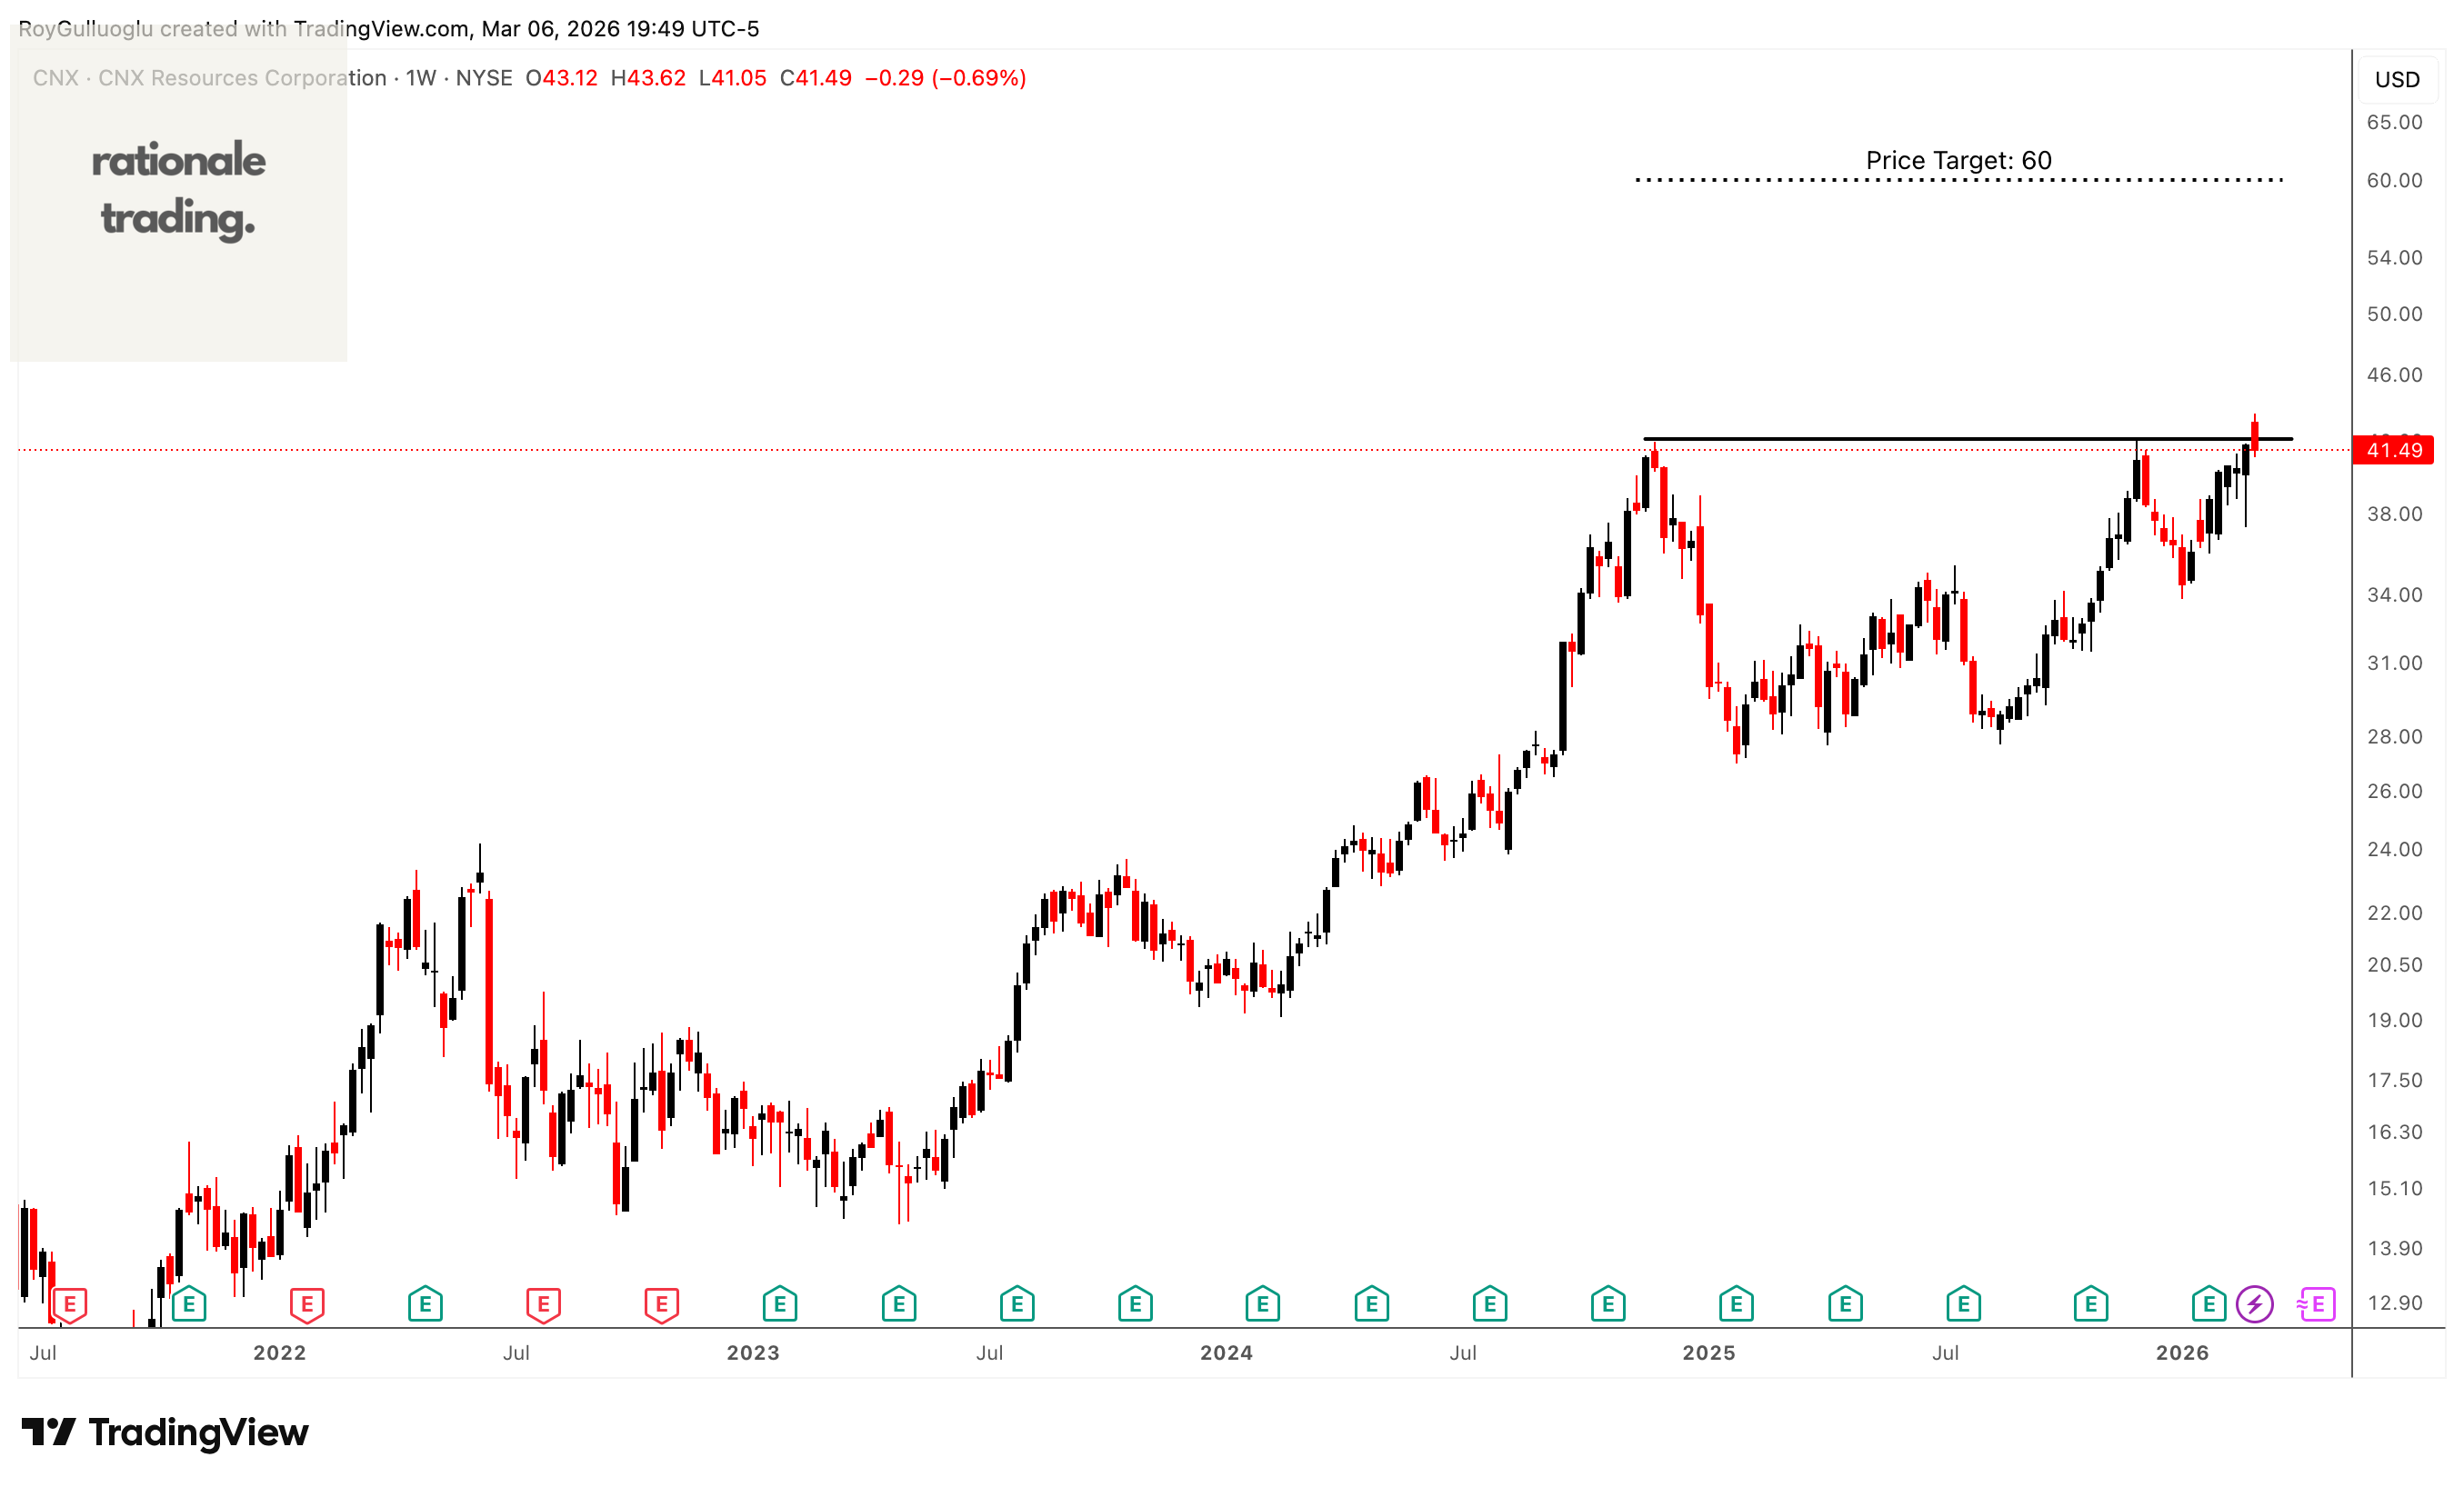
CNX Resources Corporation, an independent natural gas and midstream company, engages in the acquisition, exploration, development, and production of natural gas properties in the Appalachian Basin.
The above daily chart formed an approximately 3-month-long cup & handle chart pattern as a bullish continuation after an uptrend.
The horizontal boundary at 42.13 levels acts as a resistance within this pattern.
A daily close above 43.4 levels would validate the breakout from the 3-month-long cup & handle chart pattern.
Based on this chart pattern, the potential price target is 60 levels.
Murphy Oil Corporation-(MUR/NYSE)-Long Idea
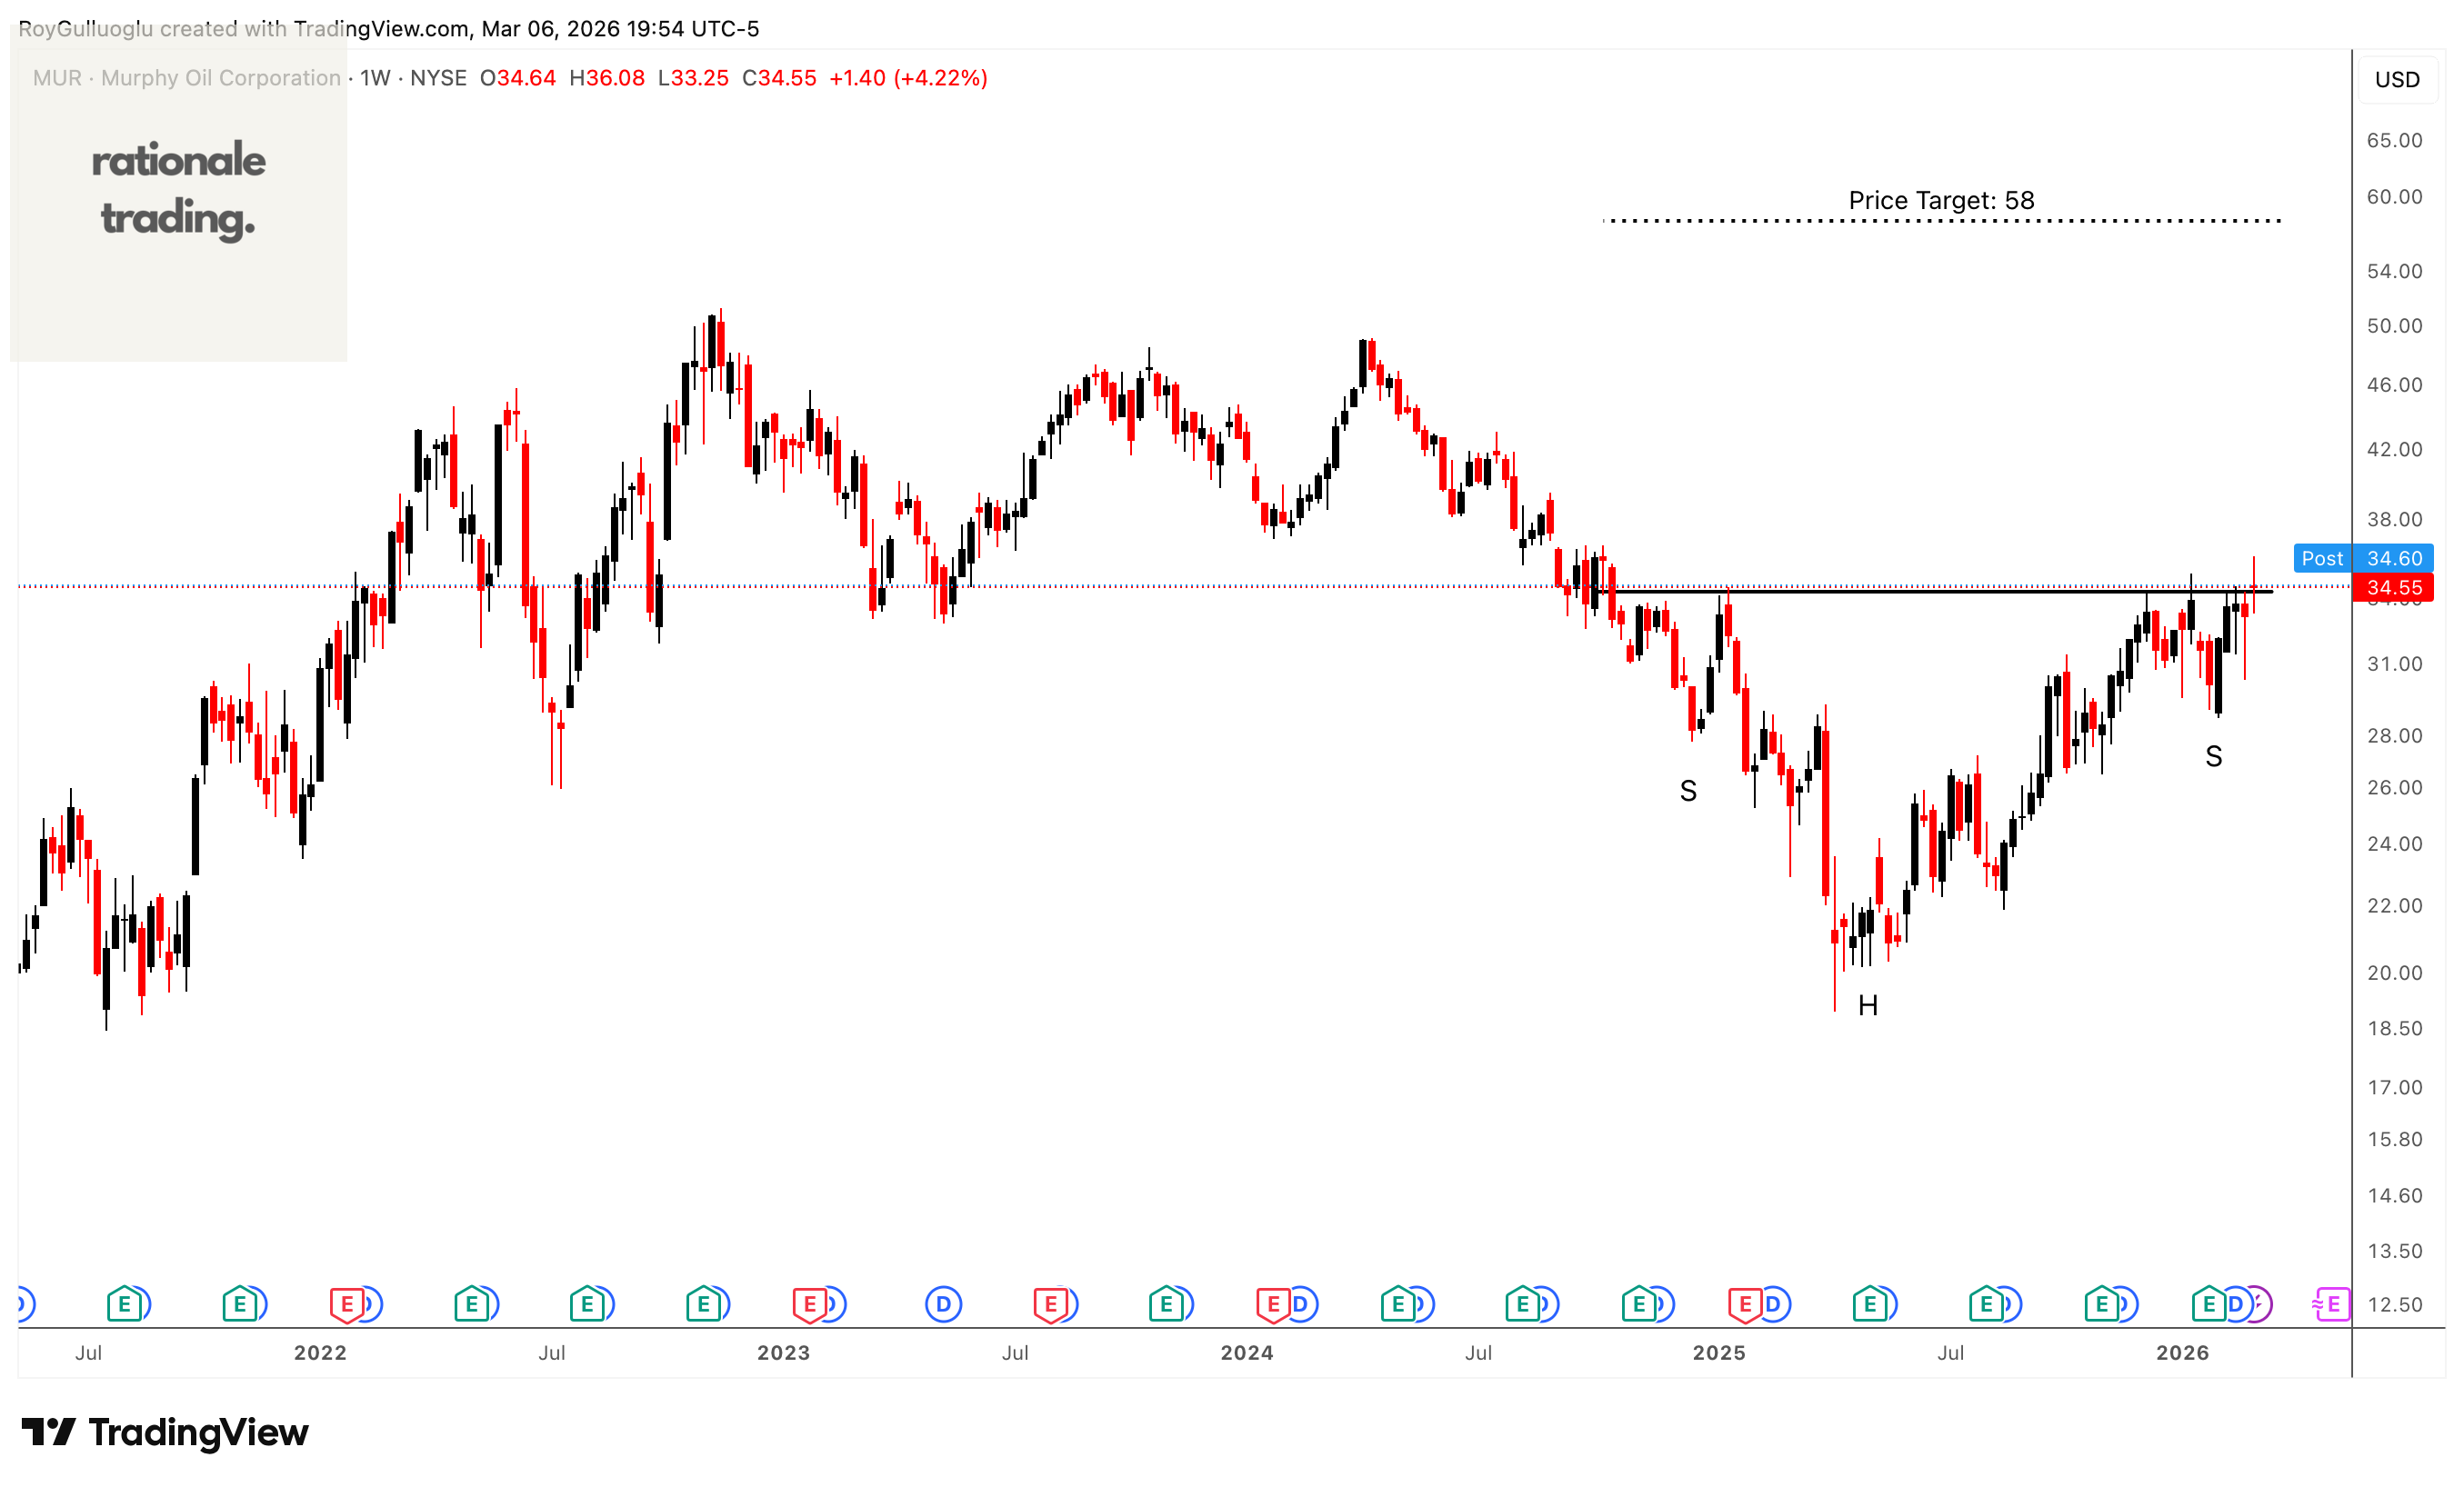
Murphy Oil Corporation, together with its subsidiaries, operates as an oil and gas exploration and production company in the United States, Canada, and internationally.
The above daily chart formed an approximately 18-month-long H&S bottom chart pattern as a bullish reversal after a downtrend.
The horizontal boundary at 34.32 levels acts as a resistance within this pattern.
A daily close above 35.6 levels would validate the breakout from the 18-month-long H&S bottom chart pattern.
Based on this chart pattern, the potential price target is 58 levels.