

Trade Ideas Equities
EXC(NASDAQ), SATS(NASDAQ), SIBN(NASDAQ), BUR(NYSE), ISS(OMXCOP), PUB(EURONEXT), ENGI(EURONEXT)

Exelon Corporation-(EXC/NASDAQ)-Long Idea
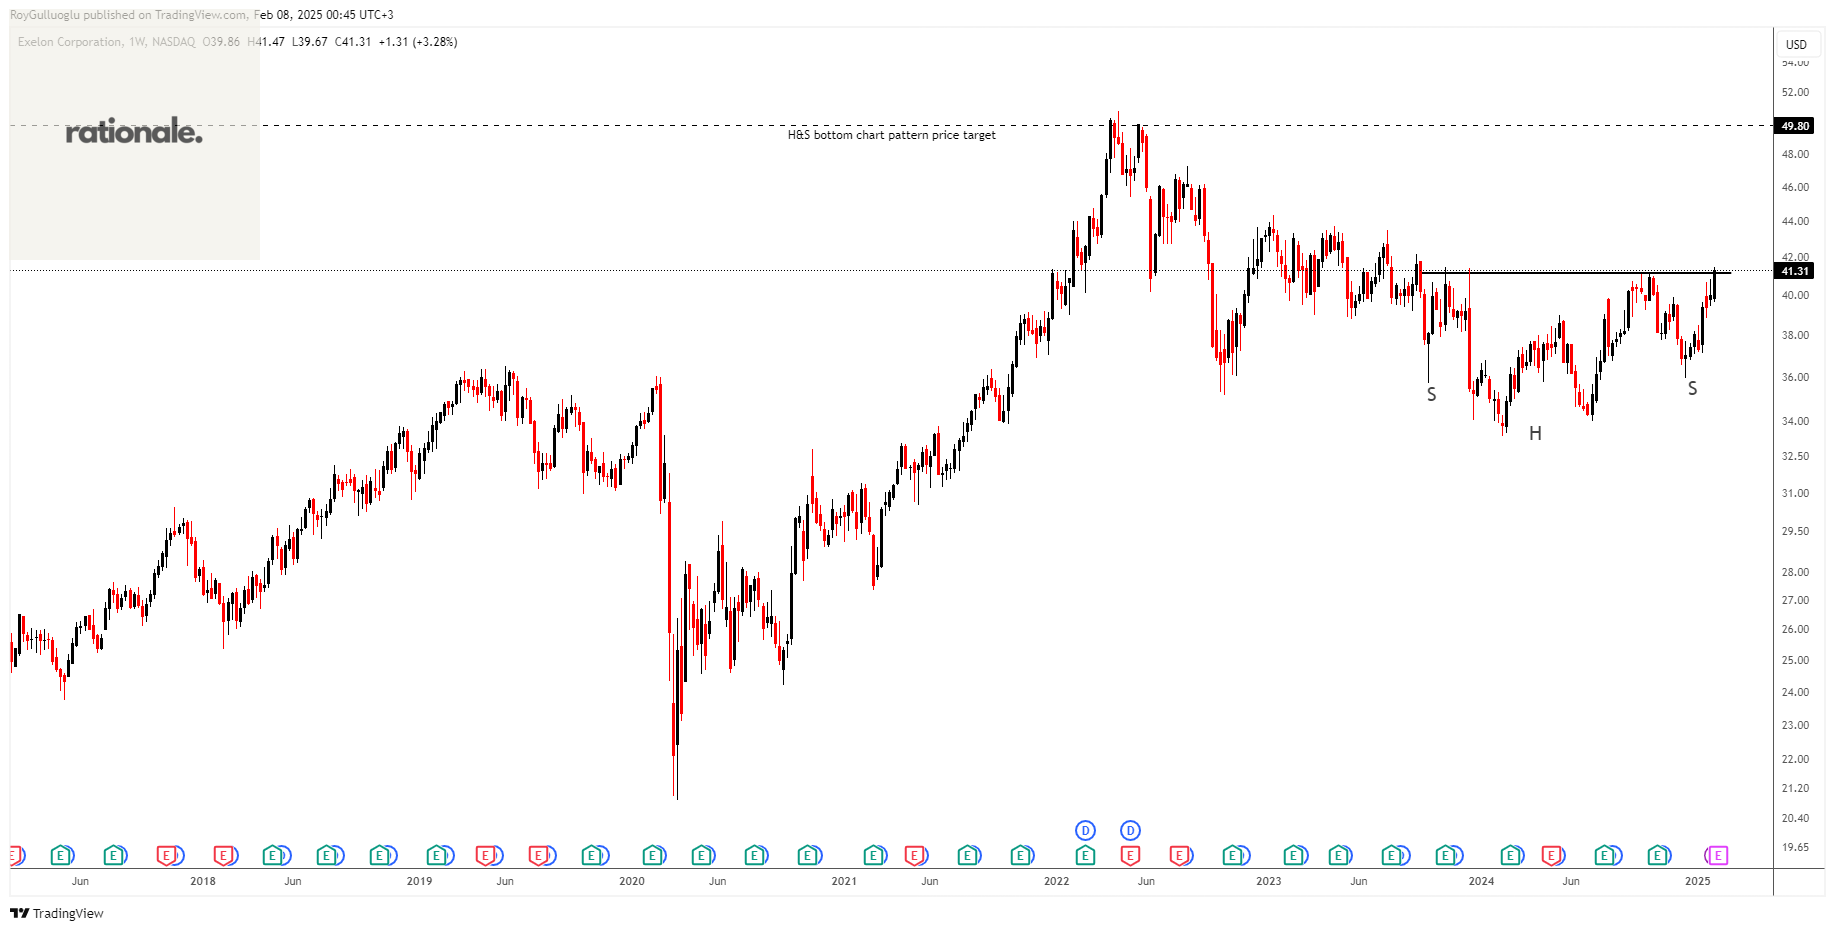
Exelon Corporation, a utility services holding company, engages in the energy distribution and transmission businesses in the United States and Canada.
The above weekly chart formed an approximately 17-month-long H&S bottom chart pattern as a bullish reversal after a downtrend.
The horizontal boundary at 41.18 levels acts as a resistance within this pattern.
A daily close above 42.4 levels would validate the breakout from the 17-month-long H&S bottom chart pattern.
Based on this chart pattern, the potential price target is 49.8 levels.
EXC, classified under the "utilities" sector, falls under the “Large Cap - Income” stock category.
EchoStar Corporation-(SATS/NASDAQ)-Long Idea
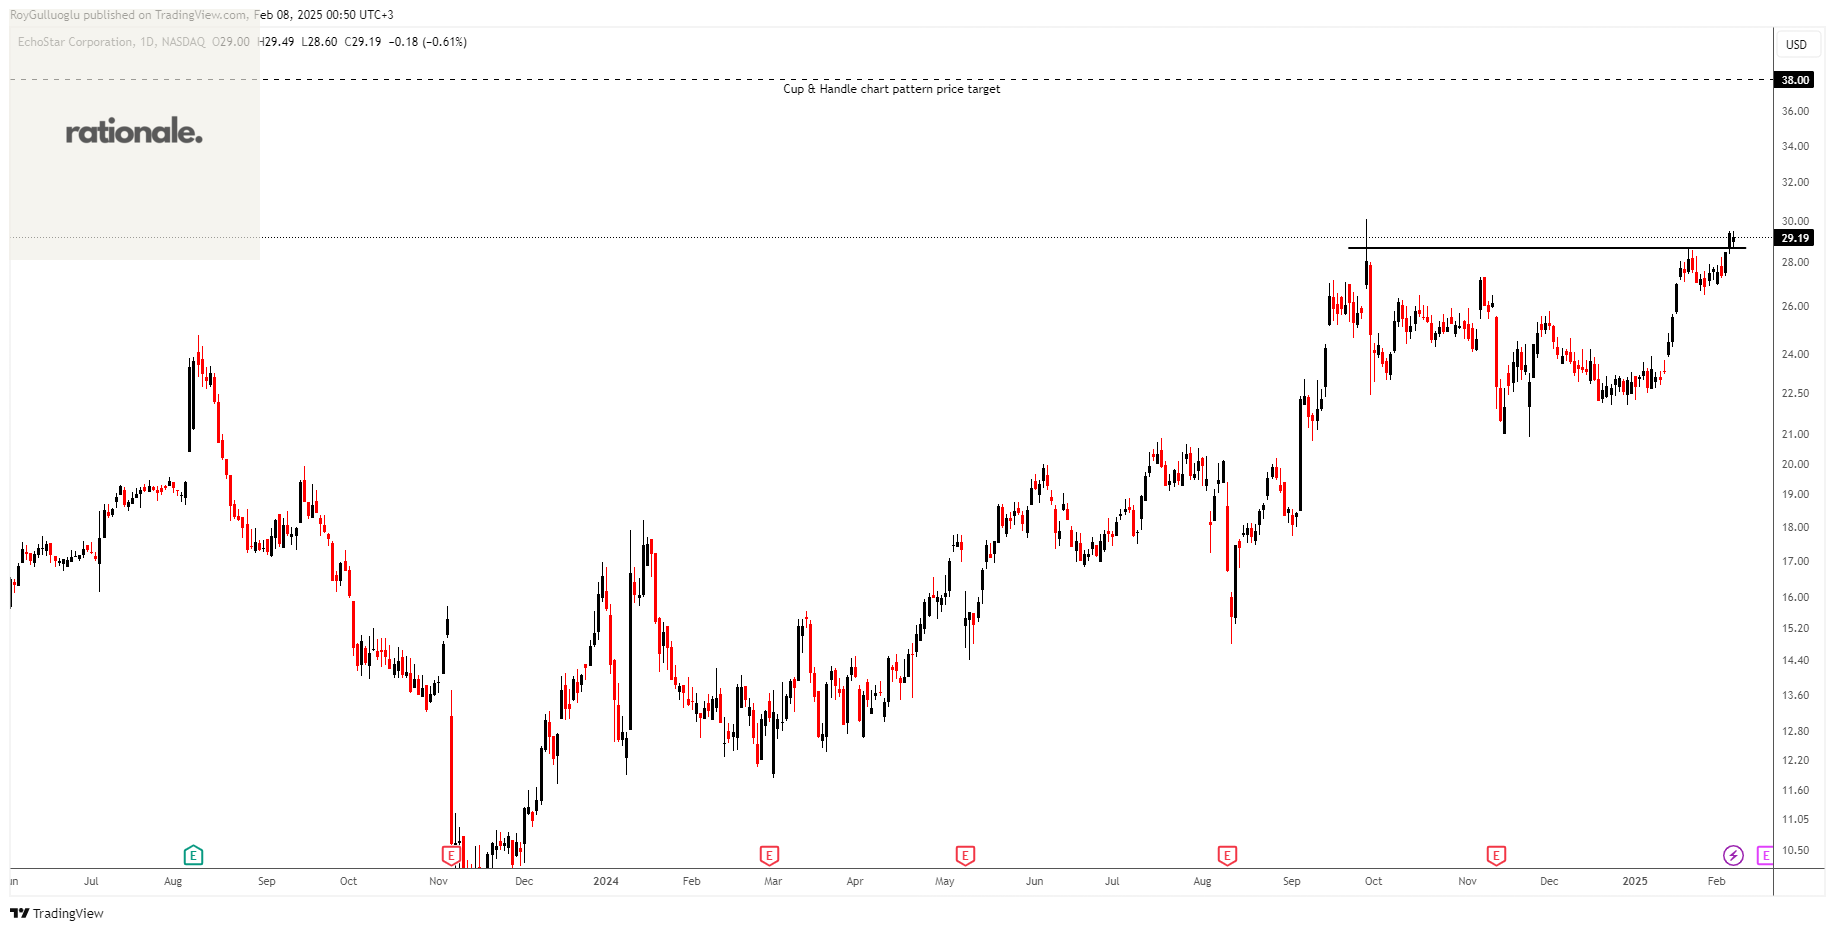
EchoStar Corporation, together with its subsidiaries, provides networking technologies and services worldwide.
The above daily chart formed an approximately 3-month-long Cup & Handle continuation chart pattern as a bullish continuation after an uptrend.
The horizontal boundary at 28.68 levels acts as a resistance within this pattern.
A daily close above 29.54 levels would validate the breakout from the 3-month-long Cup & Handle continuation chart pattern.
Based on this chart pattern, the potential price target is 38 levels.
SATS, classified under the "technology" sector, falls under the “Mid Cap - Growth” stock category.
SI-BONE, Inc.-(SIBN/NASDAQ)-Long Idea
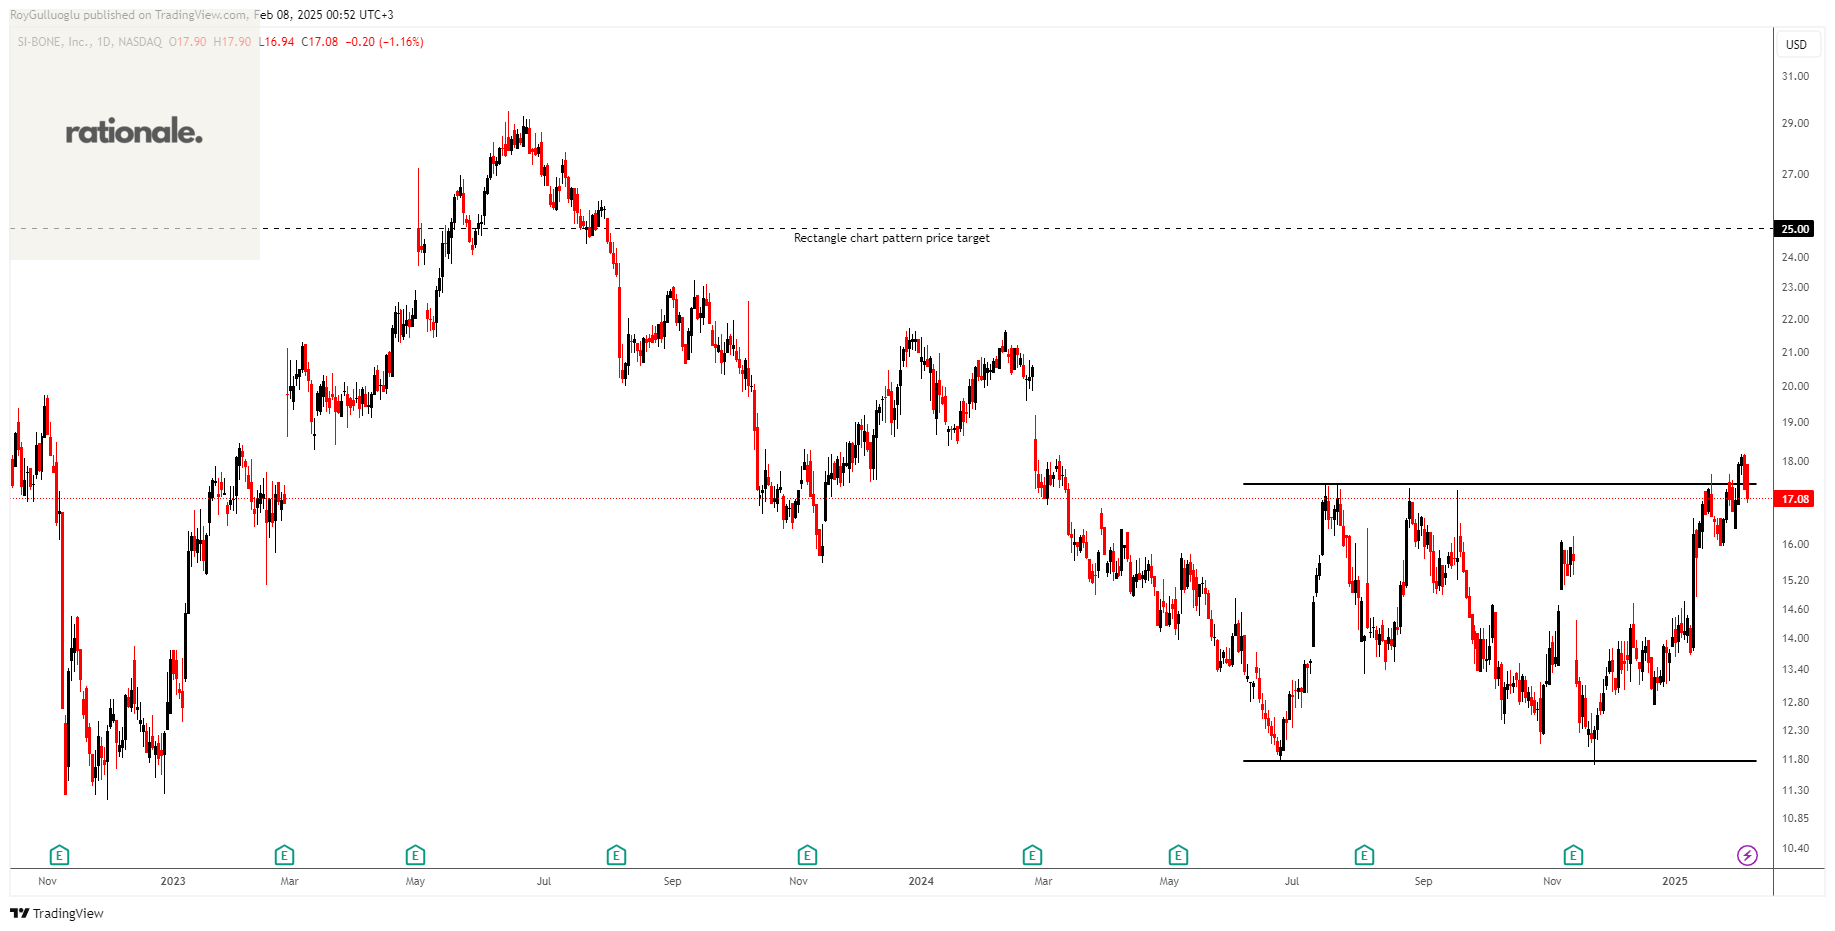
SI-BONE, Inc., a medical device company, that operate to solve musculoskeletal disorders of the sacropelvic anatomy in the United States and internationally.
The above daily chart formed an approximately 5-month-long rectangle chart pattern as a bullish reversal after a downtrend.
The horizontal boundary at 17.42 levels acts as a resistance within this pattern.
A daily close above 17.94 levels would validate the breakout from the 5-month-long rectangle chart pattern.
Based on this chart pattern, the potential price target is 25 levels.
SIBN, classified under the "healthcare" sector, falls under the “Small Cap - Value” stock category.
Burford Capital Limited -(BUR/NYSE)-Long Idea
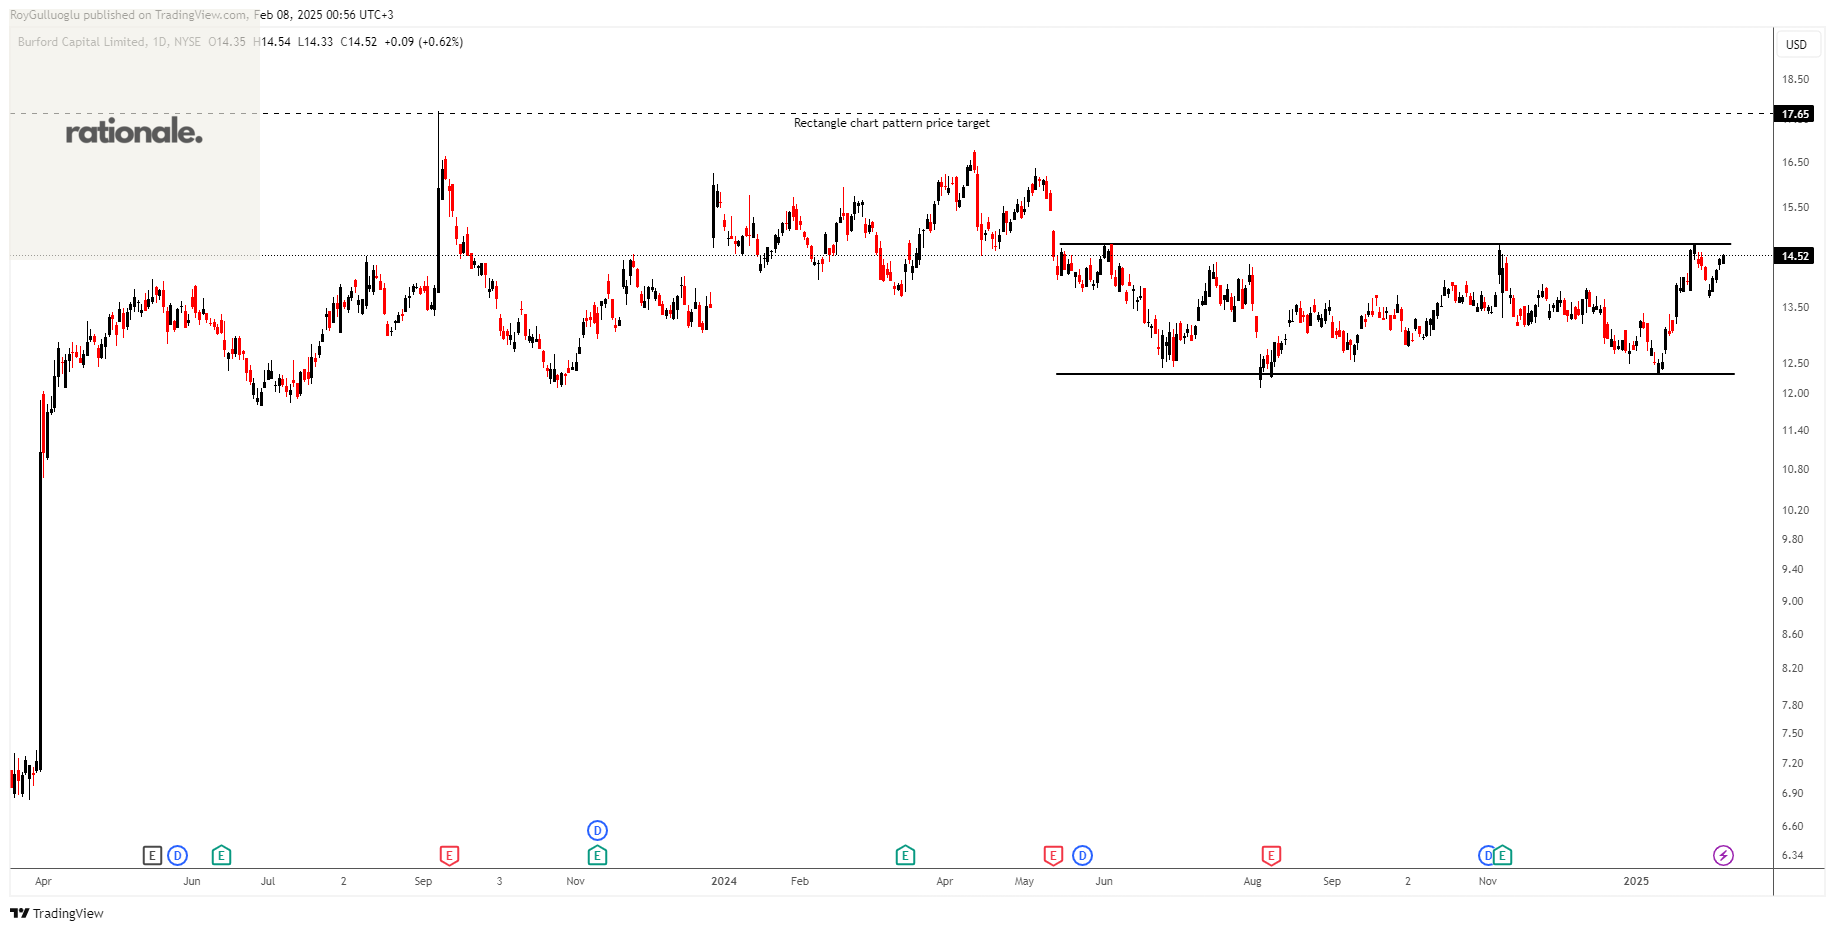
Burford Capital Limited provides legal finance products and services worldwide. The company operates through two segments, Capital Provision, and Asset Management and Other Provision.
The above daily chart formed an approximately 6-month-long rectangle chart pattern as a bullish reversal after a downtrend.
The horizontal boundary at 14.74 levels acts as a resistance within this pattern.
A daily close above 15.18 levels would validate the breakout from the 6-month-long rectangle chart pattern.
Based on this chart pattern, the potential price target is 17.65 levels.
BUR, classified under the "financial services" sector, falls under the “Mid Cap - Income” stock category.
ISS A/S-(ISS/OMXCOP)-Long Idea
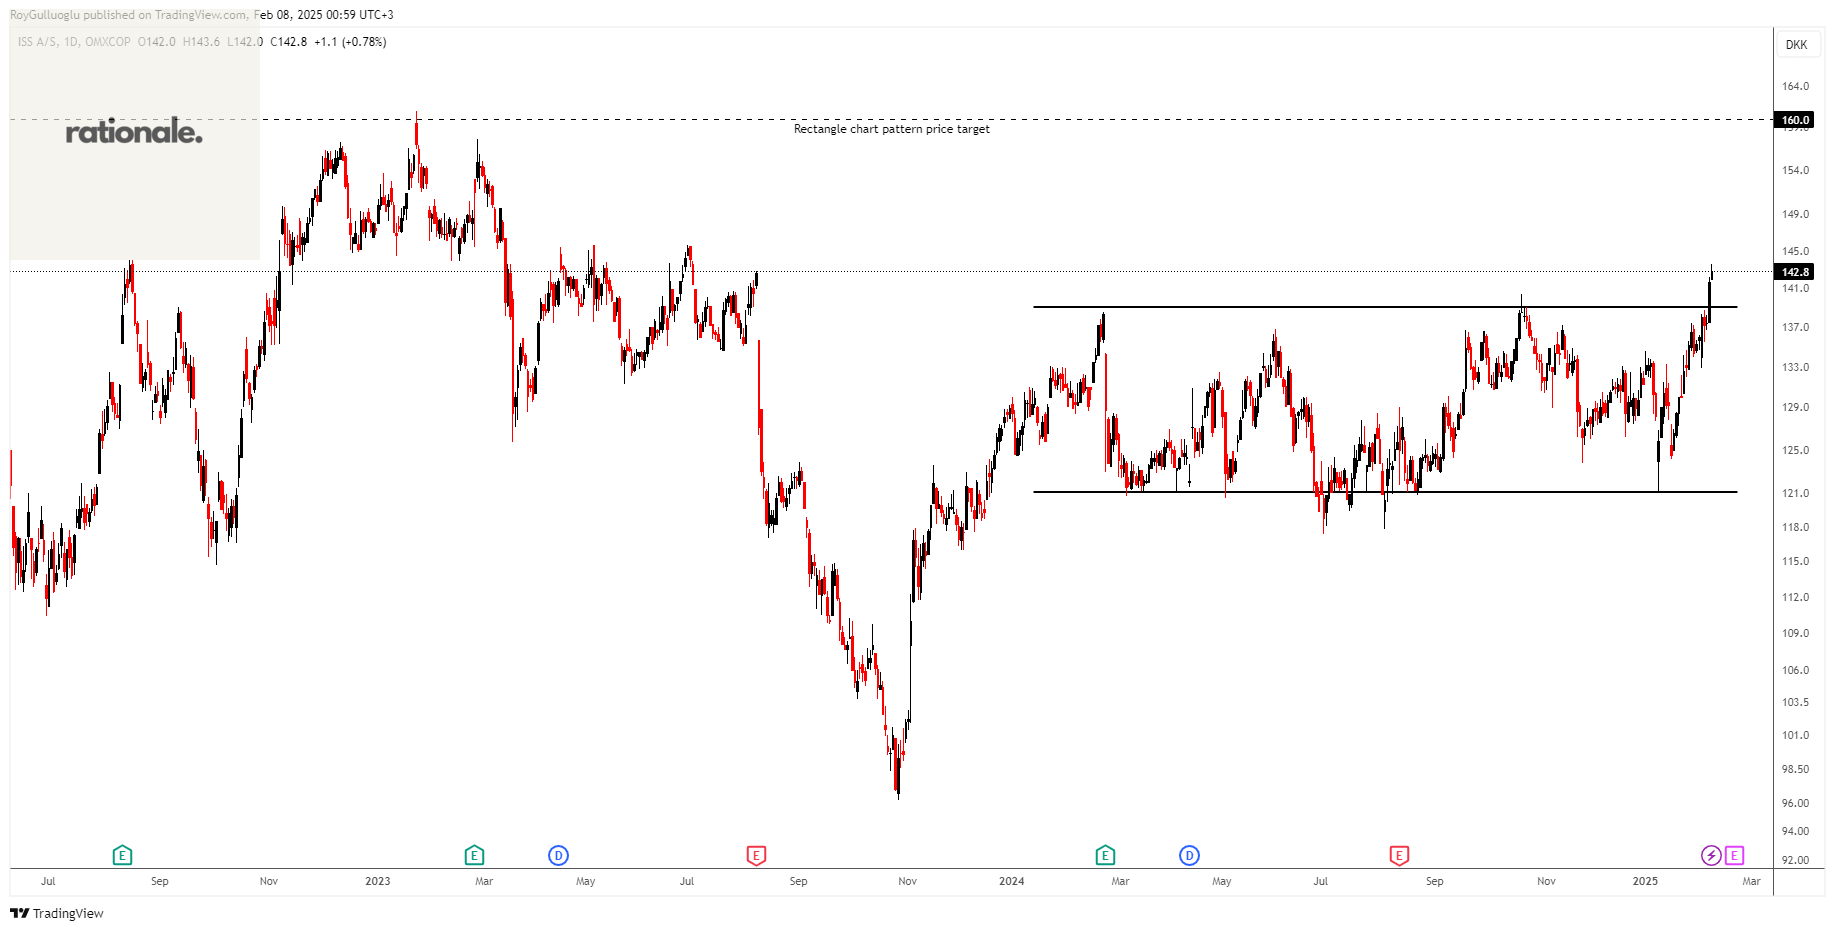
ISS A/S operates as workplace experience and facility management company in the United Kingdom, Ireland, the United States, Canada, Switzerland, Germany, Australia, New Zealand, Türkiye, Spain, Denmark, and internationally.
The above daily chart formed an approximately 7-month-long rectangle chart pattern as a bullish continuation after an uptrend.
The horizontal boundary at 139 levels acts as a resistance within this pattern.
A daily close above 143.15 levels would validate the breakout from the 7-month-long rectangle chart pattern.
Based on this chart pattern, the potential price target is 160 levels.
ISS, classified under the "industrials" sector, falls under the “Mid Cap - Value” stock category.
Publicis Groupe S.A.-(PUB/EURONEXT)-Long Idea
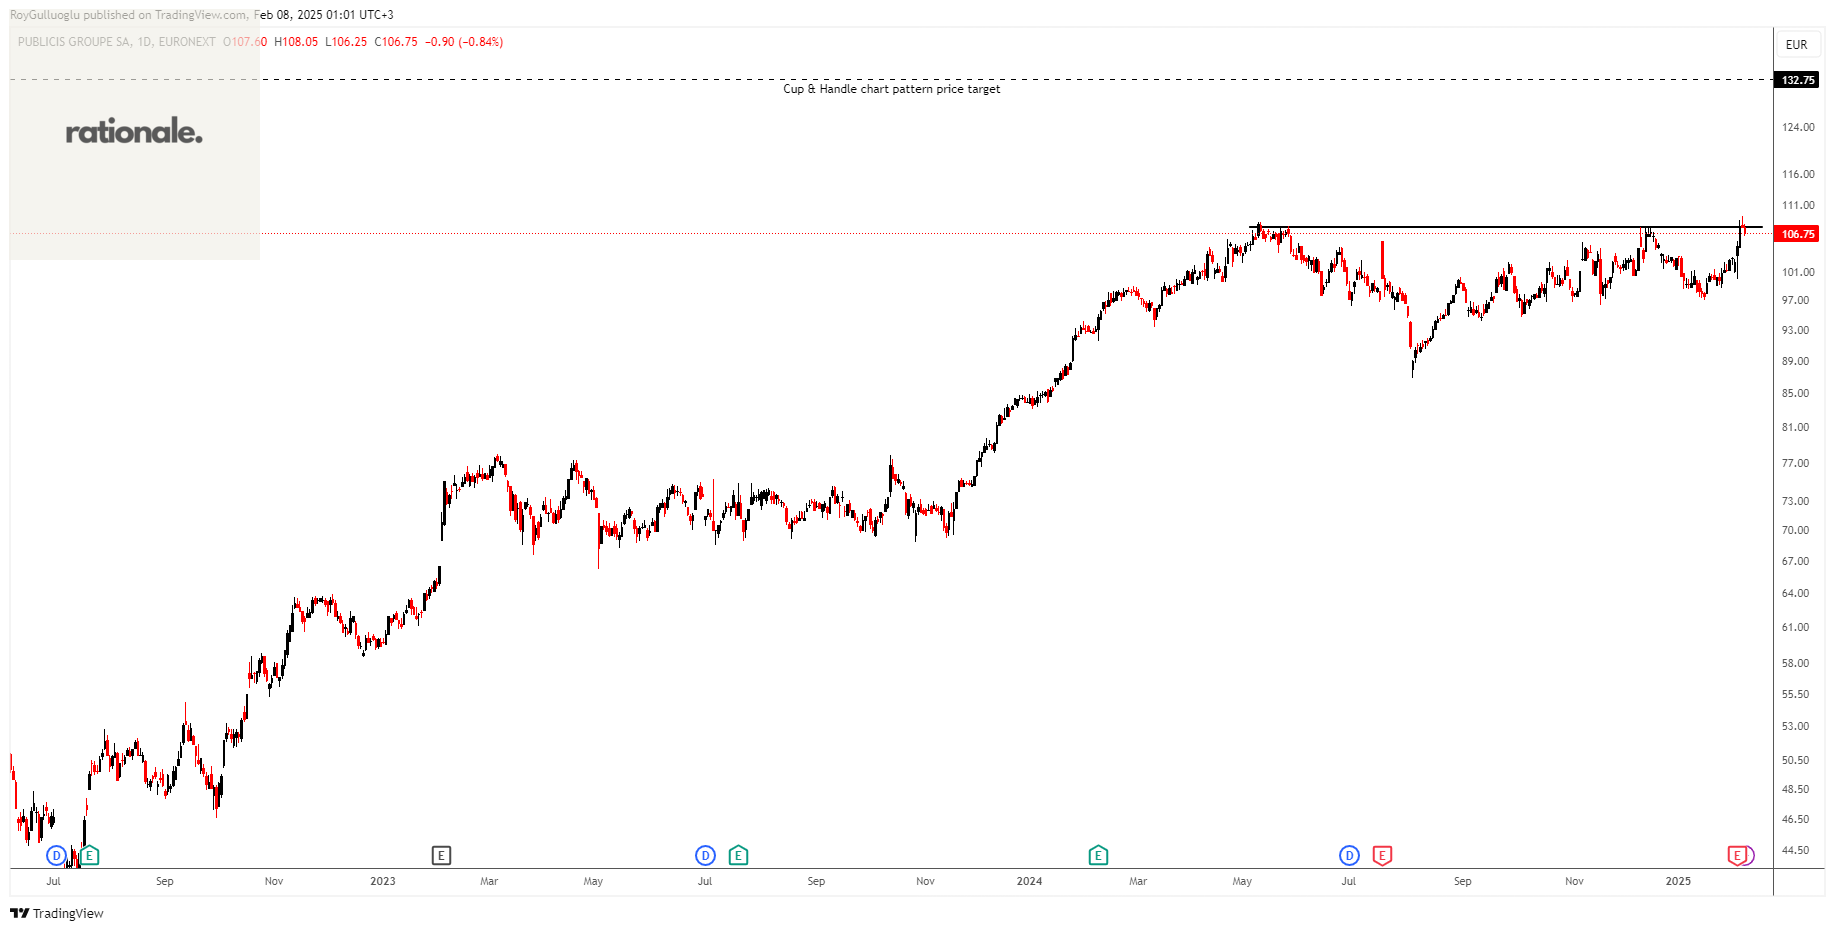
Publicis Groupe S.A. provides marketing, communications, and digital business transformation services in North America, Europe, the Asia Pacific, Latin America, Africa, and the Middle East.
The above daily chart formed an approximately 6-month-long Cup & Handle continuation chart pattern as a bullish continuation after an uptrend.
The horizontal boundary at 107.65 levels acts as a resistance within this pattern.
A daily close above 110.8 levels would validate the breakout from the 6-month-long Cup & Handle continuation chart pattern.
Based on this chart pattern, the potential price target is 132.75 levels.
PUB, classified under the "communication services" sector, falls under the “Large Cap - Growth” stock category.
Engie SA-(ENGI/EURONEXT)-Long Idea
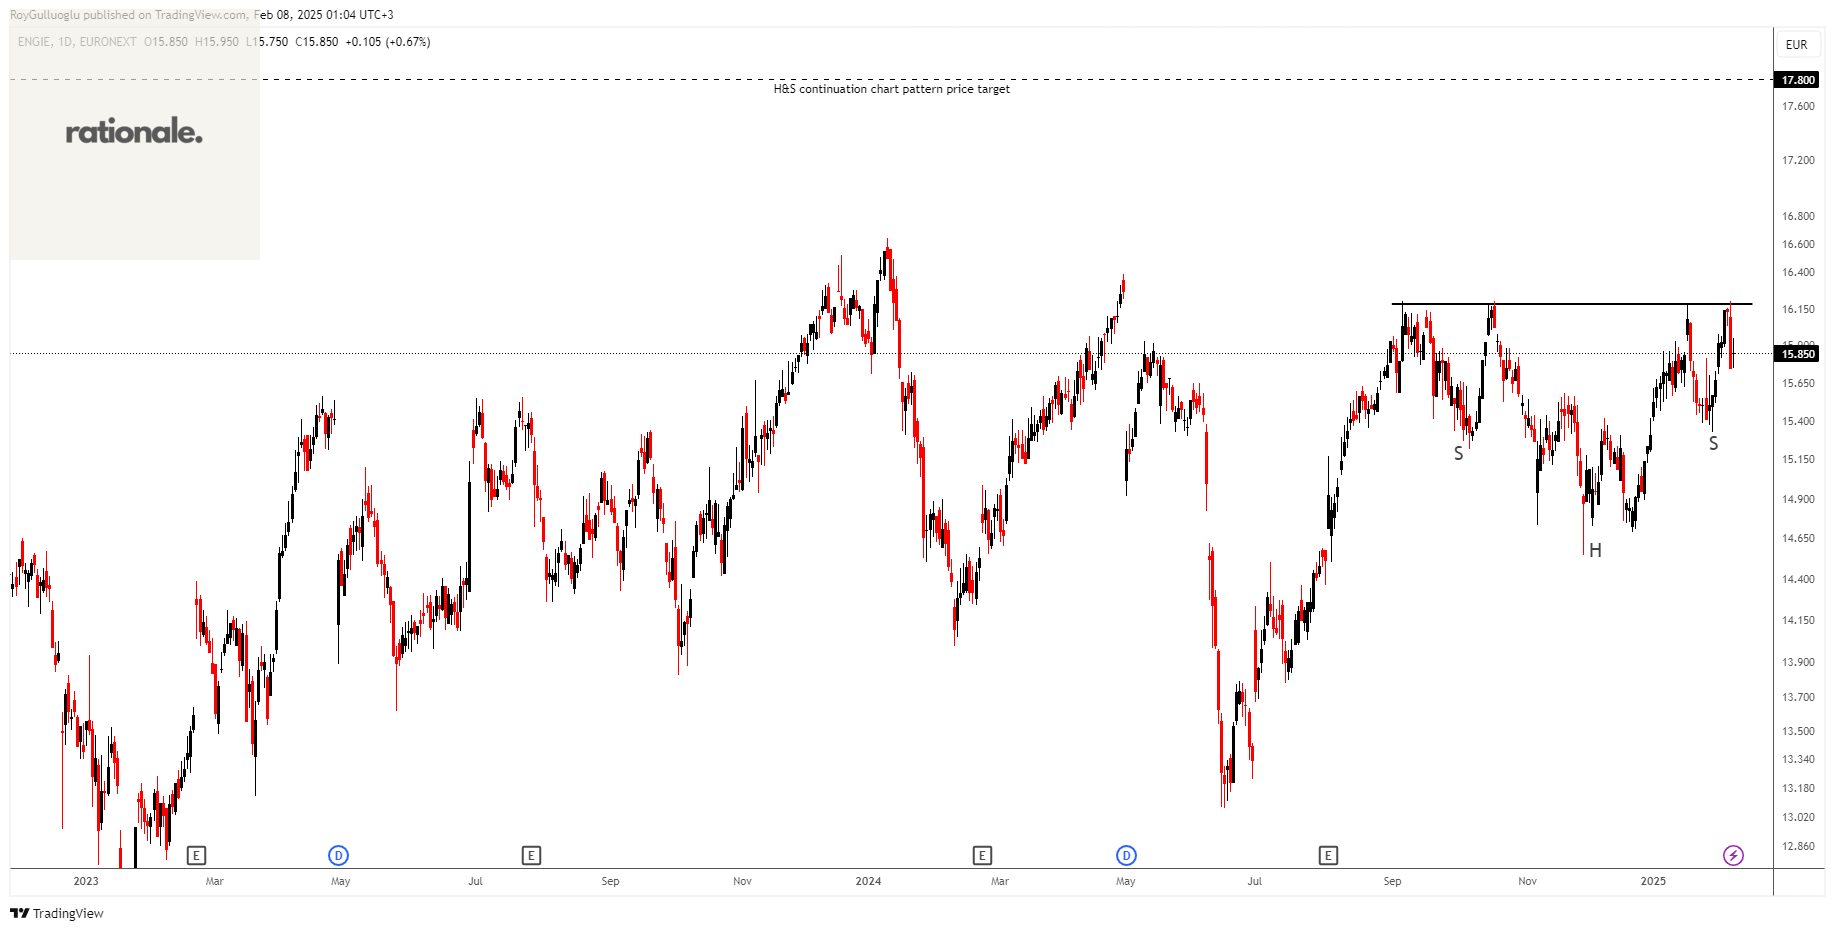
ENGIE SA engages in the power, natural gas, and energy services businesses. It operates through Renewables, Networks, Energy Solutions, FlexGen, Retail, Nuclear, and Others segments.
The above daily chart formed an approximately 4-month-long H&S continuation chart pattern as a bullish continuation after an uptrend.
The horizontal boundary at 16.18 levels acts as a resistance within this pattern.
A daily close above 16.65 levels would validate the breakout from the 4-month-long H&S continuation chart pattern.
Based on this chart pattern, the potential price target is 17.8 levels.
ENGI, classified under the "utilities" sector, falls under the “Large Cap - Income” stock category.
Teşekkürler Roy