


GoDaddy Inc.-(GDDY/NYSE)-Long Idea
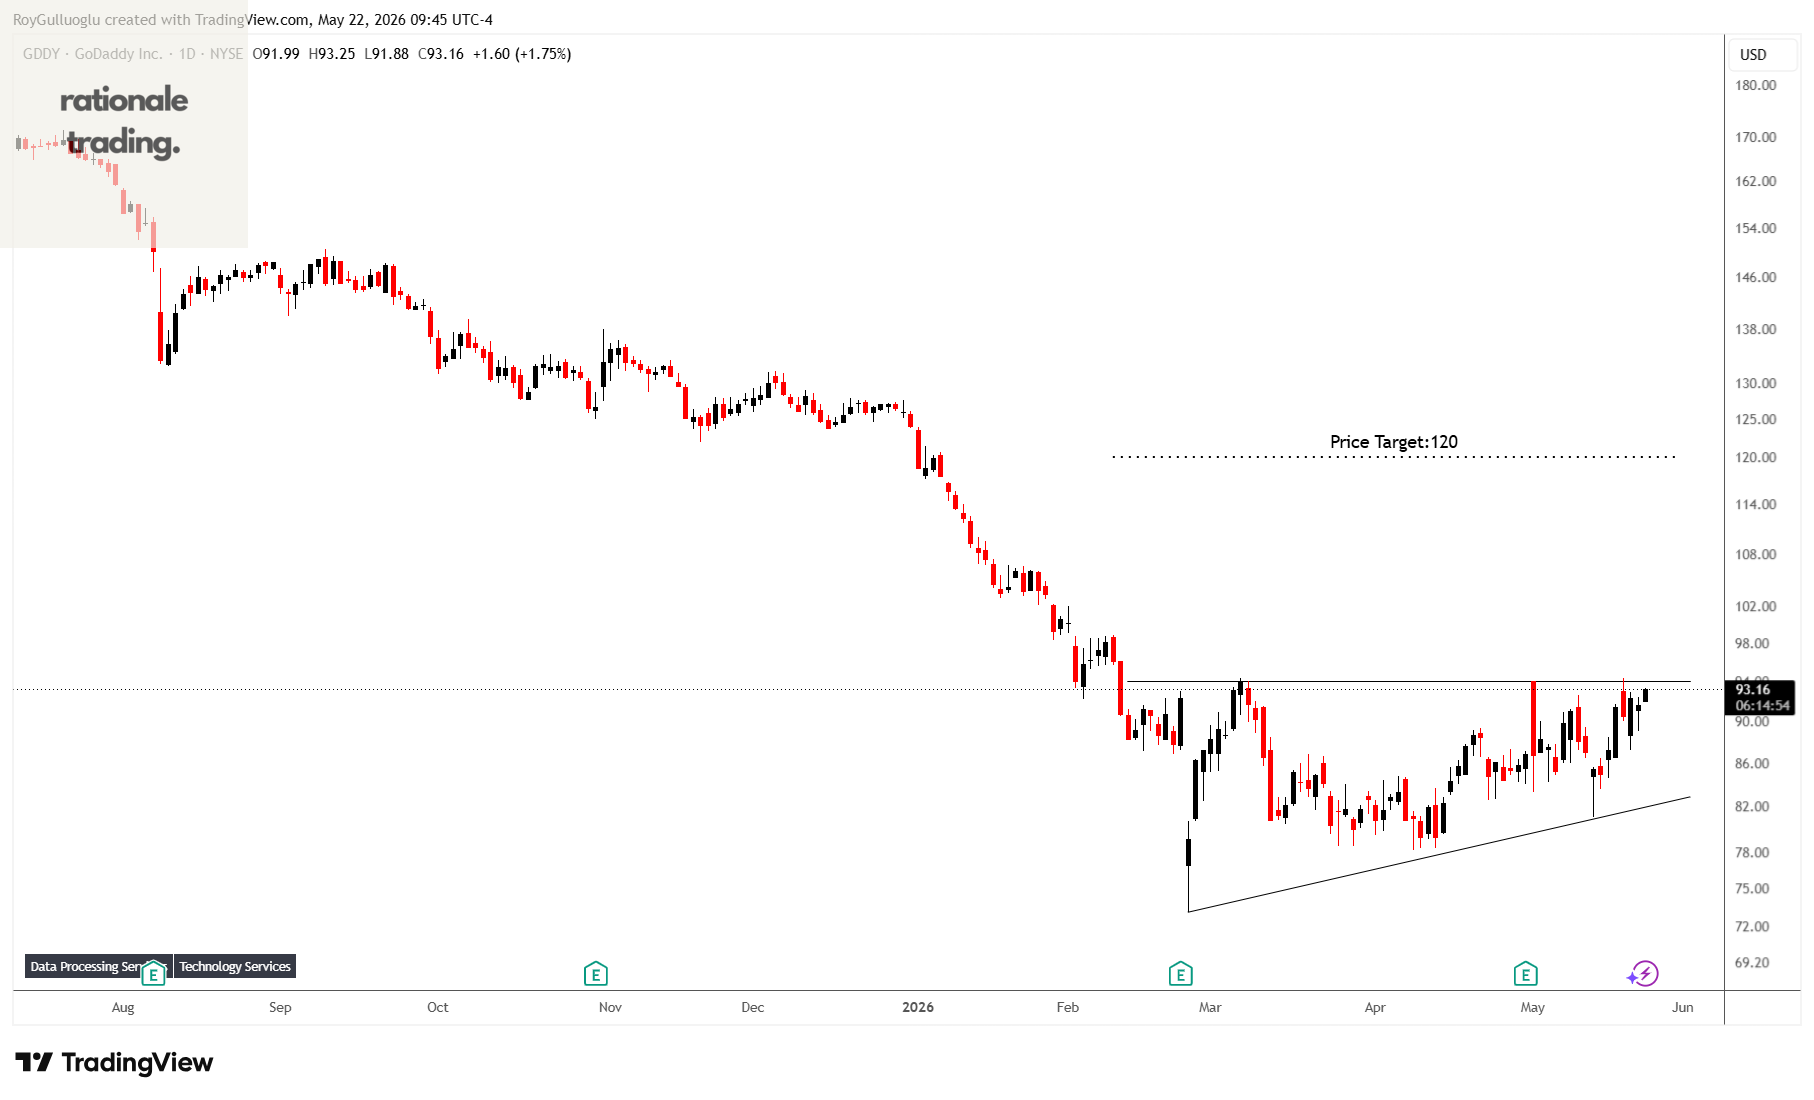
GoDaddy Inc. engages in the design and development of cloud-based products in the United States and internationally. It operates in two segments: Applications and Commerce (A&C), and Core Platform (Core).
The above daily chart formed an approximately 2-month-long ascending triangle chart pattern as a bullish reversal after a downtrend.
The horizontal boundary at 93.95 levels acts as a resistance within this pattern.
A daily close above 96.75 levels would validate the breakout from the 2-month-long ascending triangle chart pattern.
Based on this chart pattern, the potential price target is 120 levels.
monday.com Ltd.-(MNDY/NASDAQ)-Long Idea
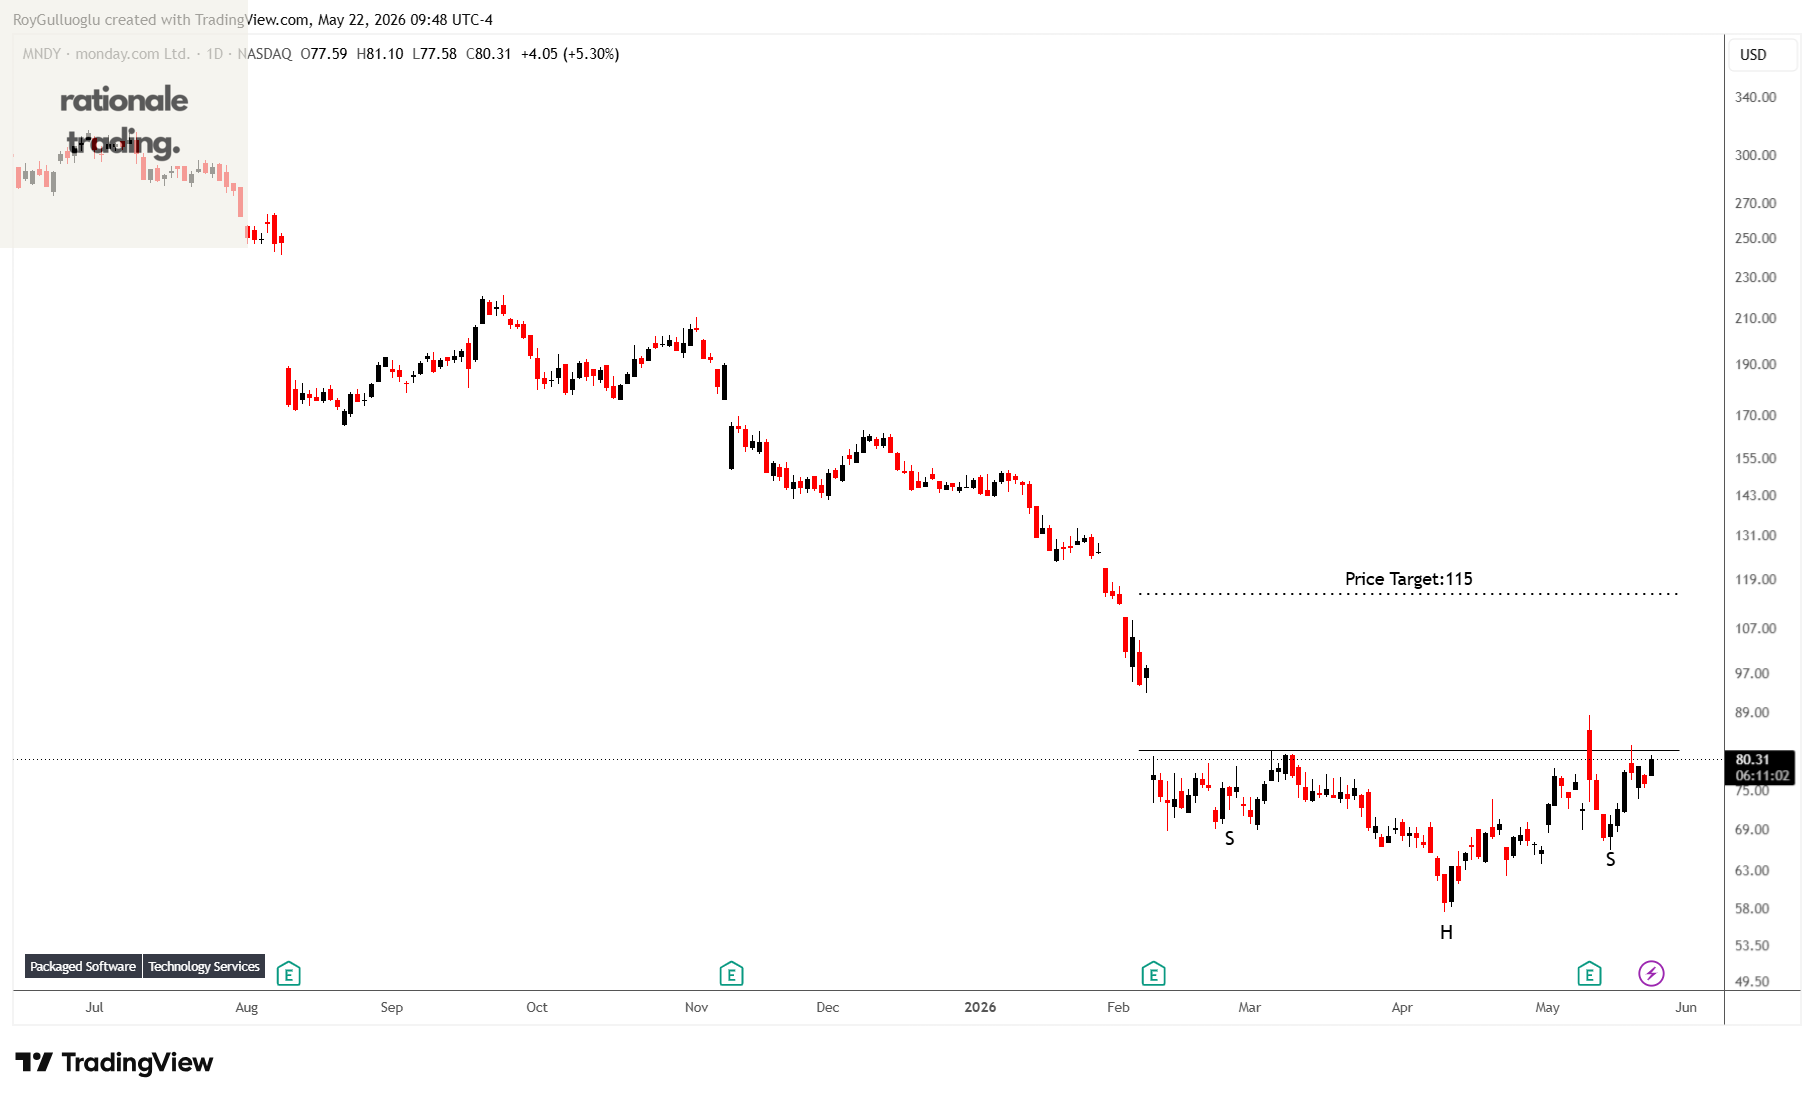
monday.com Ltd., together with its subsidiaries, develops software applications in the United States, Europe, the Middle East, Africa, the United Kingdom, and internationally.
The above daily chart formed an approximately 2-month-long H&S bottom chart pattern as a bullish reversal after a downtrend.
The horizontal boundary at 81.85 levels acts as a resistance within this pattern.
A daily close above 84.3 levels would validate the breakout from the 2-month-long H&S bottom chart pattern.
Based on this chart pattern, the potential price target is 115 levels.
Astronics Corporation-(ATRO/NASDAQ)-Long Idea
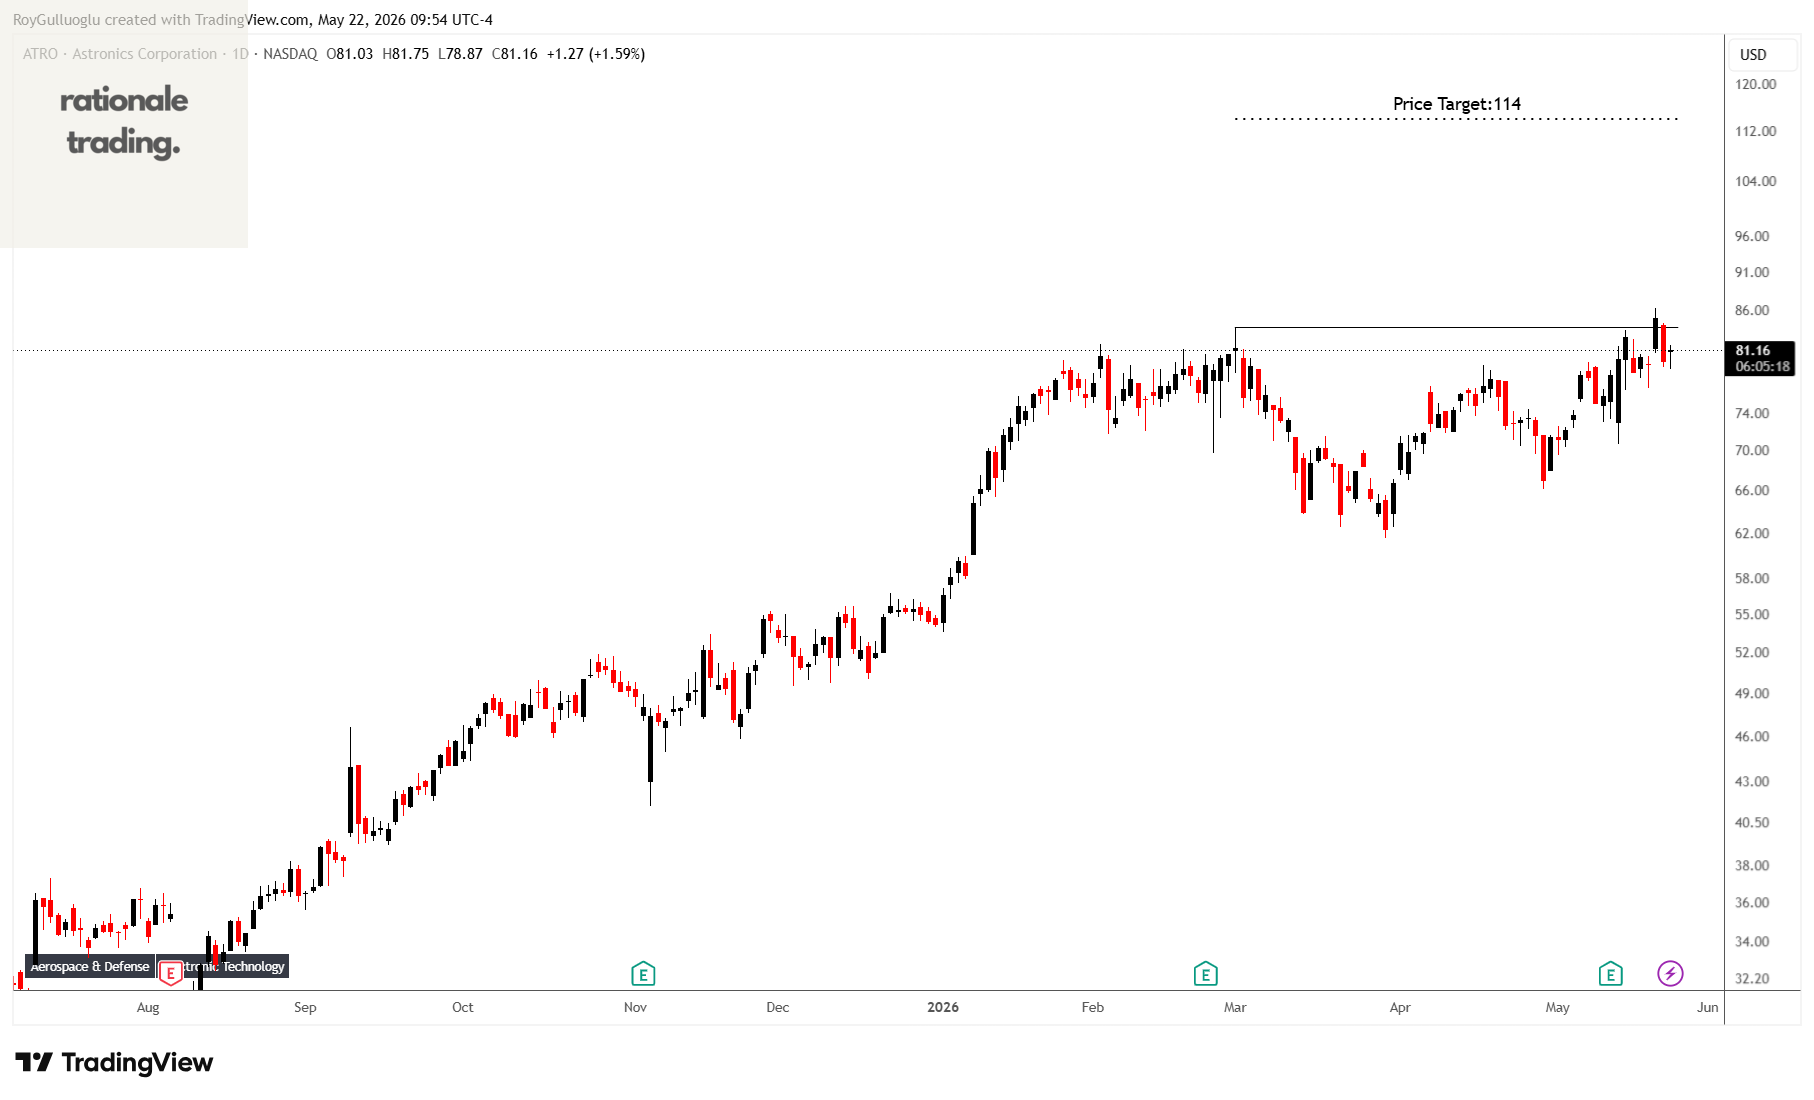
Astronics Corporation, through its subsidiaries, designs and manufactures products for the aerospace, defense, and electronics industries in the United States, rest of North America, Asia, Europe, South America, and internationally.
The above daily chart formed an approximately 2-month-long cup & handle chart pattern as a bullish continuation after an uptrend.
The horizontal boundary at 83.96 levels acts as a resistance within this pattern.
A daily close above 86.48 levels would validate the breakout from the 2-month-long cup & handle chart pattern.
Based on this chart pattern, the potential price target is 114 levels.
The Gunma Bank, Ltd.-(8334/TSE)-Long Idea
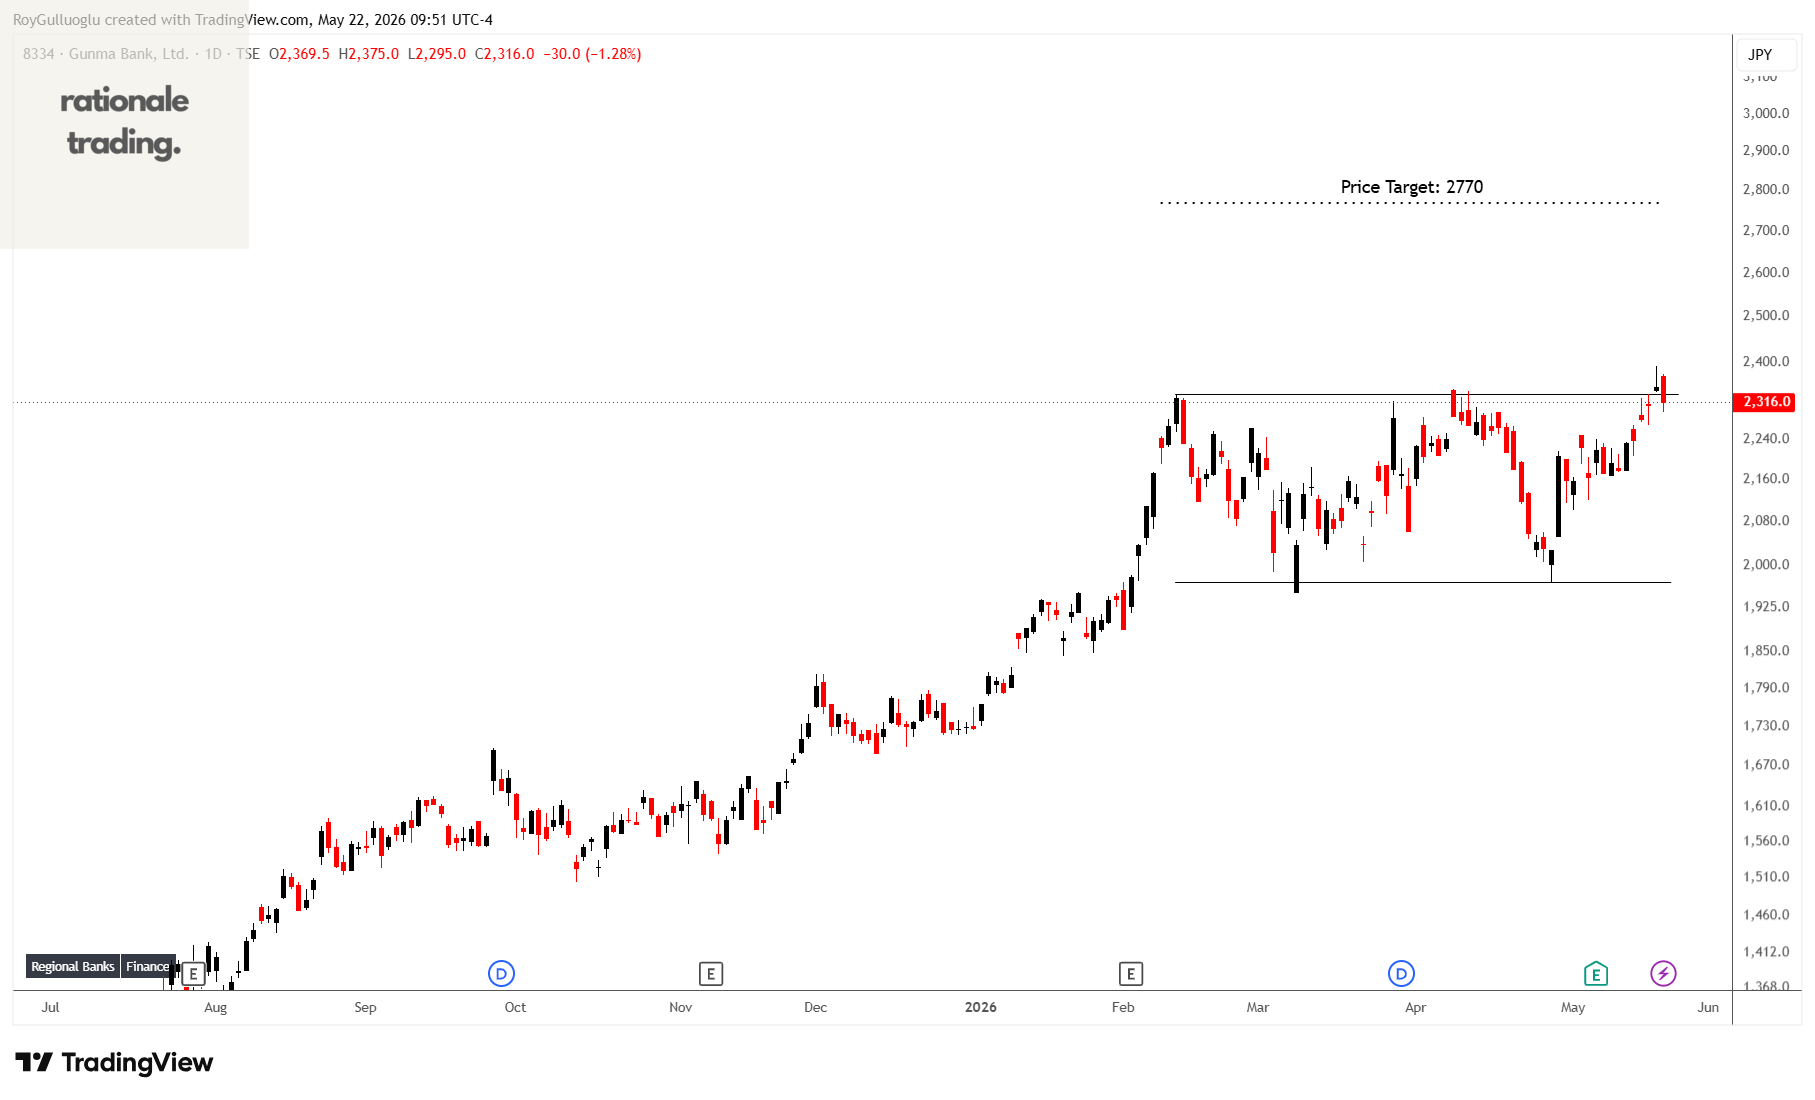
The Gunma Bank, Ltd. provides various banking and financial services in Japan. It operates through Banking and Lease segments.
The above daily chart formed an approximately 2-month-long rectangle chart pattern as a bullish continuation after an uptrend.
The horizontal boundary at 2332.5 levels acts as a resistance within this pattern.
A daily close above 2400 levels would validate the breakout from the 2-month-long rectangle chart pattern.
Based on this chart pattern, the potential price target is 2770 levels.