


Hudbay Minerals Inc.-(HBM/NYSE)-Long Idea
Hudbay Minerals Inc., a diversified mining company, focuses on the exploration, development, operation, and optimization of properties in North and South America.
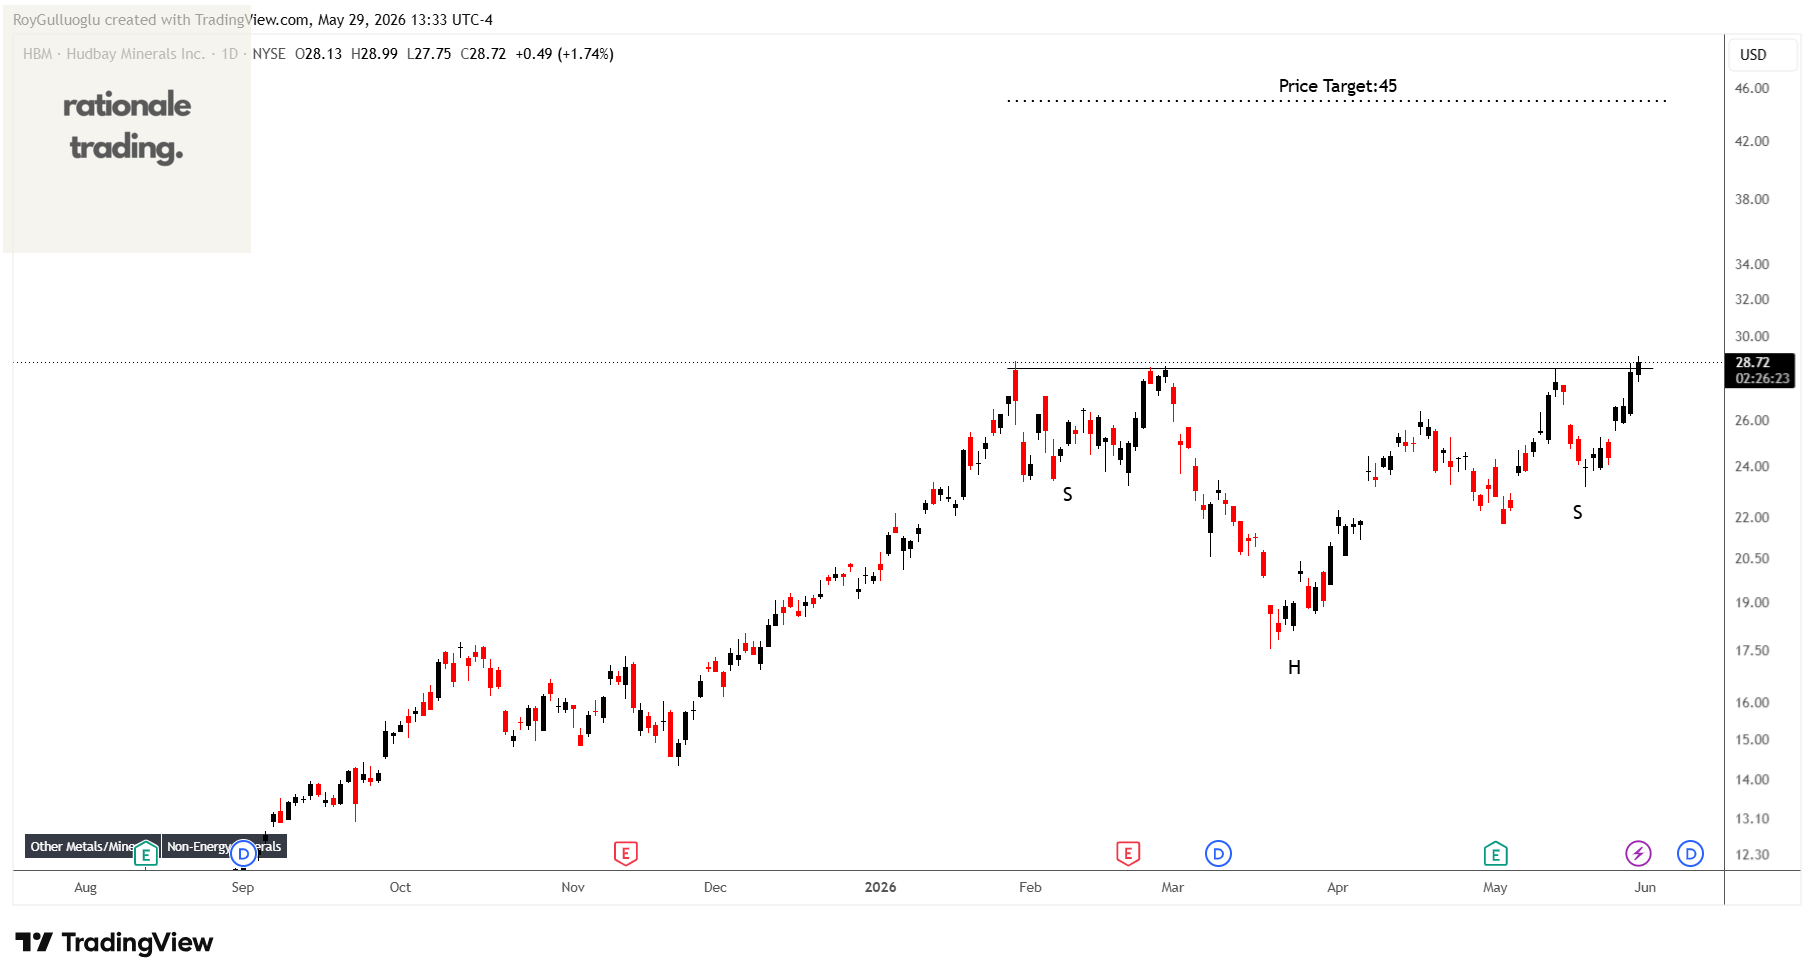
The above daily chart formed an approximately 3-month-long H&S continuation chart pattern as a bullish continuation after an uptrend.
The horizontal boundary at 28.42 levels acts as a resistance within this pattern.
A daily close above 29.27 levels would validate the breakout from the 3-month-long H&S continuation chart pattern.
Based on this chart pattern, the potential price target is 45 levels.
ATI Inc.-(ATI/NYSE)-Long Idea
ATI Inc. produces and sells specialty materials and complex components worldwide. It operates in two segments, High Performance Materials & Components, and Advanced Alloys & Solutions
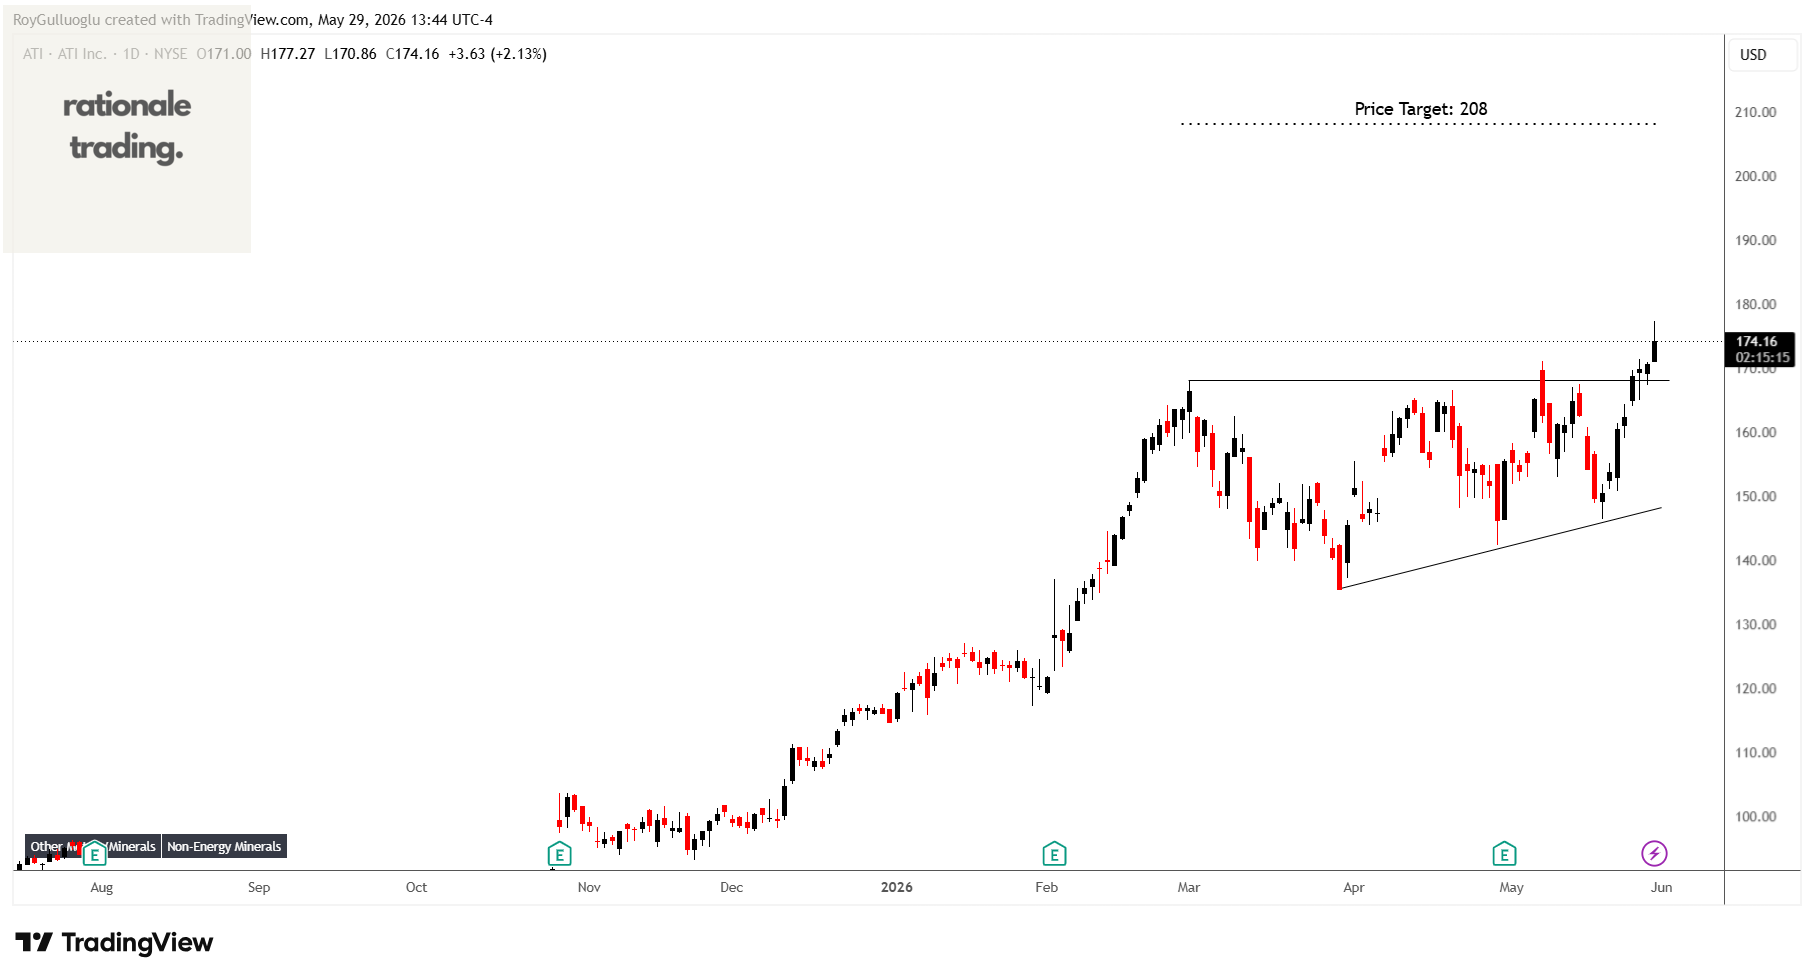
The above daily chart formed an approximately 2-month-long ascending triangle chart pattern as a bullish continuation after an uptrend.
The horizontal boundary at 168.14 levels acts as a resistance within this pattern.
A daily close above 173.18 levels would validate the breakout from the 2-month-long ascending triangle chart pattern.
Based on this chart pattern, the potential price target is 208 levels.
Atkore Inc.-(ATKR/NYSE)-Long Idea
Atkore Inc. engages in the manufacture and sale of electrical, mechanical, safety, and infrastructure products and solutions in the United States and internationally.
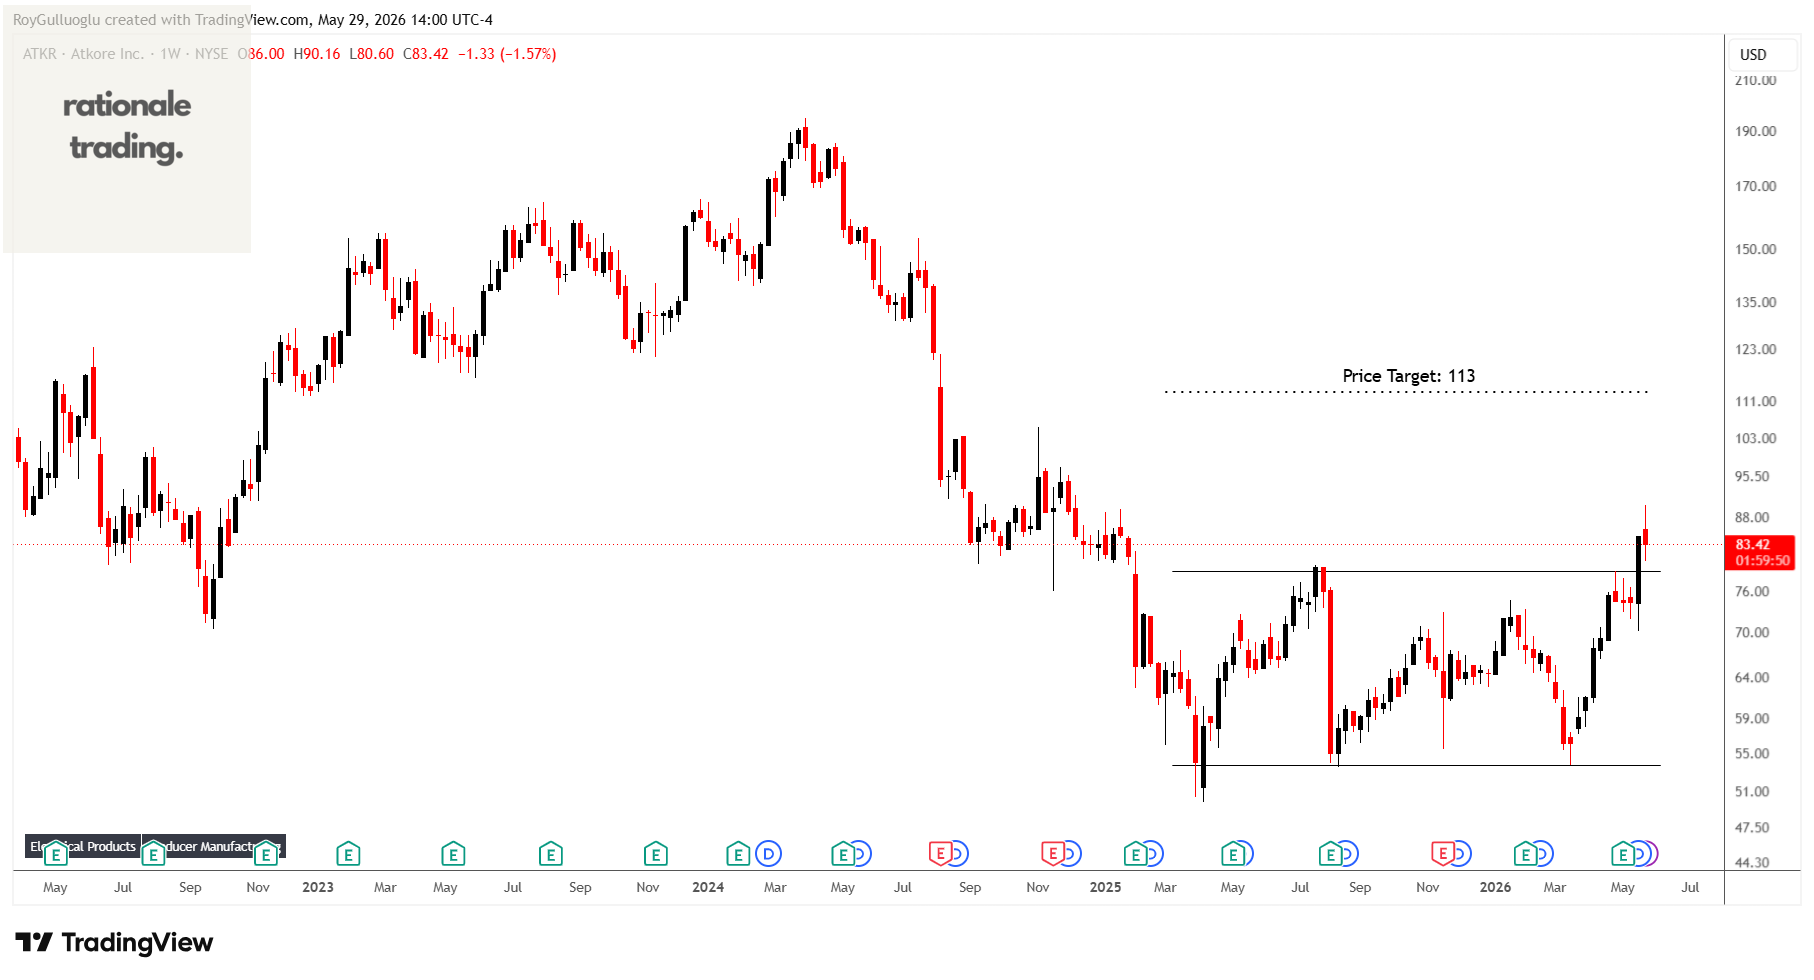
The above weekly chart formed an approximately 15-month-long rectangle chart pattern as a bullish reversal after a downtrend.
The horizontal boundary at 79 levels acts as a resistance within this pattern.
A daily close above 81.37 levels would validate the breakout from the 15-month-long rectangle chart pattern.
Based on this chart pattern, the potential price target is 113 levels.
Novavax, Inc.-(NVAX/NASDAQ)-Long Idea
Novavax, Inc., a biotechnology company, engages in the discovery, development, and commercialization of vaccines to prevent serious infectious diseases in the United States, Europe, and internationally.
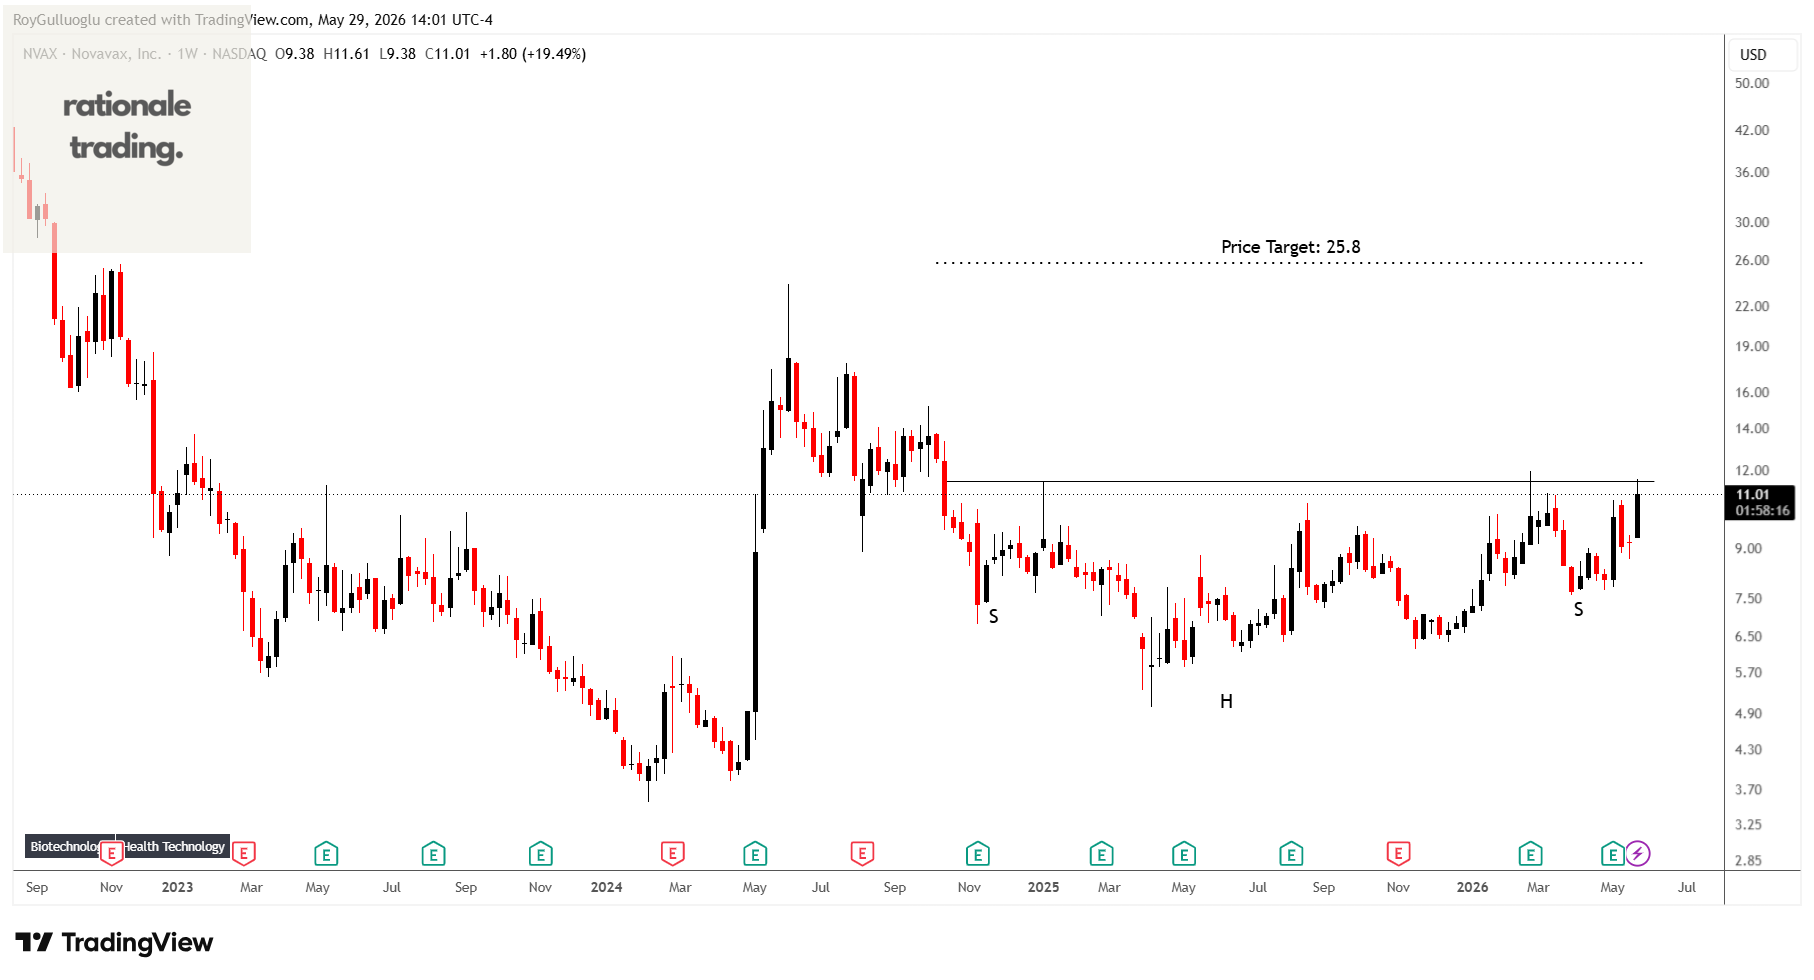
The above weekly chart formed an approximately 21-month-long H&S bottom chart pattern as a bullish reversal after a downtrend.
The horizontal boundary at 11.55 levels acts as a resistance within this pattern.
A daily close above 11.9 levels would validate the breakout from the 21-month-long H&S bottom chart pattern.
Based on this chart pattern, the potential price target is 25.8 levels.
Credo Technology Group Holding Ltd-(CRDO/NASDAQ)-Long Idea
Credo Technology Group Holding Ltd provides various high-speed connectivity solutions for optical and electrical Ethernet, and PCIe applications in the United States, Taiwan, Mainland China, Hong Kong, and internationally.
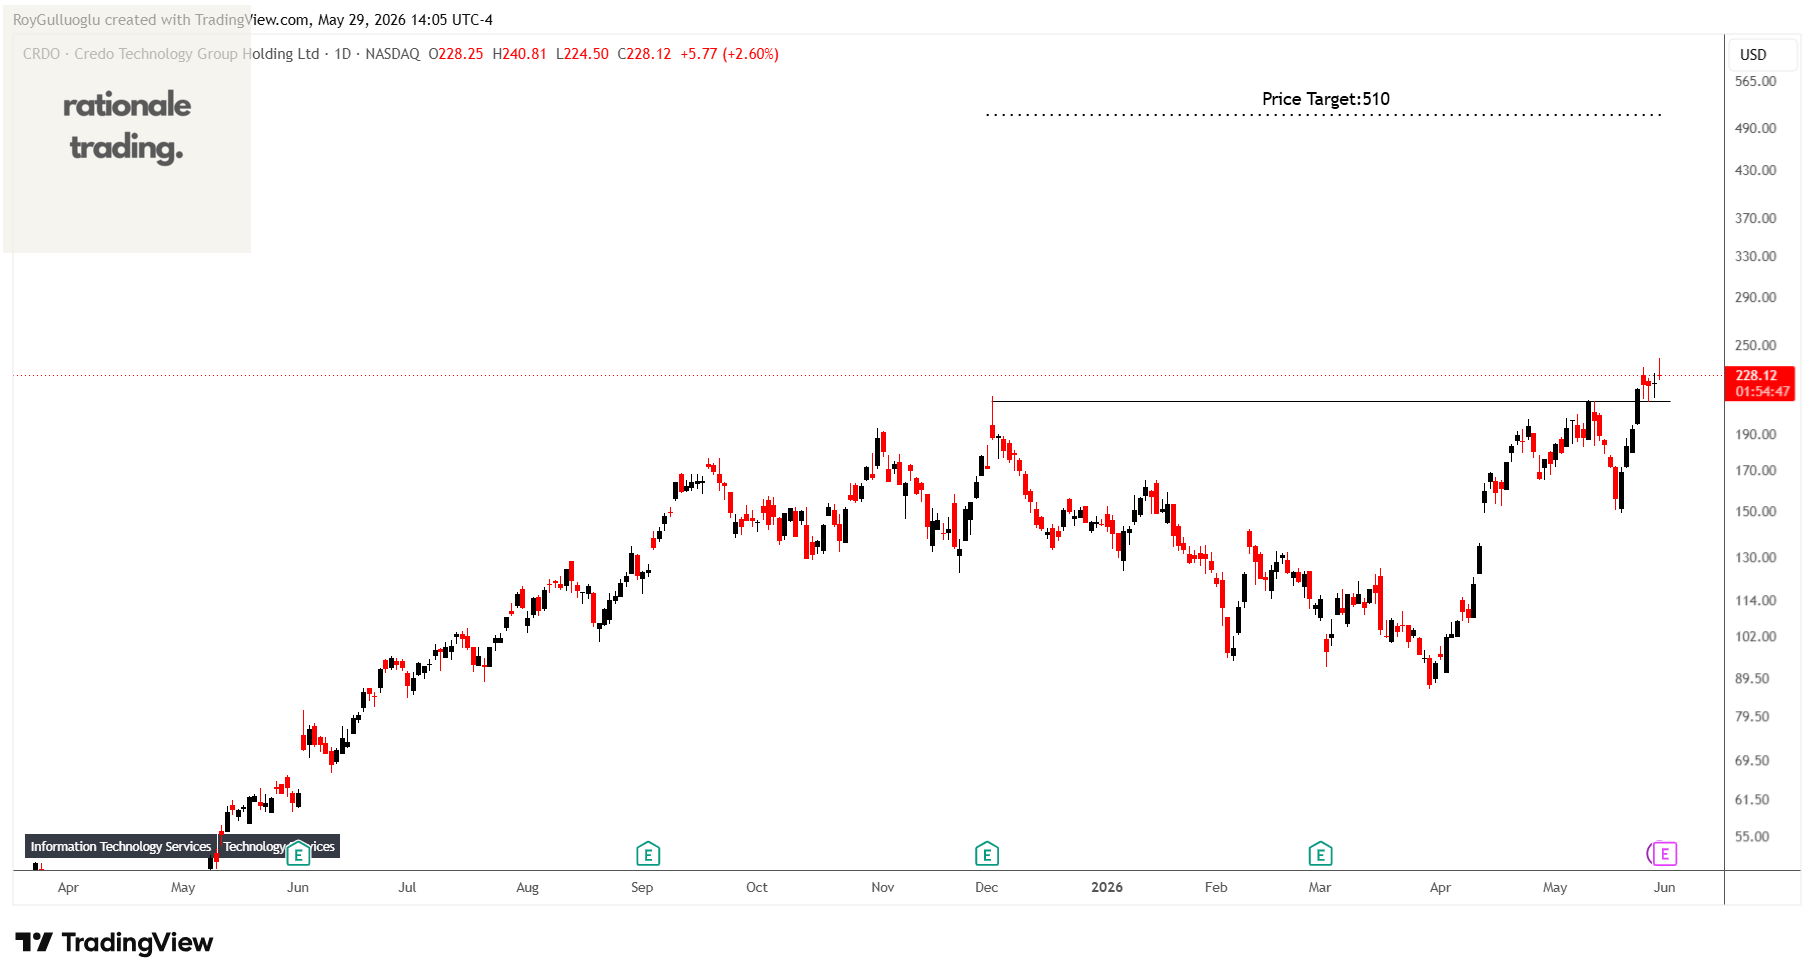
The above daily chart formed an approximately 4-month-long Cup & Handle chart pattern as a bullish continuation after an uptrend.
The horizontal boundary at 210.3 levels acts as a resistance within this pattern.
A daily close above 216.6 levels would validate the breakout from the 4-month-long Cup & Handle chart pattern.
Based on this chart pattern, the potential price target is 510 levels.
T&D Holdings, Inc.-(8795/TSE)-Long Idea
T&D Holdings, Inc., through its subsidiaries, provides insurance products and services in Japan.
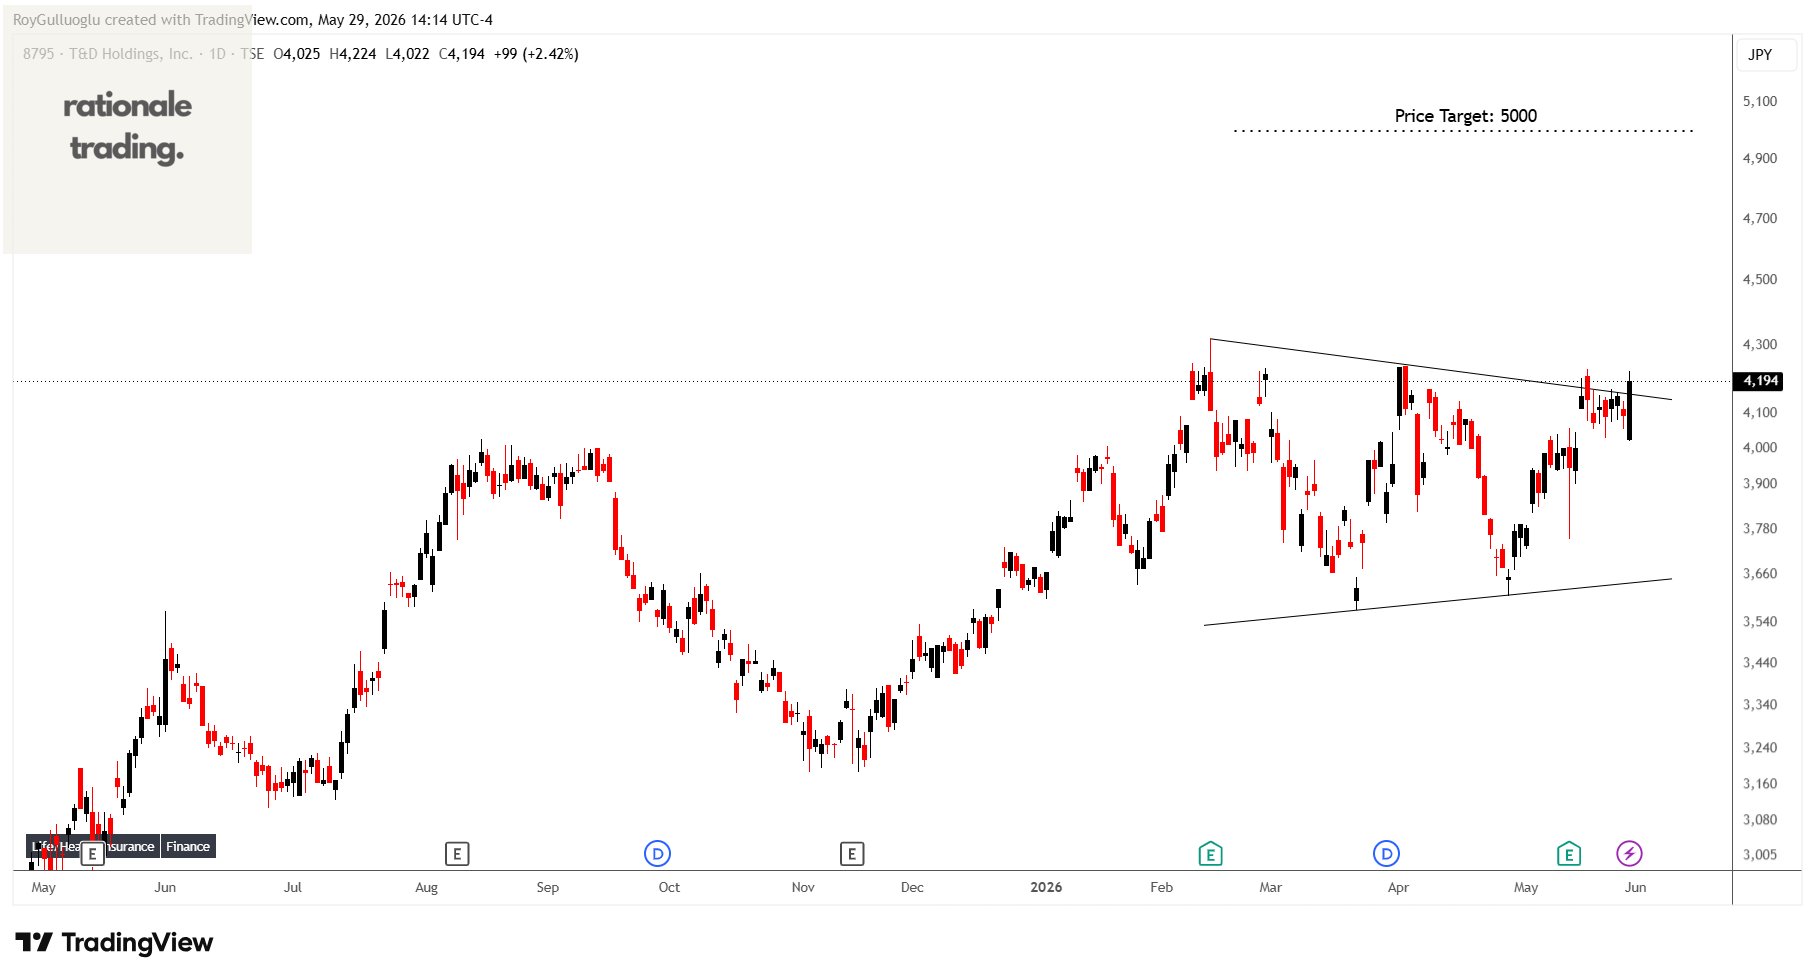
The above daily chart formed an approximately 3-month-long symmetrical triangle chart pattern as a bullish continuation after an uptrend.
A daily close above 4350 levels would validate the breakout from the 3-month-long symmetrical triangle chart pattern.
Based on this chart pattern, the potential price target is 5000 levels.