


Extreme Networks, Inc.-(EXTR/NASDAQ)-Long Idea
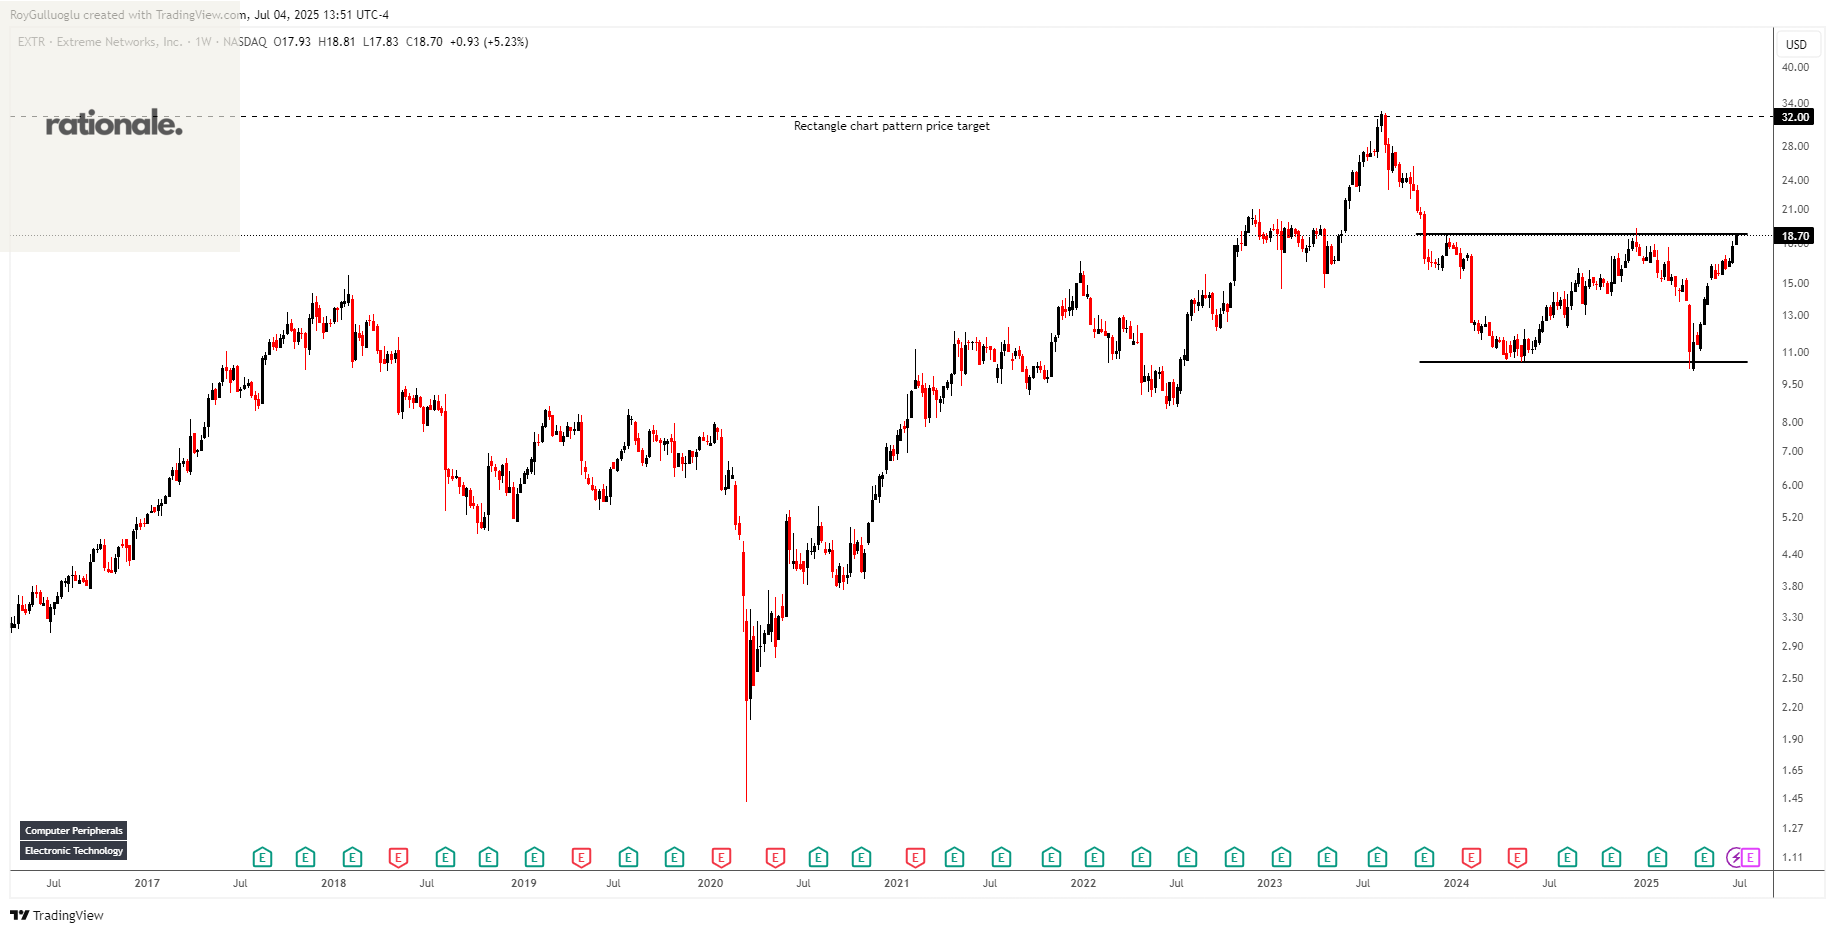
Extreme Networks, Inc. provides software-driven networking solutions worldwide. It designs, develops, and manufactures wired, wireless, and software-defined wide area-network infrastructure equipment.
The above weekly chart formed an approximately 20-month-long rectangle chart pattern as a bullish reversal after a downtrend.
The horizontal boundary at 18.75 levels acts as a resistance within this pattern.
A daily close above 19.31 levels would validate the breakout from the 20-month-long rectangle chart pattern.
Based on this chart pattern, the potential price target is 32 levels.
EXTR, classified under the "technology" sector, falls under the “Mid Cap - Growth” stock category.
Clear Secure, Inc.-(YOU/NYSE)-Long Idea
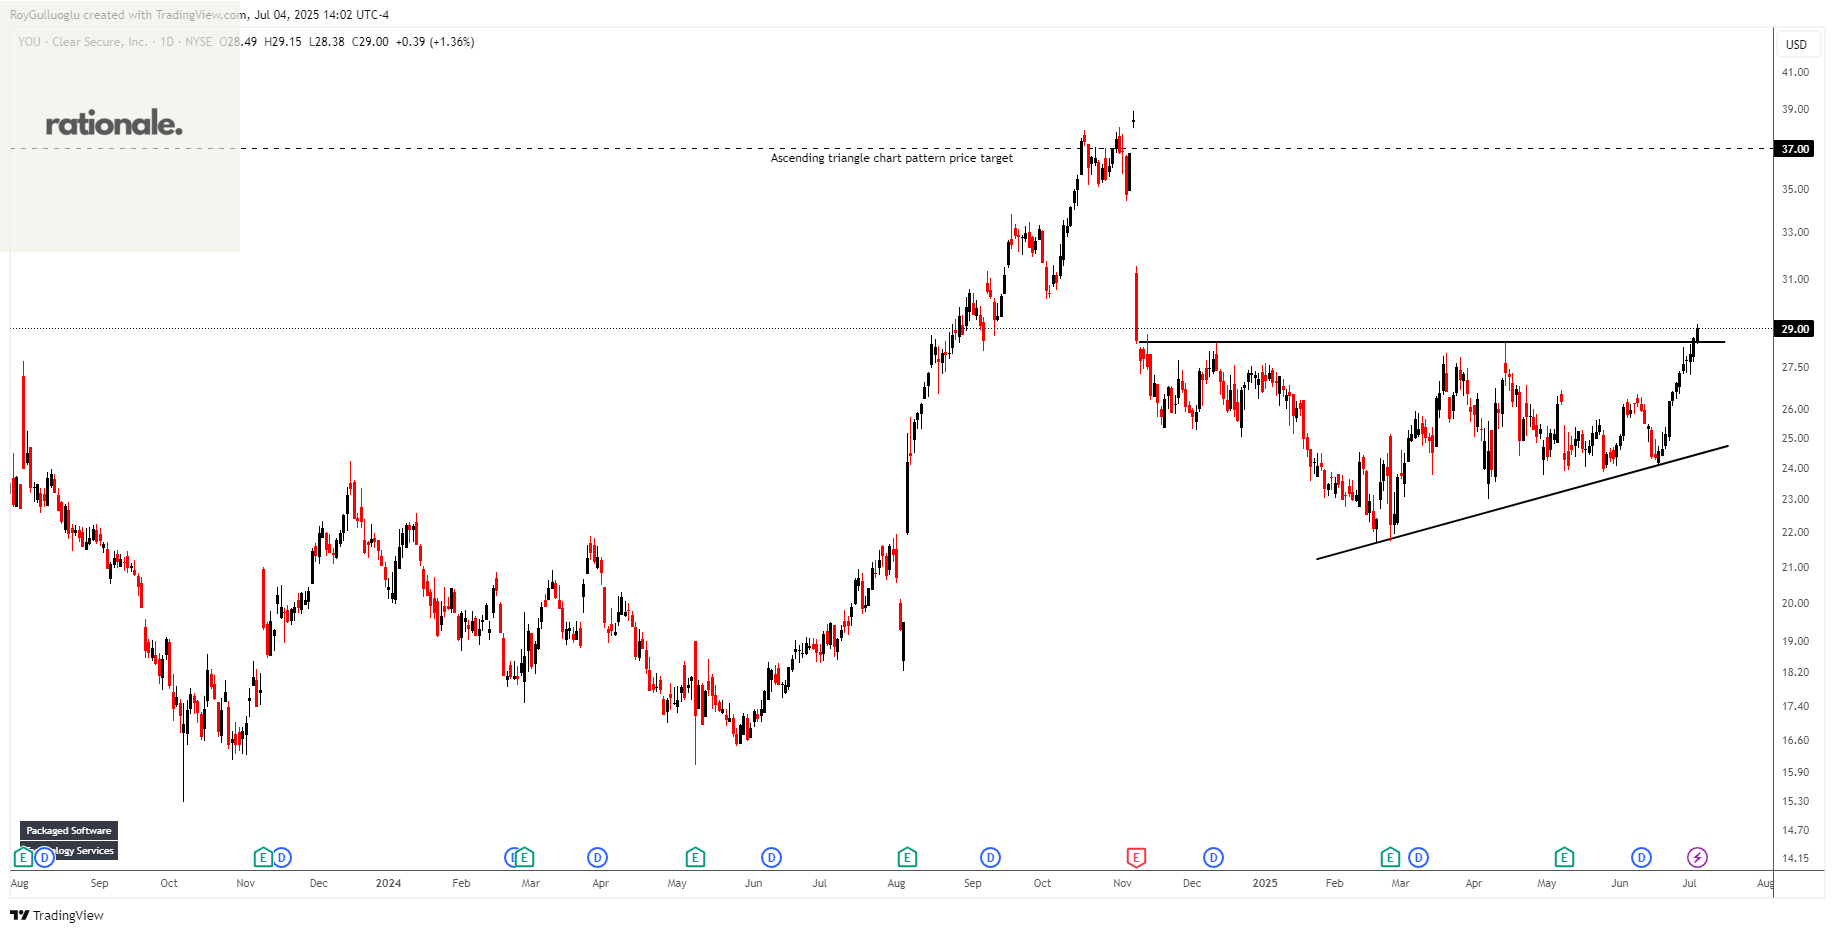
Clear Secure, Inc. operates a secure identity platform under the CLEAR brand name primarily in the United States.
The above weekly chart formed an approximately 5-month-long ascending triangle chart pattern as a bullish reversal after a downtrend.
The horizontal boundary at 28.45 levels acts as a resistance within this pattern.
A daily close above 29.3 levels would validate the breakout from the 5-month-long ascending triangle chart pattern.
Based on this chart pattern, the potential price target is 37 levels.
YOU, classified under the "technology" sector, falls under the “Mid Cap - Growth” stock category.
Expedia Group, Inc.-(EXPE/NASDAQ)-Long Idea
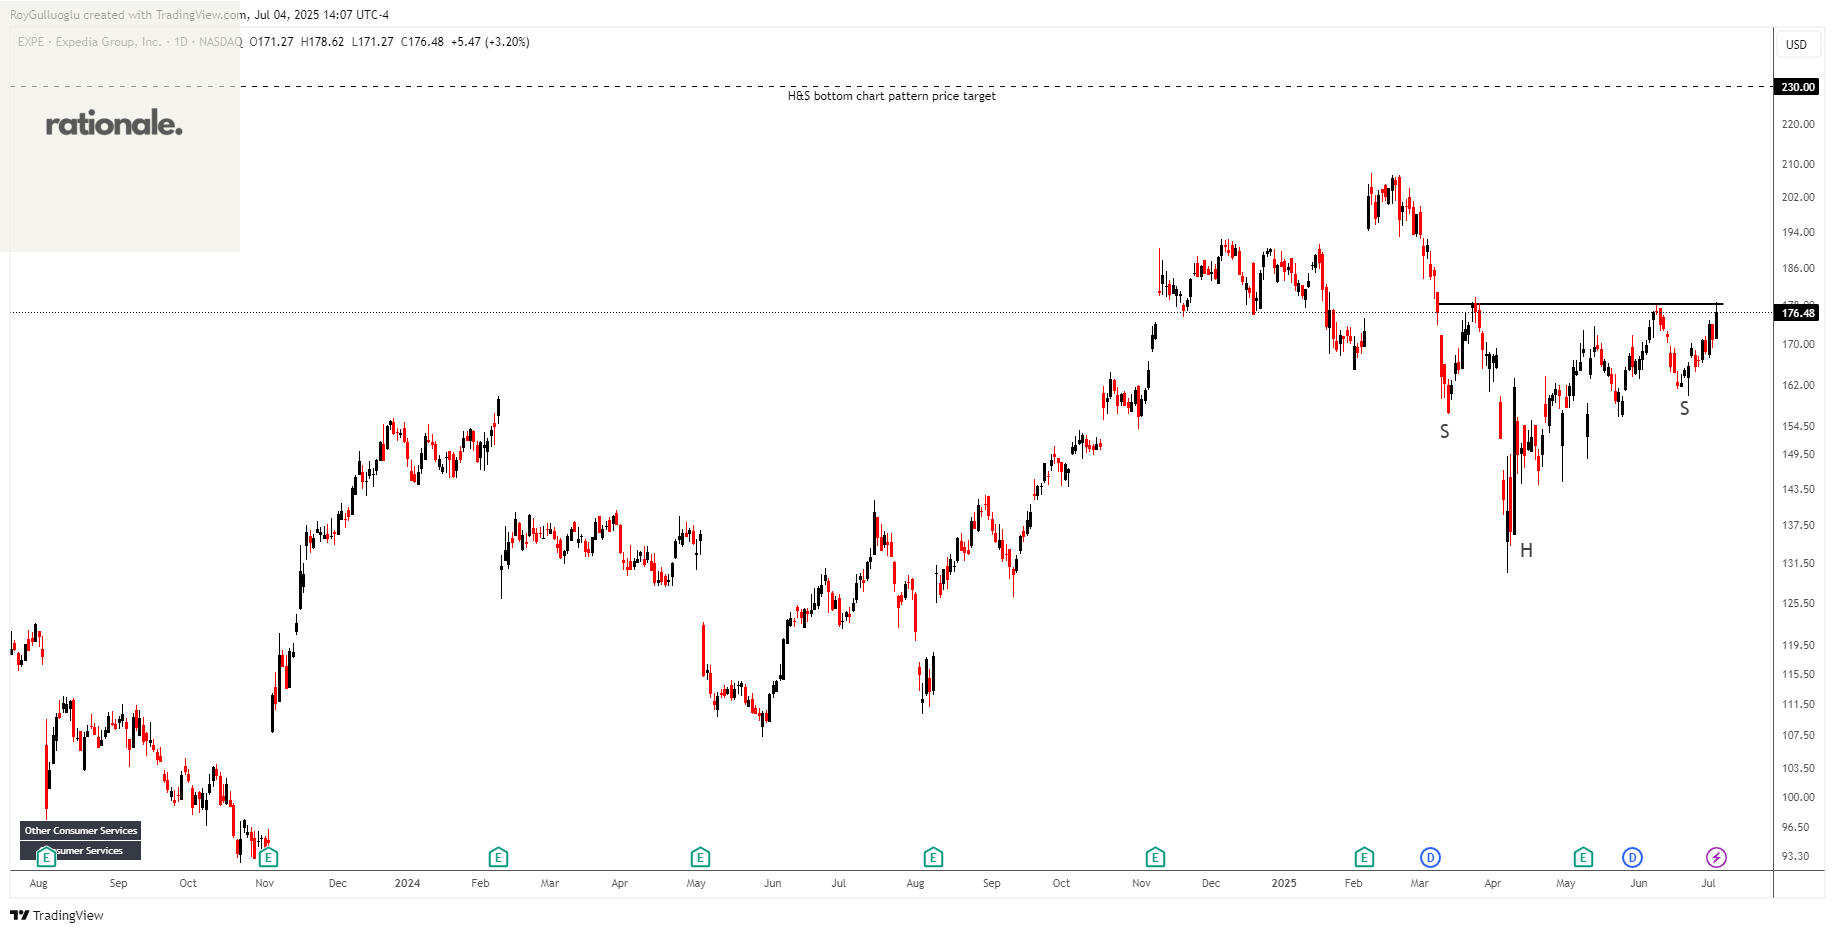
Expedia Group, Inc. operates as an online travel company in the United States and internationally.
The above daily chart formed an approximately 3-month-long H&S bottom chart pattern as a bullish reversal after a downtrend.
The horizontal boundary at 178.27 levels acts as a resistance within this pattern.
A daily close above 183.61 levels would validate the breakout from the 3-month-long H&S bottom chart pattern.
Based on this chart pattern, the potential price target is 230 levels.
EXPE, classified under the "consumer cyclicals" sector, falls under the “Large Cap - Growth” stock category.
The Chefs' Warehouse, Inc.-(CHEF/NASDAQ)-Long Idea
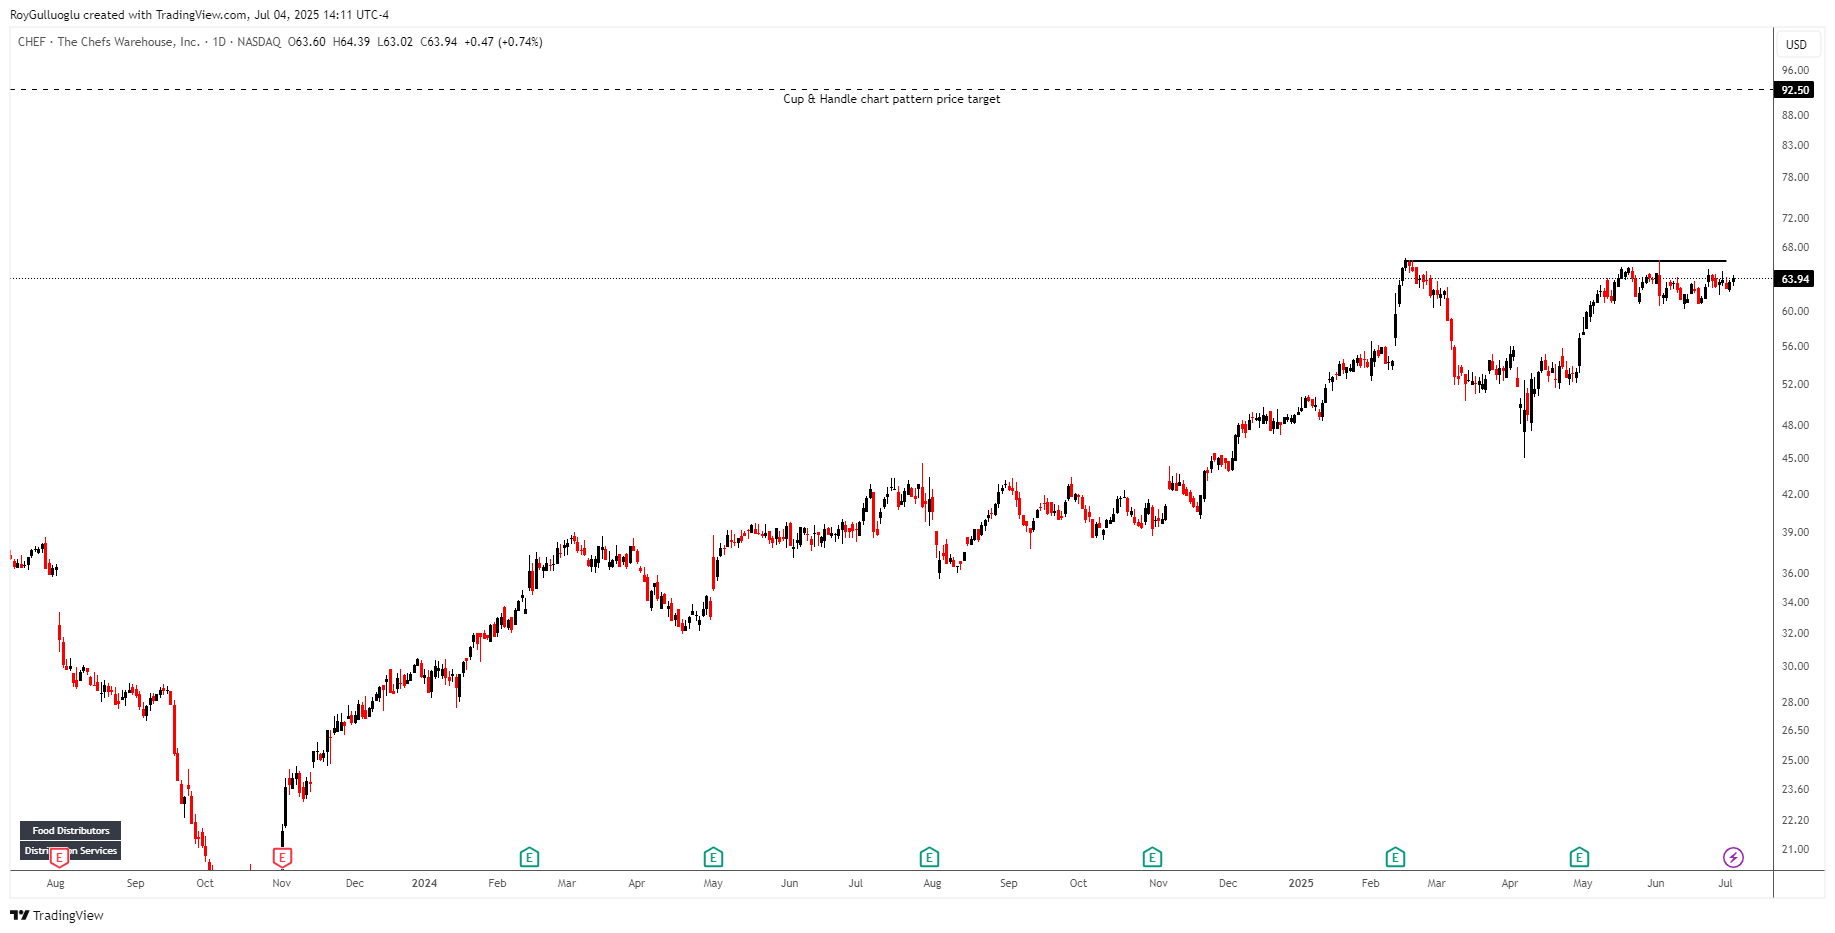
The Chefs' Warehouse, Inc., together with its subsidiaries, distributes specialty food and center-of-the-plate products in the United States, the Middle East, and Canada.
The above daily chart formed an approximately 3-month-long Cup & Handle chart pattern as a bullish continuation after an uptrend.
The horizontal boundary at 66.16 levels acts as a resistance within this pattern.
A daily close above 68.14 levels would validate the breakout from the 3-month-long Cup & Handle chart pattern.
Based on this chart pattern, the potential price target is 92.5 levels.
CHEF, classified under the "consumer defensive" sector, falls under the “Mid Cap - Value” stock category.
Turkcell Iletisim Hizmetleri A.S.-(TCELL/BIST)-Long Idea
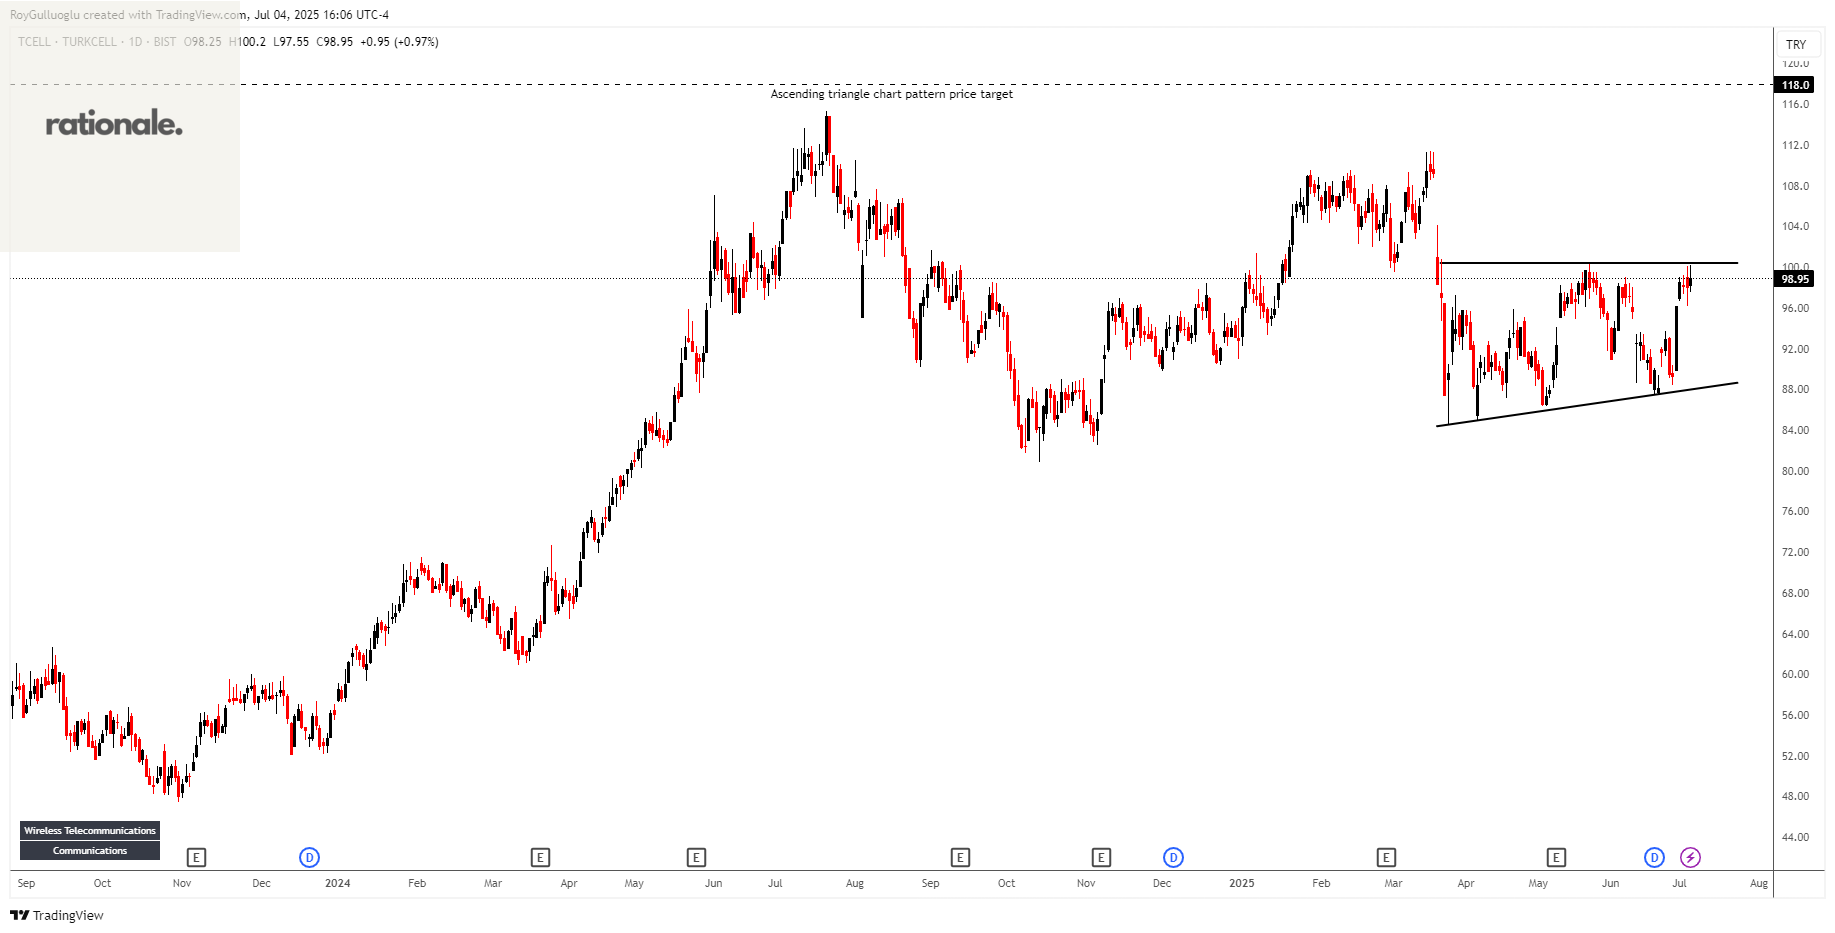
Turkcell Iletisim Hizmetleri A.S., together with its subsidiaries, provides converged telecommunication and technology services in Turkey, Belarus, Turkish Republic of Northern Cyprus, and the Netherlands.
The above daily chart formed an approximately 3-month-long ascending triangle chart pattern as a bullish reversal after a downtrend.
The horizontal boundary at 100.4 levels acts as a resistance within this pattern.
A daily close above 103.4 levels would validate the breakout from the 3-month-long ascending triangle chart pattern.
Based on this chart pattern, the potential price target is 118 levels.
TCELL, classified under the "consumer defensive" sector, falls under the “Mid Cap - Value” stock category.