

Trade Ideas Equities
SHLS(NASDAQ), VWS(OMXCOP), RBA(TSX), NOC(NYSE), GARAN(BIST), SAYAS(BIST)

Shoals Technologies Group, Inc.-(SHLS/NASDAQ)-Long Idea
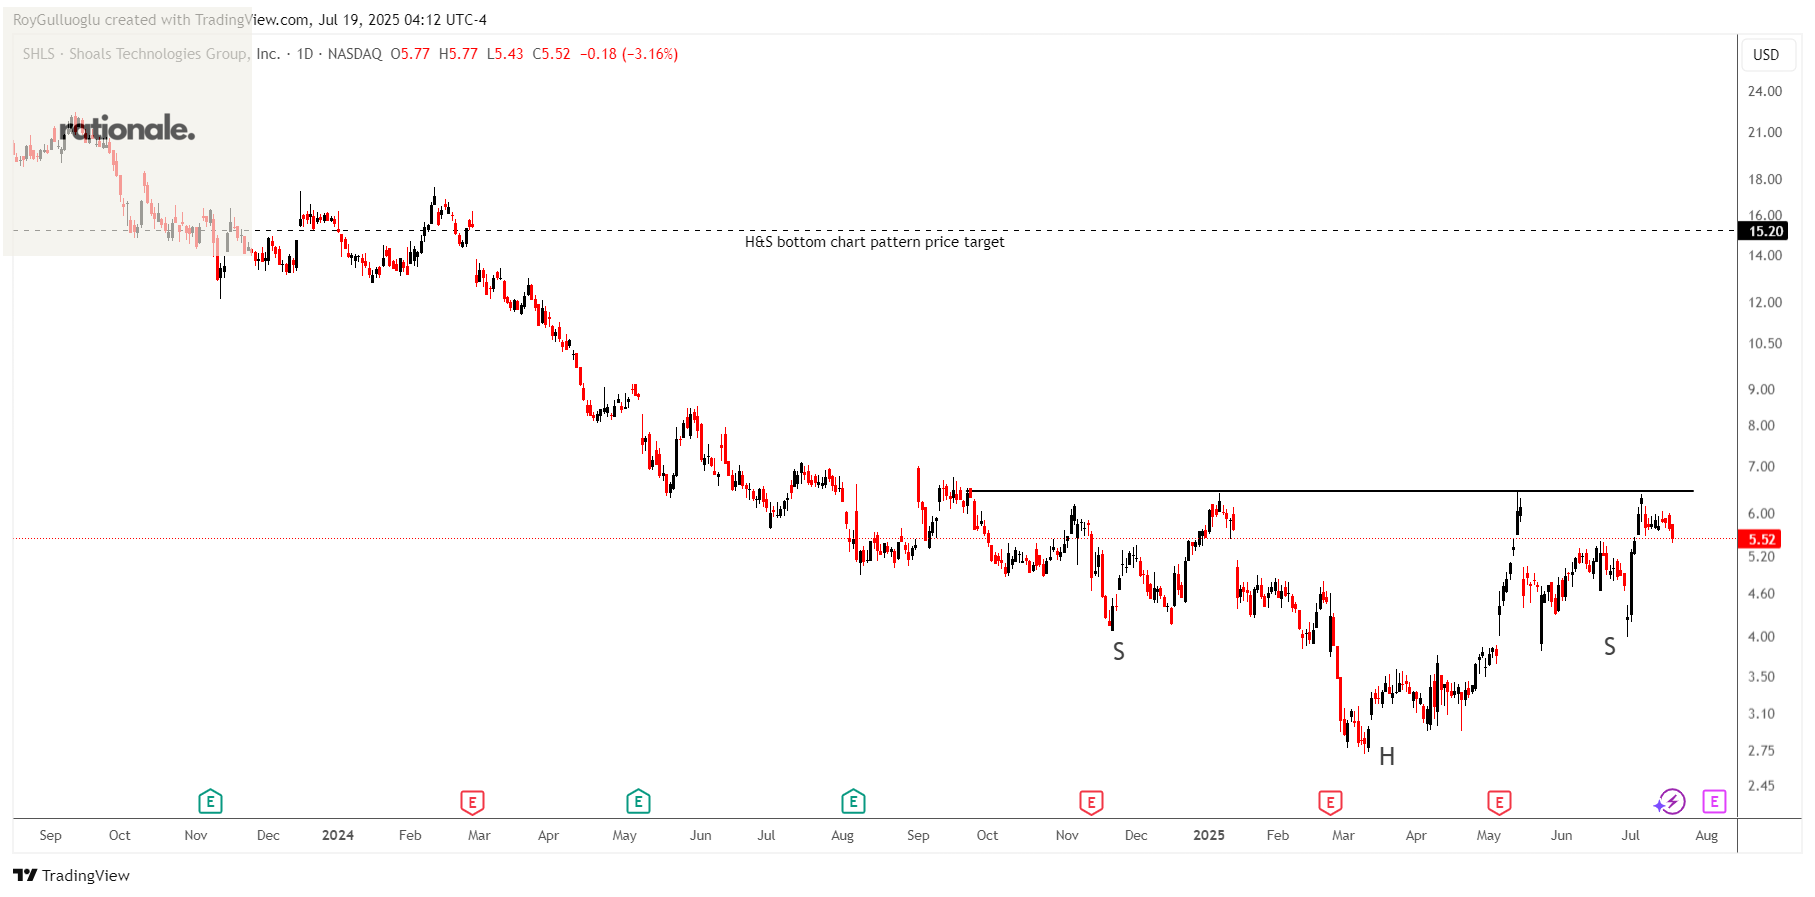
Shoals Technologies Group, Inc. provides electrical balance of system (EBOS) solutions and components in the United States and internationally.
The above daily chart formed an approximately 6-month-long H&S bottom chart pattern as a bullish reversal after a downtrend.
The horizontal boundary at 6.45 levels acts as a resistance within this pattern.
A daily close above 6.64 levels would validate the breakout from the 6-month-long H&S bottom chart pattern.
Based on this chart pattern, the potential price target is 15.2 levels.
SHLS, classified under the "technology" sector, falls under the “Small Cap - Growth” stock category.
Vestas Wind Systems A/S-(VWS/OMXCOP)-Long Idea
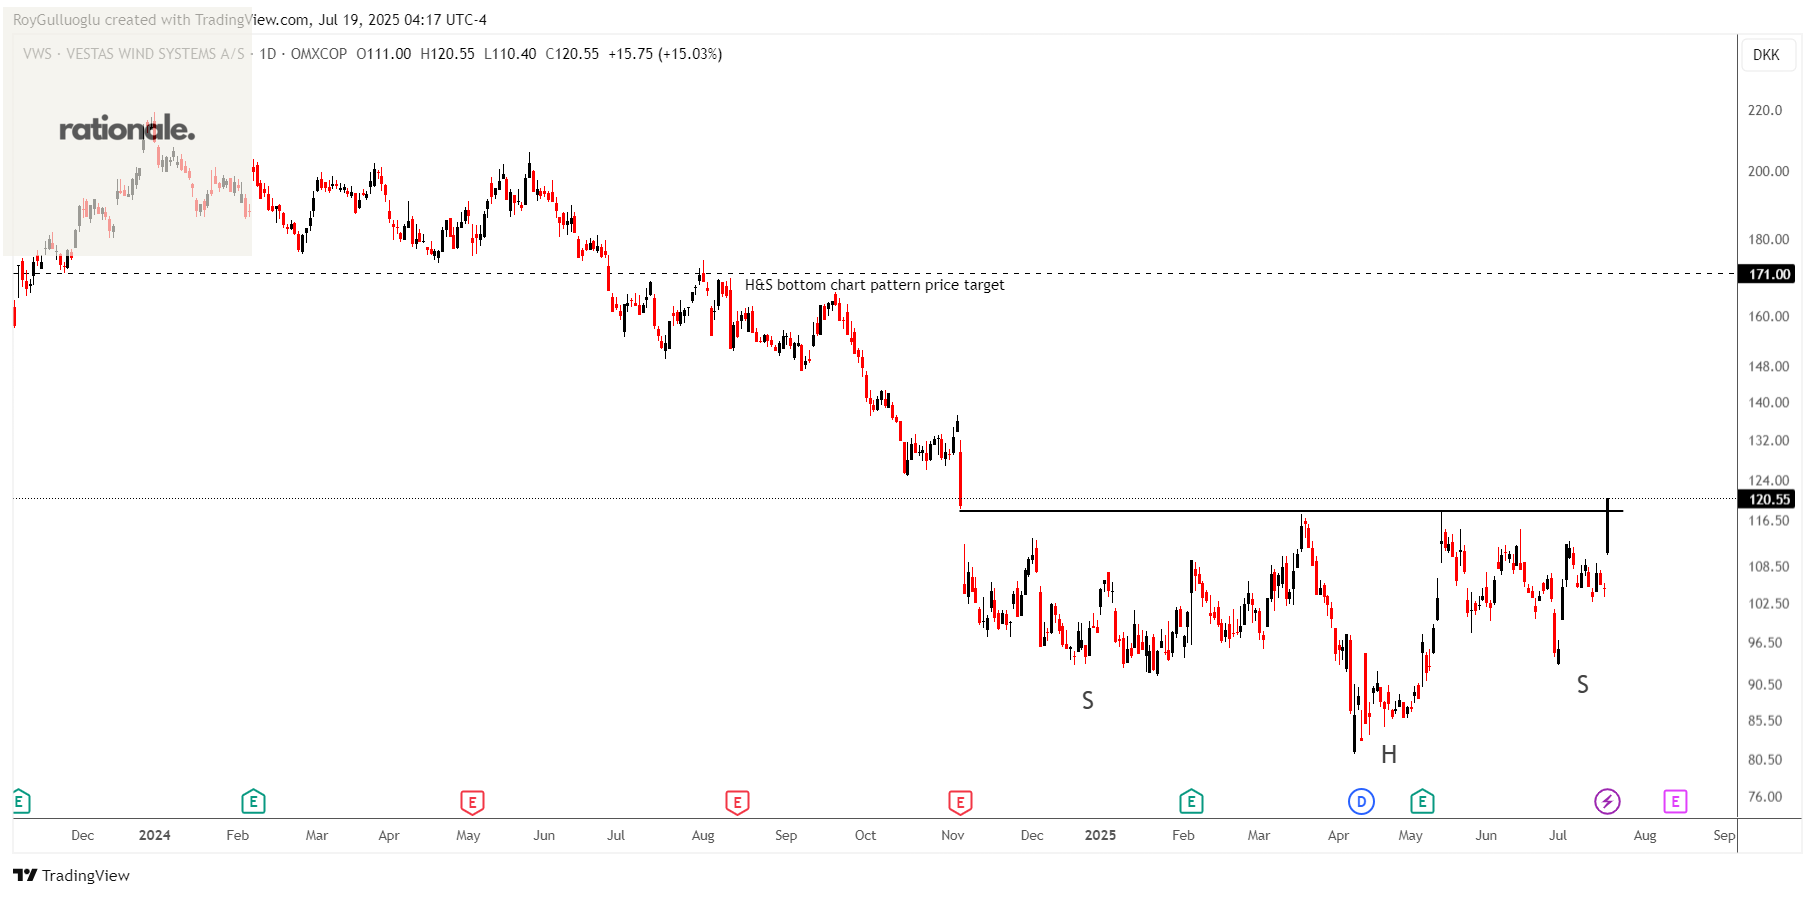
Vestas Wind Systems A/S engages in the design, manufacture, installation, and services of wind turbines the United States, Denmark, and internationally.
The above daily chart formed an approximately 6-month-long H&S bottom chart pattern as a bullish reversal after a downtrend.
The horizontal boundary at 118.25 levels acts as a resistance within this pattern.
A daily close above 121.8 levels would validate the breakout from the 6-month-long H&S bottom chart pattern.
Based on this chart pattern, the potential price target is 171 levels.
VWS, classified under the "industrials" sector, falls under the “Large Cap - Value” stock category.
RB Global, Inc.-(RBA/TSX)-Long Idea
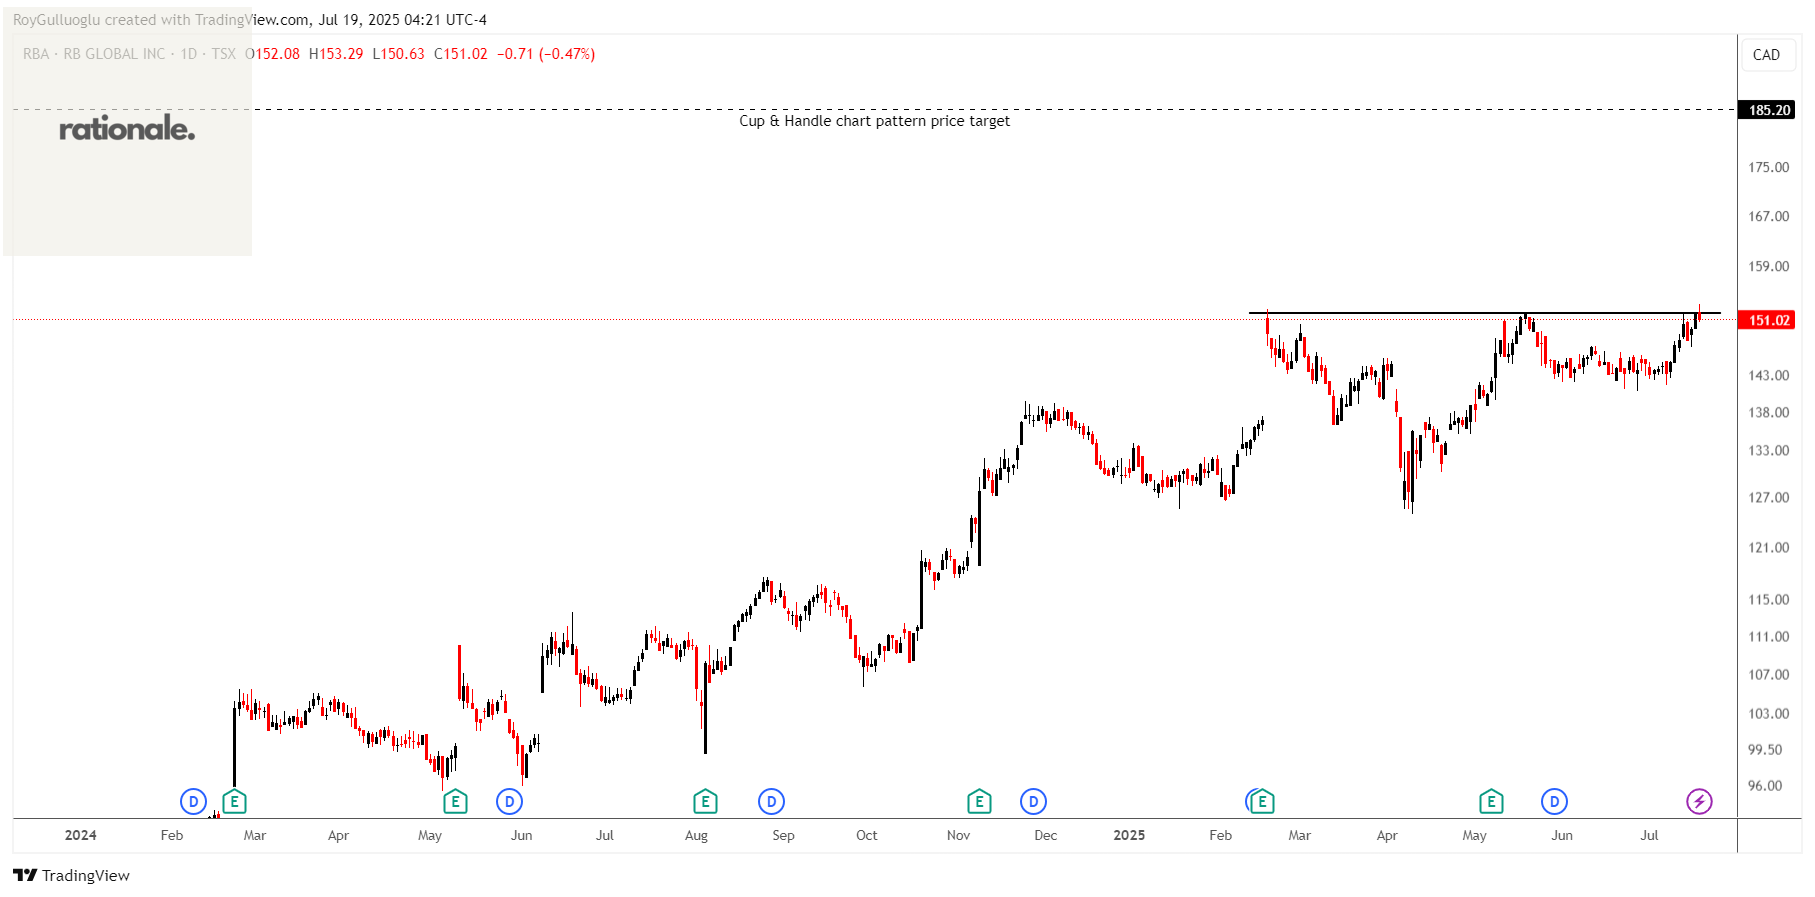
RB Global, Inc. operates a marketplace that provides insights, services, and transaction solutions for buyers and sellers of commercial assets and vehicles worldwide.
The above daily chart formed an approximately 3-month-long cup & handle chart pattern as a bullish continuation after an uptrend.
The horizontal boundary at 151.95 levels acts as a resistance within this pattern.
A daily close above 156.5 levels would validate the breakout from the 3-month-long cup & handle chart pattern.
Based on this chart pattern, the potential price target is 185.2 levels.
RBA, classified under the "industrials" sector, falls under the “Large Cap - Value” stock category.
Northrop Grumman Corporation.-(NOC/NYSE)-Long Idea
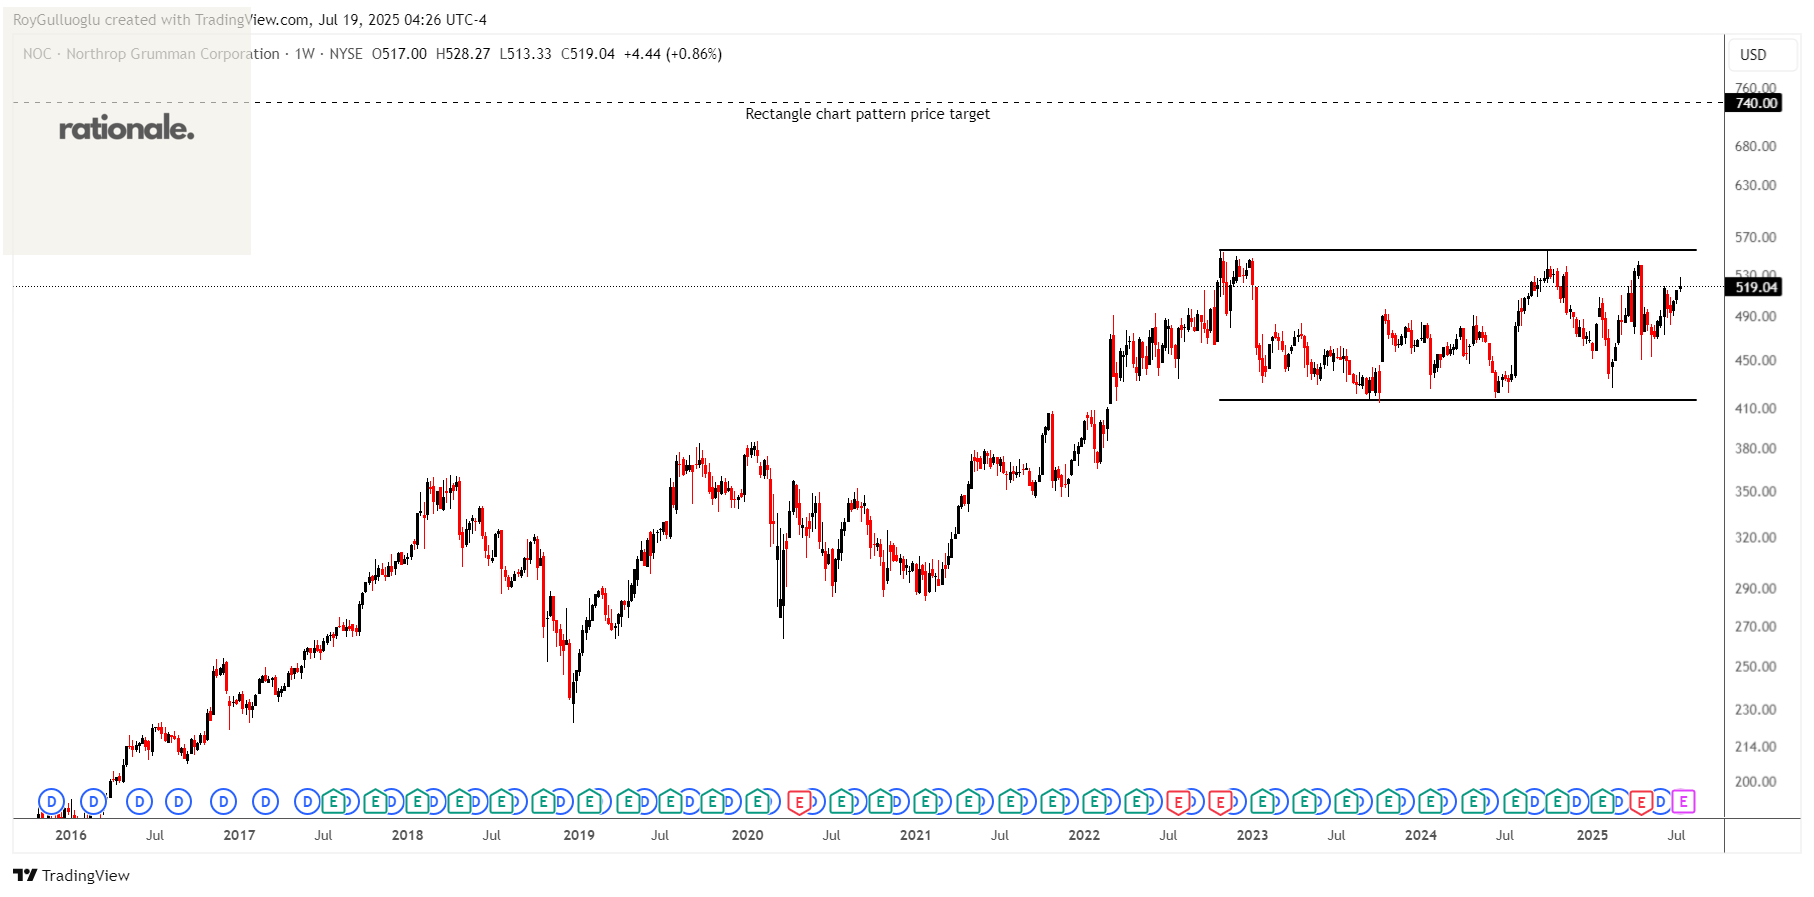
Northrop Grumman Corporation operates as an aerospace and defense technology company in the United States, the Asia/Pacific, Europe, and internationally.
The above daily chart formed an approximately 35-month-long rectangle chart pattern as a bullish continuation after an uptrend.
The horizontal boundary at 556.27 levels acts as a resistance within this pattern.
A daily close above 573 levels would validate the breakout from the 35-month-long rectangle chart pattern.
Based on this chart pattern, the potential price target is 740 levels.
NOC, classified under the "industrials" sector, falls under the “Large Cap - Value” stock category.
Turkiye Garanti Bankasi A.S.-(GARAN/BIST)-Long Idea
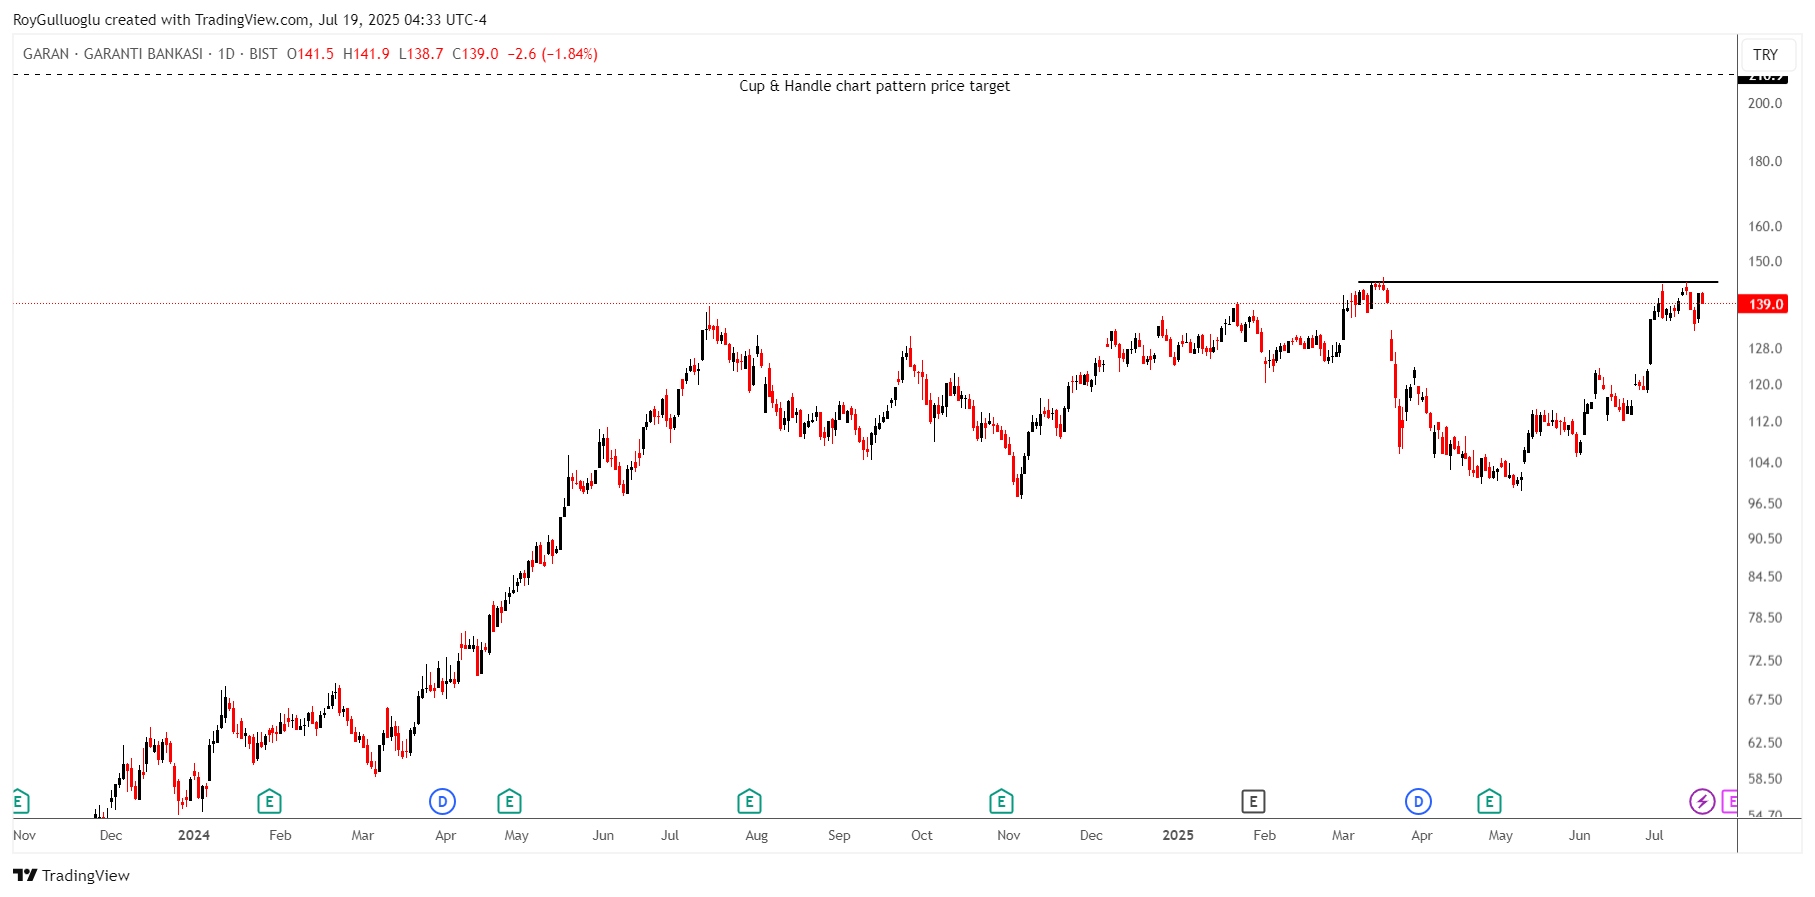
Turkiye Garanti Bankasi A.S. provides various banking products and services in Turkey.
The above daily chart formed an approximately 3-month-long cup & handle chart pattern as a bullish continuation after an uptrend.
The horizontal boundary at 144.4 levels acts as a resistance within this pattern.
A daily close above 148.73 levels would validate the breakout from the 3-month-long cup & handle chart pattern.
Based on this chart pattern, the potential price target is 210.9 levels.
Say Yenilenebilir Enerji Ekipmanlari Sanayi ve Ticaret A.S.-(SAYAS/BIST)-Long Idea

Say Yenilenebilir Enerji Ekipmanlari Sanayi ve Ticaret A.S. offers renewable energy equipment in Turkey.
The above daily chart formed an approximately 6-month-long H&S bottom chart pattern as a bullish reversal after a downtrend.
The horizontal boundary at 52.25 levels acted as a resistance within this pattern.
A daily close above 53.8 levels validated the breakout from the 6-month-long H&S bottom chart pattern .
Based on this chart pattern, the potential price target is 98 levels.
Teşekkürler Roy