

Trade Ideas Equities
SPOT(NYSE), VST(NYSE), H(TSX), CCL(TSX), GLE(EURONEXT), BAYN(XETR)

Spotify Technology S.A.-(SPOT/NYSE)-Long Idea
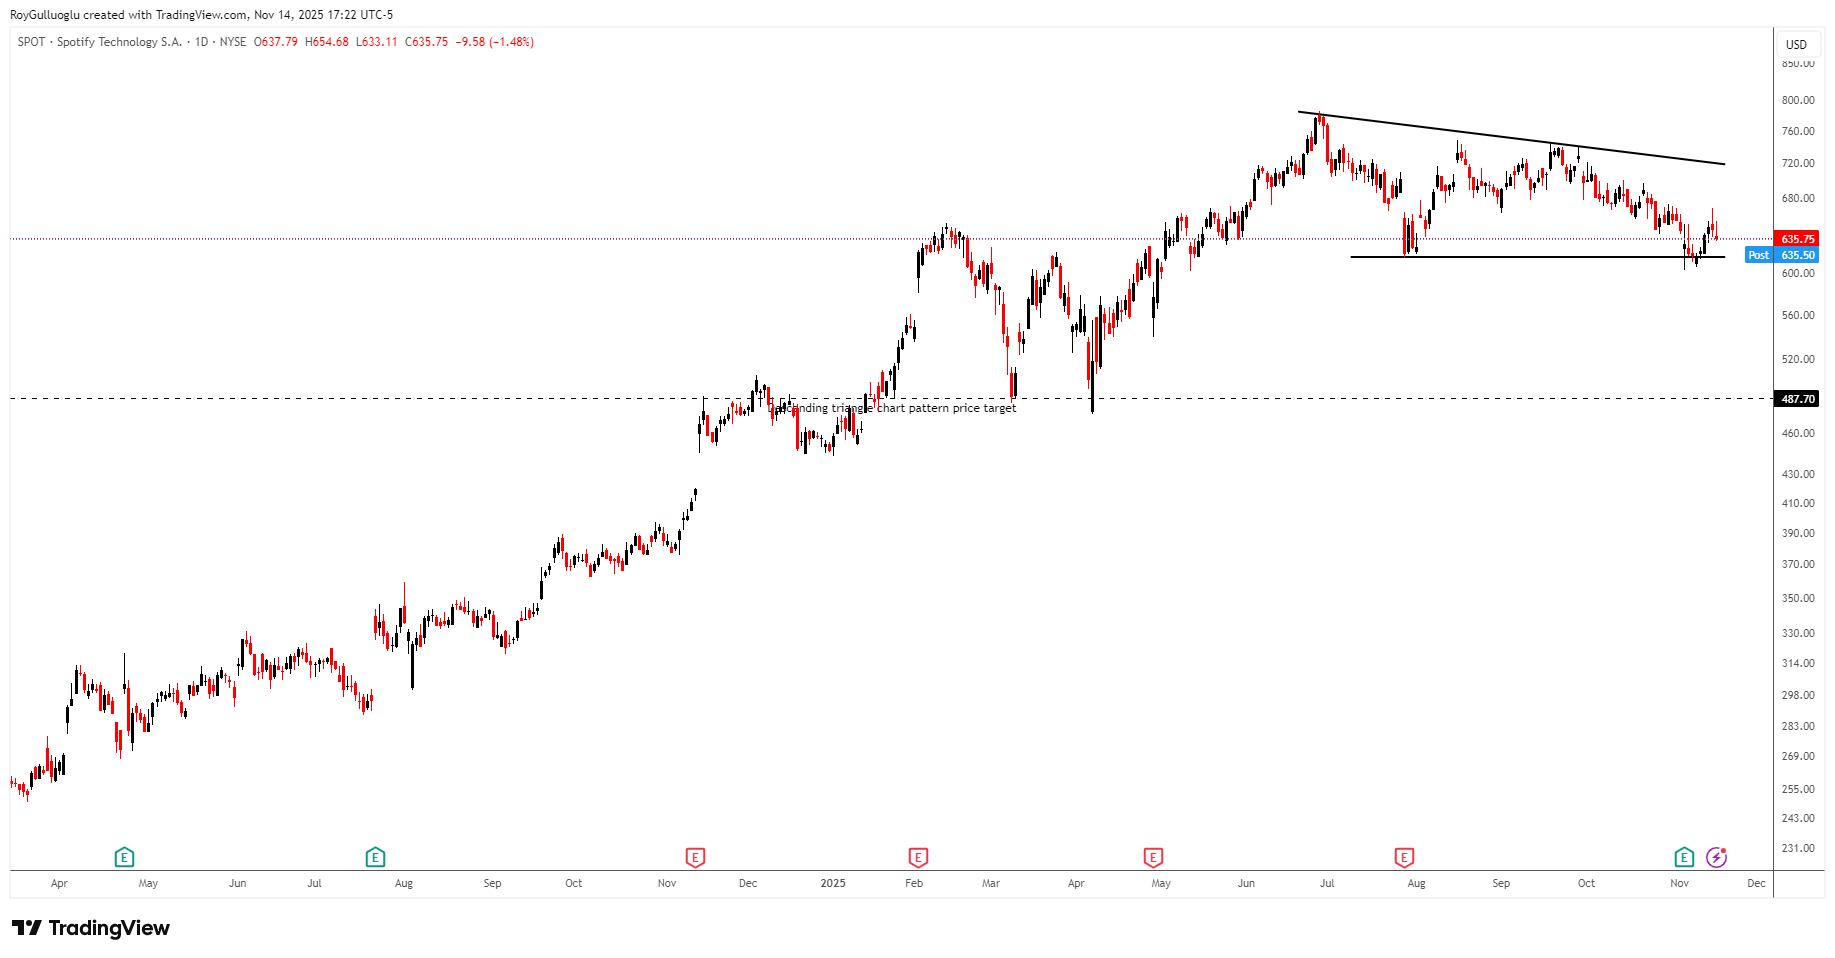
Spotify Technology S.A., together with its subsidiaries, provides audio streaming subscription services worldwide.
The above daily chart formed an approximately 3-month-long descending triangle chart pattern as a bearish reversal after an uptrend.
The horizontal boundary at 616.36 levels acts as a resistance within this pattern.
A daily close below 597.9 levels would validate the breakout from the 3-month-long descending triangle chart pattern.
Based on this chart pattern, the potential price target is 487.7 levels.
Vistra Corp.-(VST/NYSE)-Short Idea
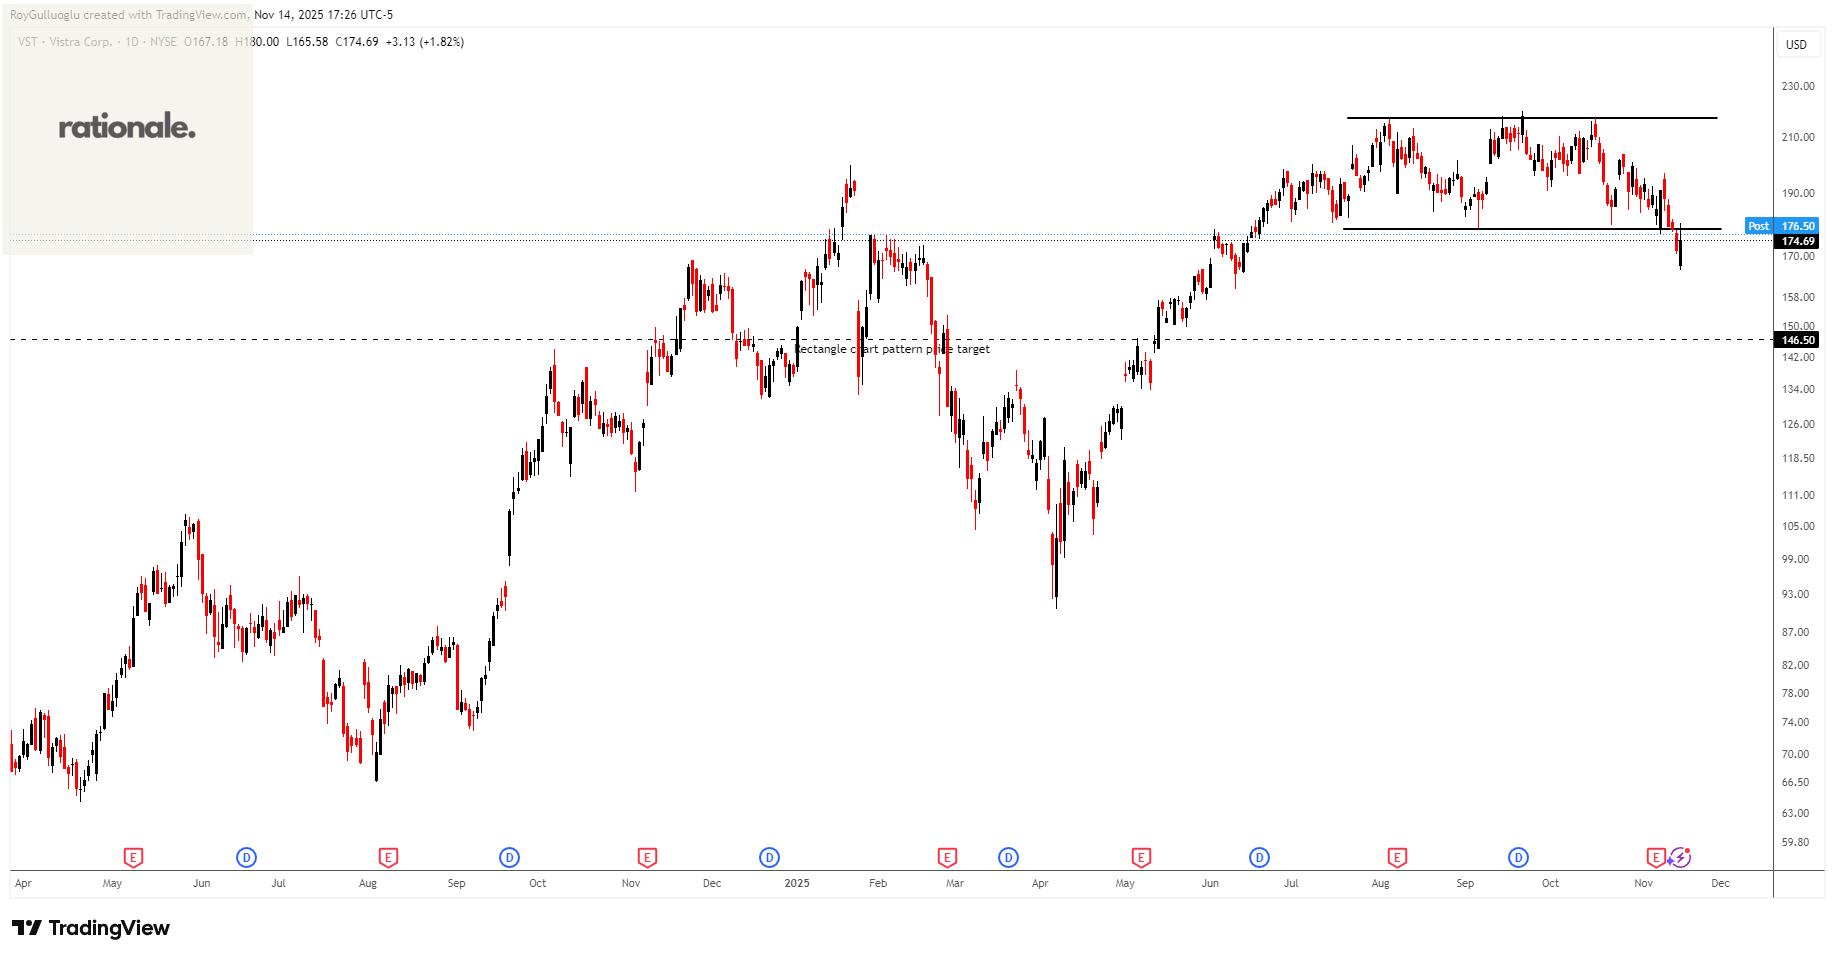
Vistra Corp., together with its subsidiaries, operates as an integrated retail electricity and power generation company in the United States.
The above daily chart formed an approximately 3-month-long rectangle chart pattern as a bearish reversal after an uptrend.
The horizontal boundary at 178.11 levels acted as a resistance within this pattern.
A daily close below 172.75 levels validated the breakout from the 3-month-long descending triangle chart pattern.
Based on this chart pattern, the potential price target is 146.5 levels.
Hydro One Limited-(H/TSX)-Long Idea
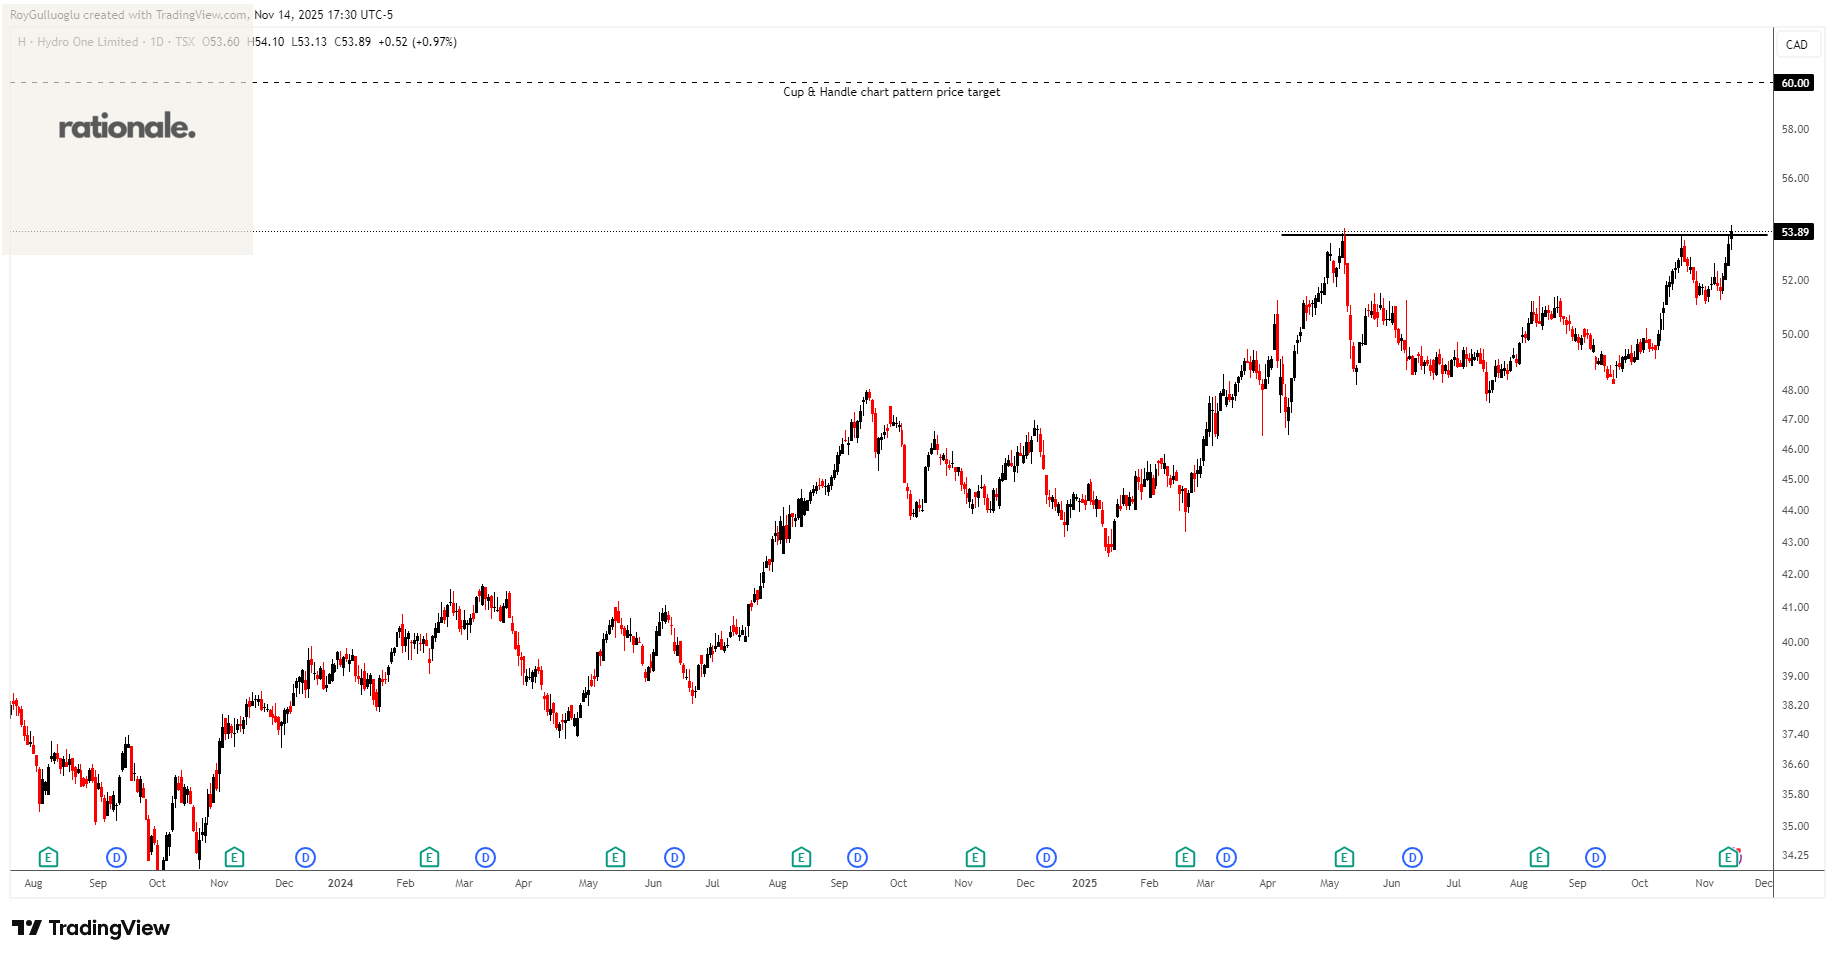
Hydro One Limited, through its subsidiaries, operates as an electricity transmission and distribution company in Ontario.
The above weekly chart formed an approximately 4-months-long Cup & Handle top chart pattern as a bearish reversal after an uptrend.
The boundary at 53.72 levels acts as a resistance within this pattern.
A daily close above 55.33 levels would validate the breakout from the 4-months-long Cup & Handle top chart pattern.
Based on this chart pattern, the potential price target is 60 levels.
CCL Industries Inc.-(CCL/TSX)-Long Idea

CCL Industries Inc. manufactures and sells labels, consumer printable media products, technology-driven label solutions, polymer banknote substrates, and specialty films.
The above weekly chart formed an approximately 4-month-long rectangle chart pattern as a bearish reversal after an uptrend.
The horizontal boundary at 84.89 levels acted as a resistance within this pattern.
A daily close above 87.43 levels validated the breakout from the 4-month-long rectangle chart pattern.
Based on this chart pattern, the potential price target is 110 levels.
Société Générale Société anonyme-(GLE/EURONEXT)-Long Idea
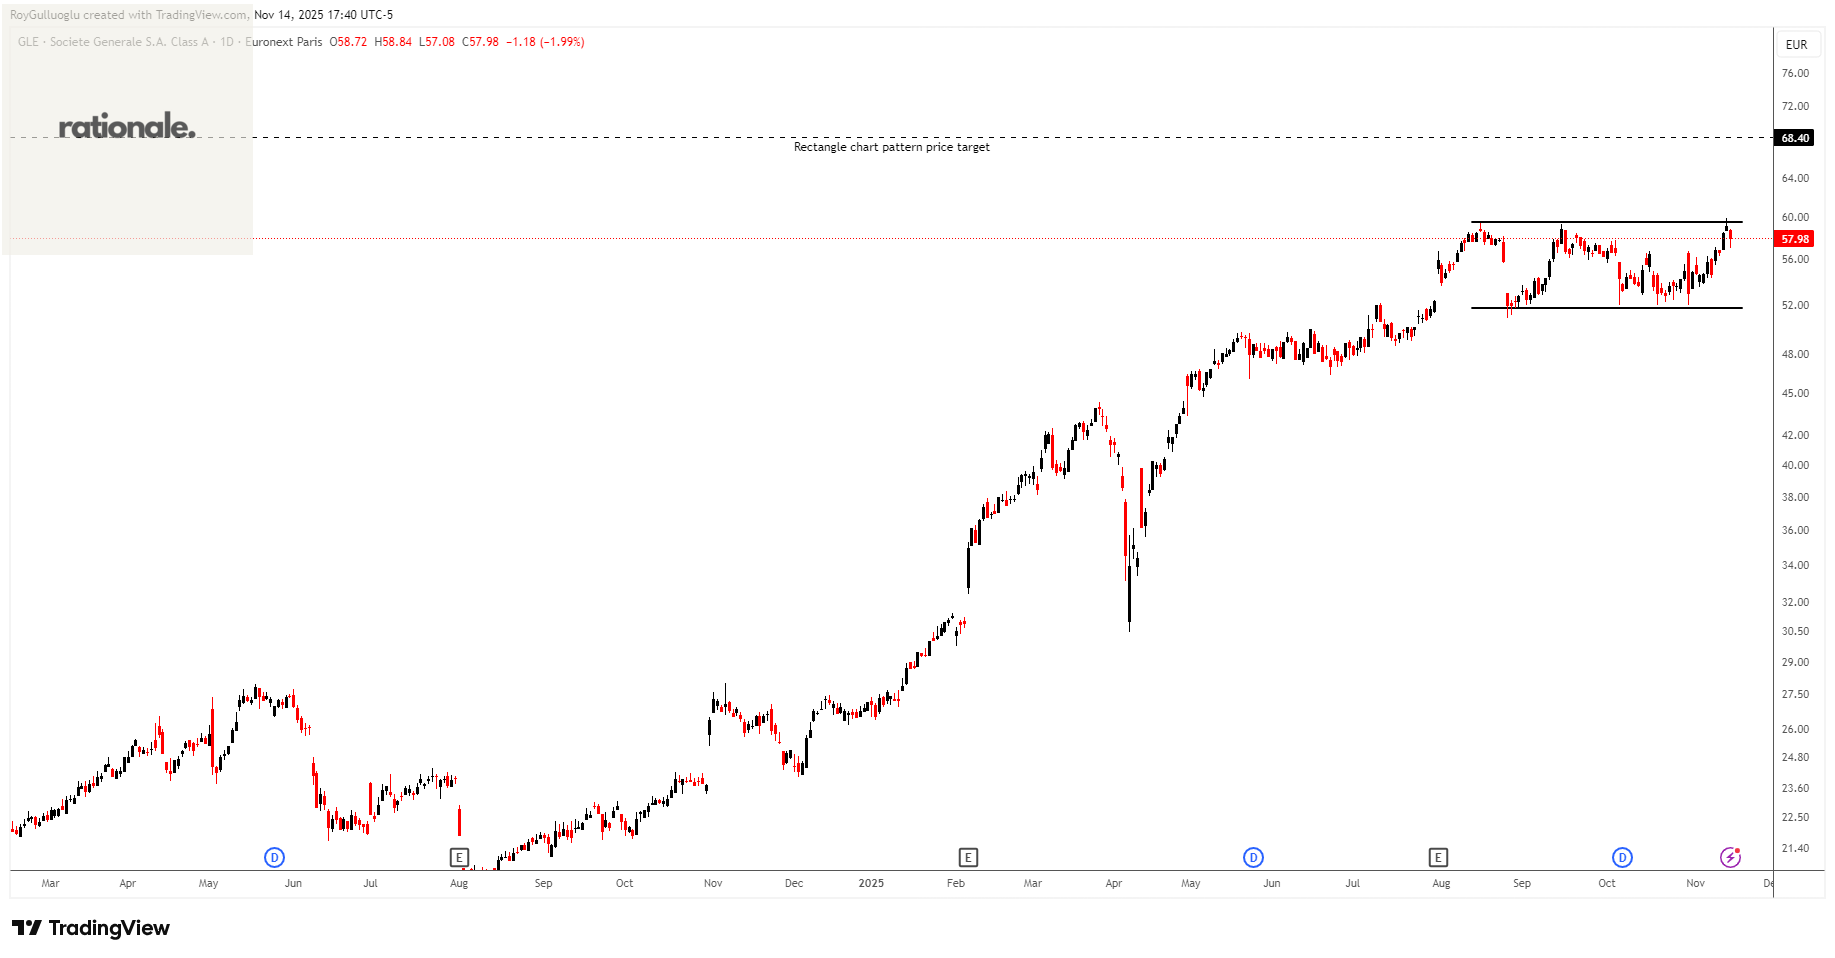
Société Générale Société anonyme provides banking and financial services to individuals, corporates, and institutional clients in Europe and internationally.
The above daily chart formed an approximately 2-month-long rectangle chart pattern as a bullish continuation after an uptrend.
The horizontal boundary at 59.54 levels acts as a resistance within this pattern.
A daily close below 61.32 levels would validate the breakout from the 2-month-long rectangle chart pattern.
Based on this chart pattern, the potential price target is 68.4 levels.
Bayer Aktiengesellschaft-(BAYN/XETR)-Long Idea

Bayer Aktiengesellschaft operates as a life science company worldwide.
The above weekly chart formed an approximately 22-month-long H&S bottom chart pattern as a bullish reversal after a downtrend.
The horizontal boundary at 29.945 levels acts as a resistance within this pattern.
A daily close below 30.85 levels would validate the breakout from the 22-month-long H&S bottom chart pattern.
Based on this chart pattern, the potential price target is 48.5 levels.
Teşekkürler Roy