


New setups
TICKERS: AKBNK(BIST), RXL(EURONEXT), AKE(EURONEXT), CBK(XETR), CPG(LSE), 4202(TSE), OLL(NYSE), LEA(NYSE), LNC(NYSE), PG(NYSE), BX(NYSE)
Akbank T.A.S.-(AKBNK/BIST)-Long Idea
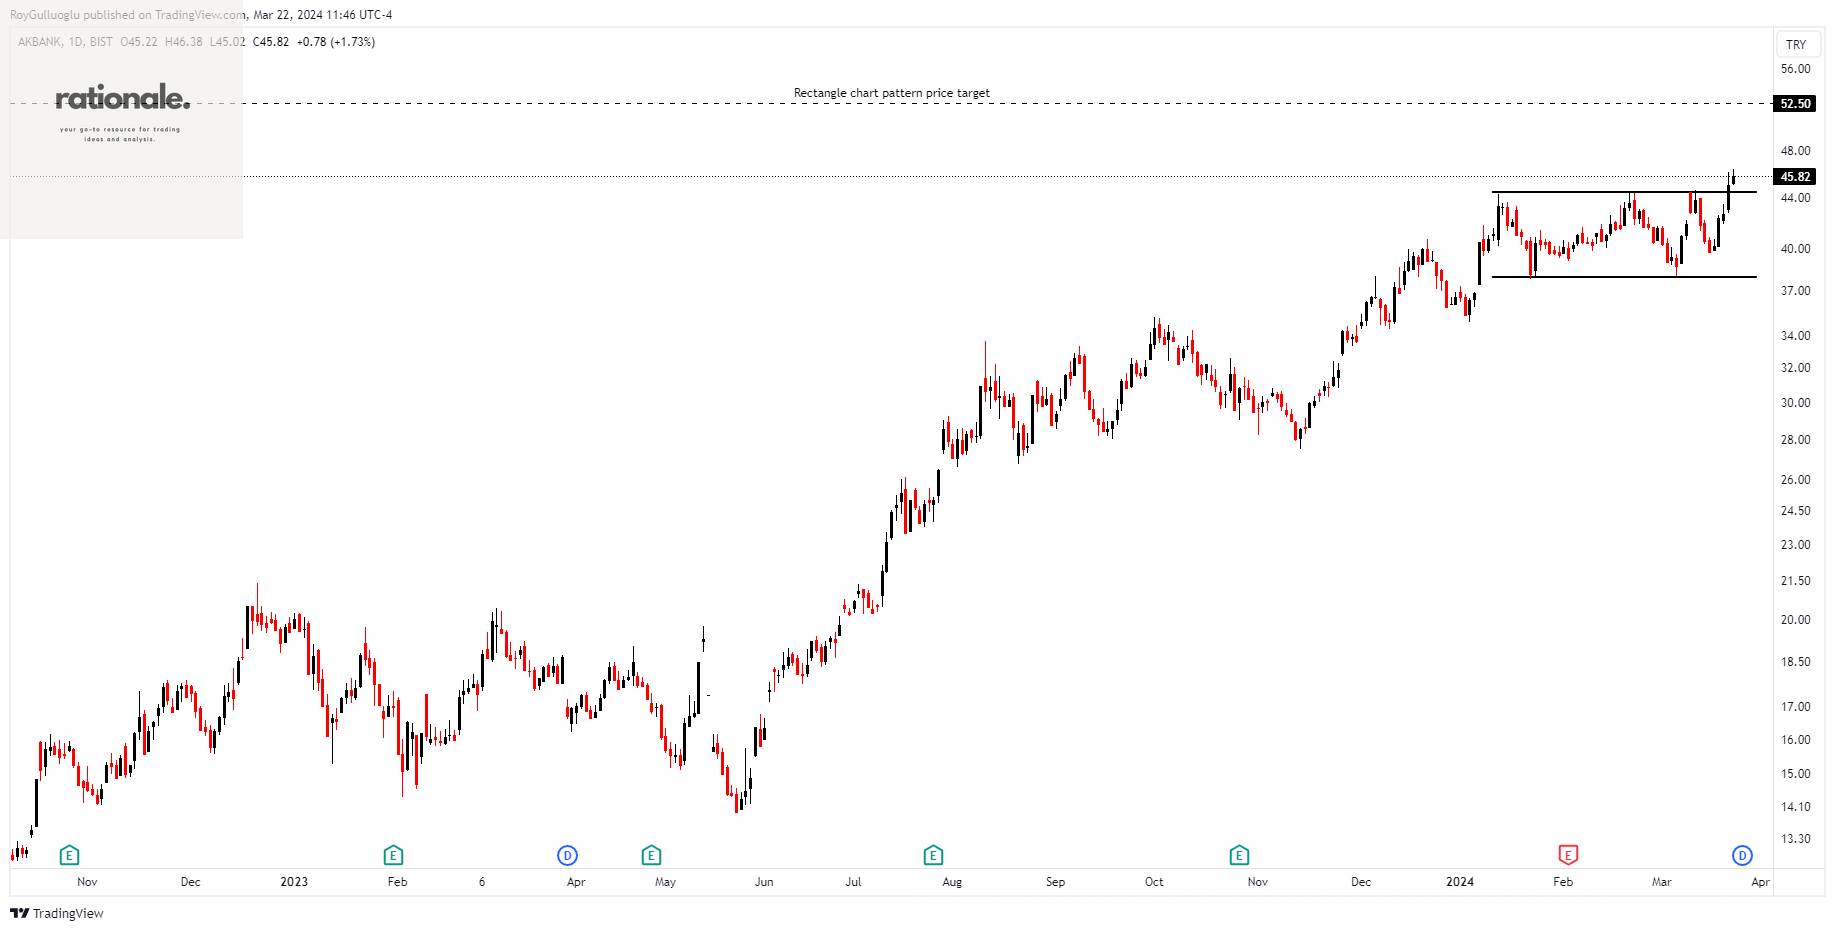
Akbank T.A.S., along with its subsidiary entities, offers a diverse range of banking products and services both domestically in Turkey and on an international scale. Its operations are divided into segments including Consumer Banking and Private Banking; Commercial Banking, Corporate Banking, and SME Banking; as well as Treasury, Other, and Unallocated divisions.
The above daily chart formed an approximately 2-month-long rectangle chart pattern as a bullish continuation after an uptrend.
The horizontal boundary at 44.4 levels acted as a resistance within this pattern.
A daily close above 45.73 levels validated the breakout from the 2-month-long rectangle chart pattern.
Based on this chart pattern, the potential price target is 52.5 levels.
AKBNK, classified under the "financial services" sector, falls under the “Mid Cap - Income” stock category.
Rexel S.A.-(RXL/EURONEXT)-Long Idea
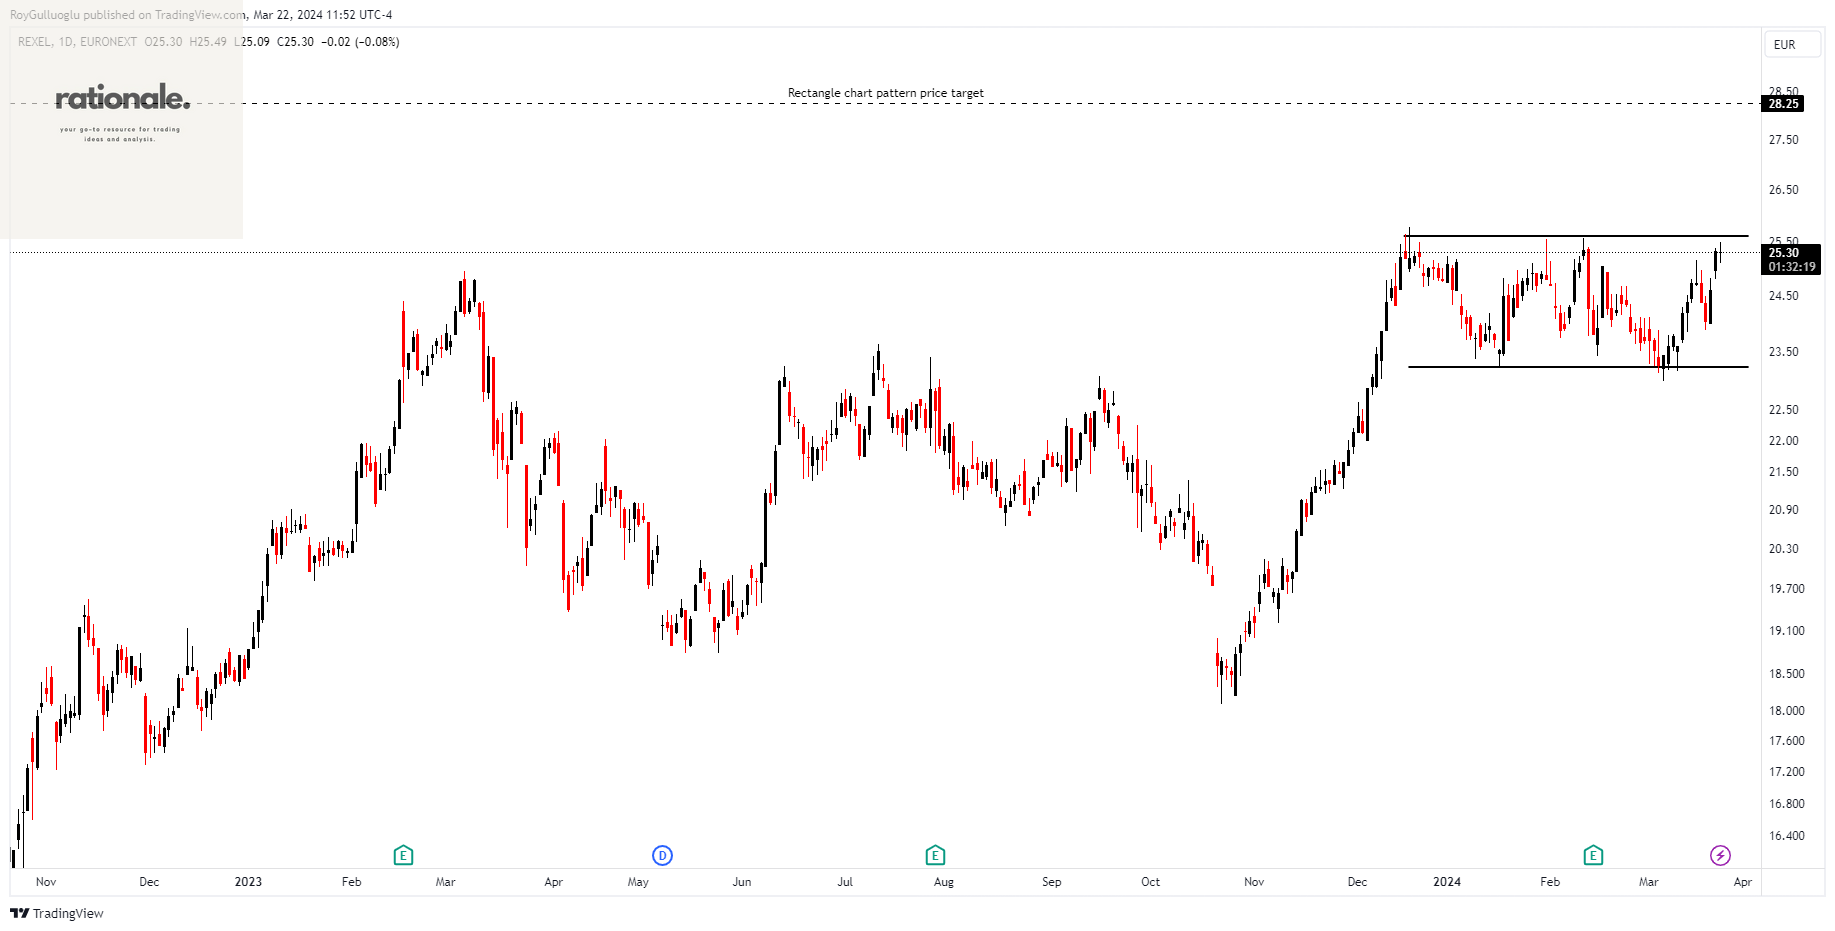
Rexel S.A., along with its subsidiary companies, is involved in distributing low and ultra-low-voltage electrical products and services across residential, commercial, and industrial sectors in France, Europe, North America, and the Asia-Pacific region.
The above daily chart formed an approximately 2-month-long rectangle chart pattern as a bullish continuation after an uptrend.
The horizontal boundary at 25.6 levels acts as a resistance within this pattern.
A daily close above 26.36 levels would validate the breakout from the 2-month-long rectangle chart pattern.
Based on this chart pattern, the potential price target is 28.25 levels.
RXL, classified under the "technology" sector, falls under the “Mid Cap - Growth” stock category.
Arkema S.A.-(AKE/EURONEXT)-Long Idea
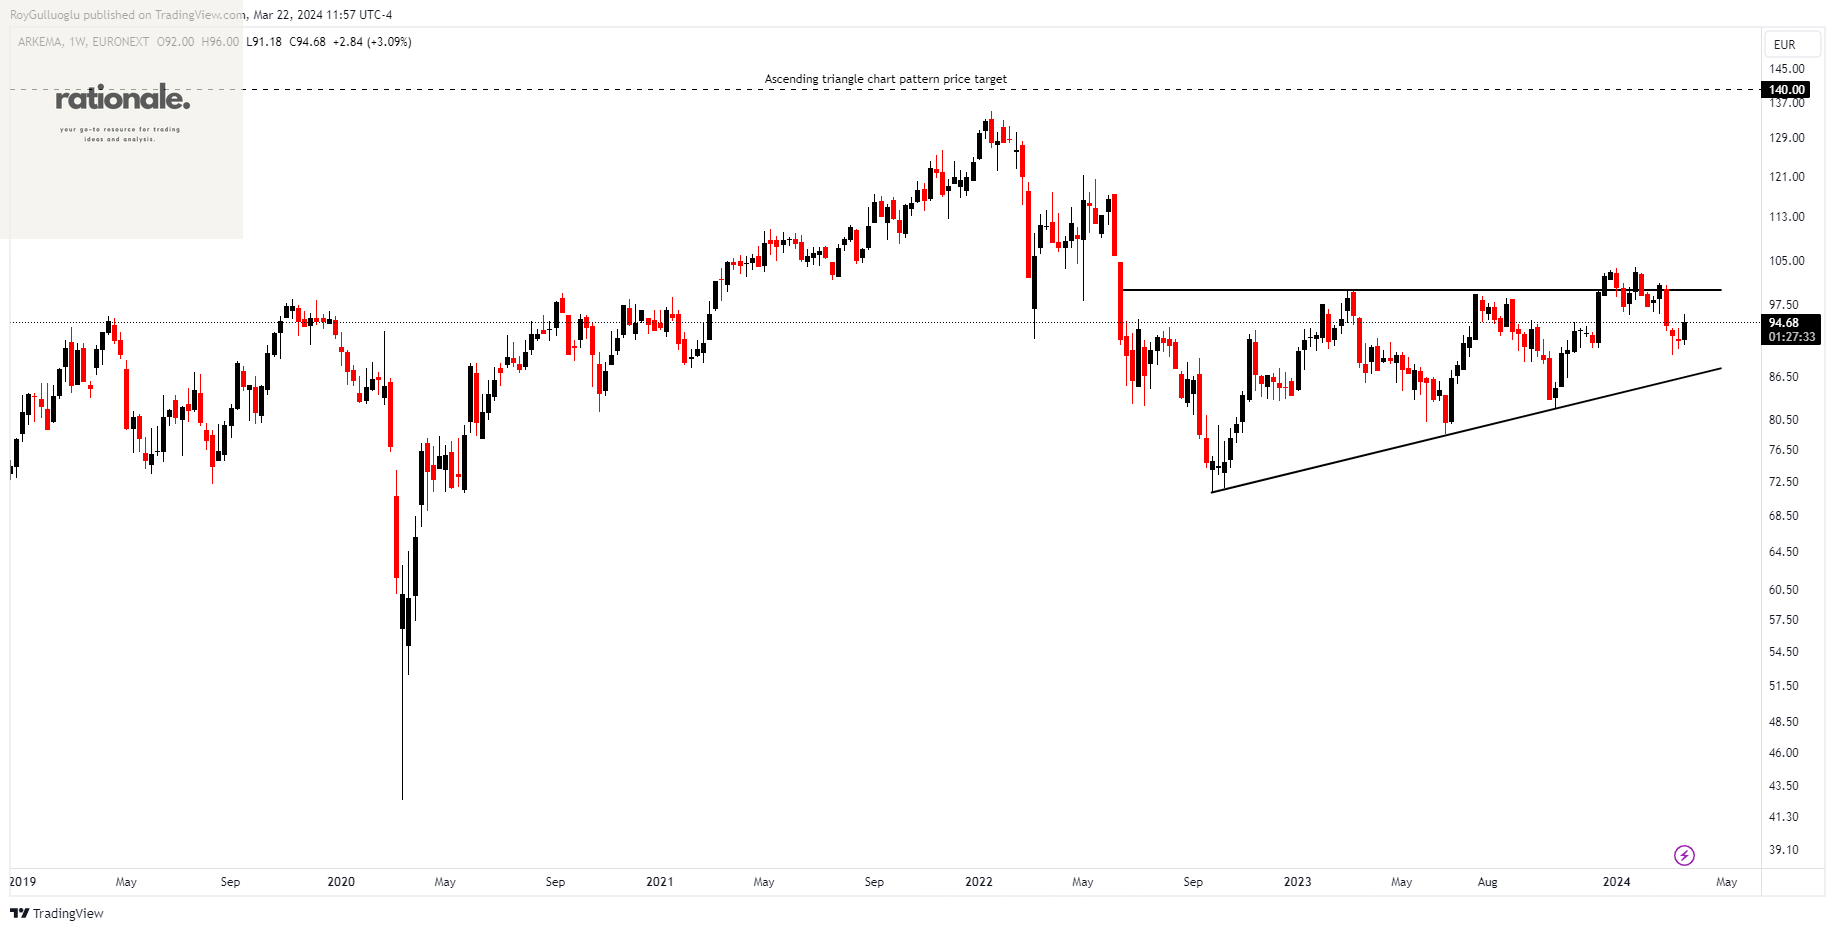
Arkema S.A. produces and markets specialty chemicals and advanced materials on a global scale. The company is divided into three segments: Adhesive Solutions, Advanced Materials and Coating Solutions, and Intermediates.
The above weekly chart formed an approximately 19-month-long ascending triangle chart pattern as a bullish reversal after a downtrend.
The horizontal boundary at 100 levels acts as a resistance within this pattern.
A daily close above 103 levels would validate the breakout from the 19-month-long ascending triangle chart pattern.
Based on this chart pattern, the potential price target is 140 levels.
AKE, classified under the "basic materials" sector, falls under the “Mid Cap - Value” stock category.
Commerzbank AG-(CBK/XETR)-Long Idea
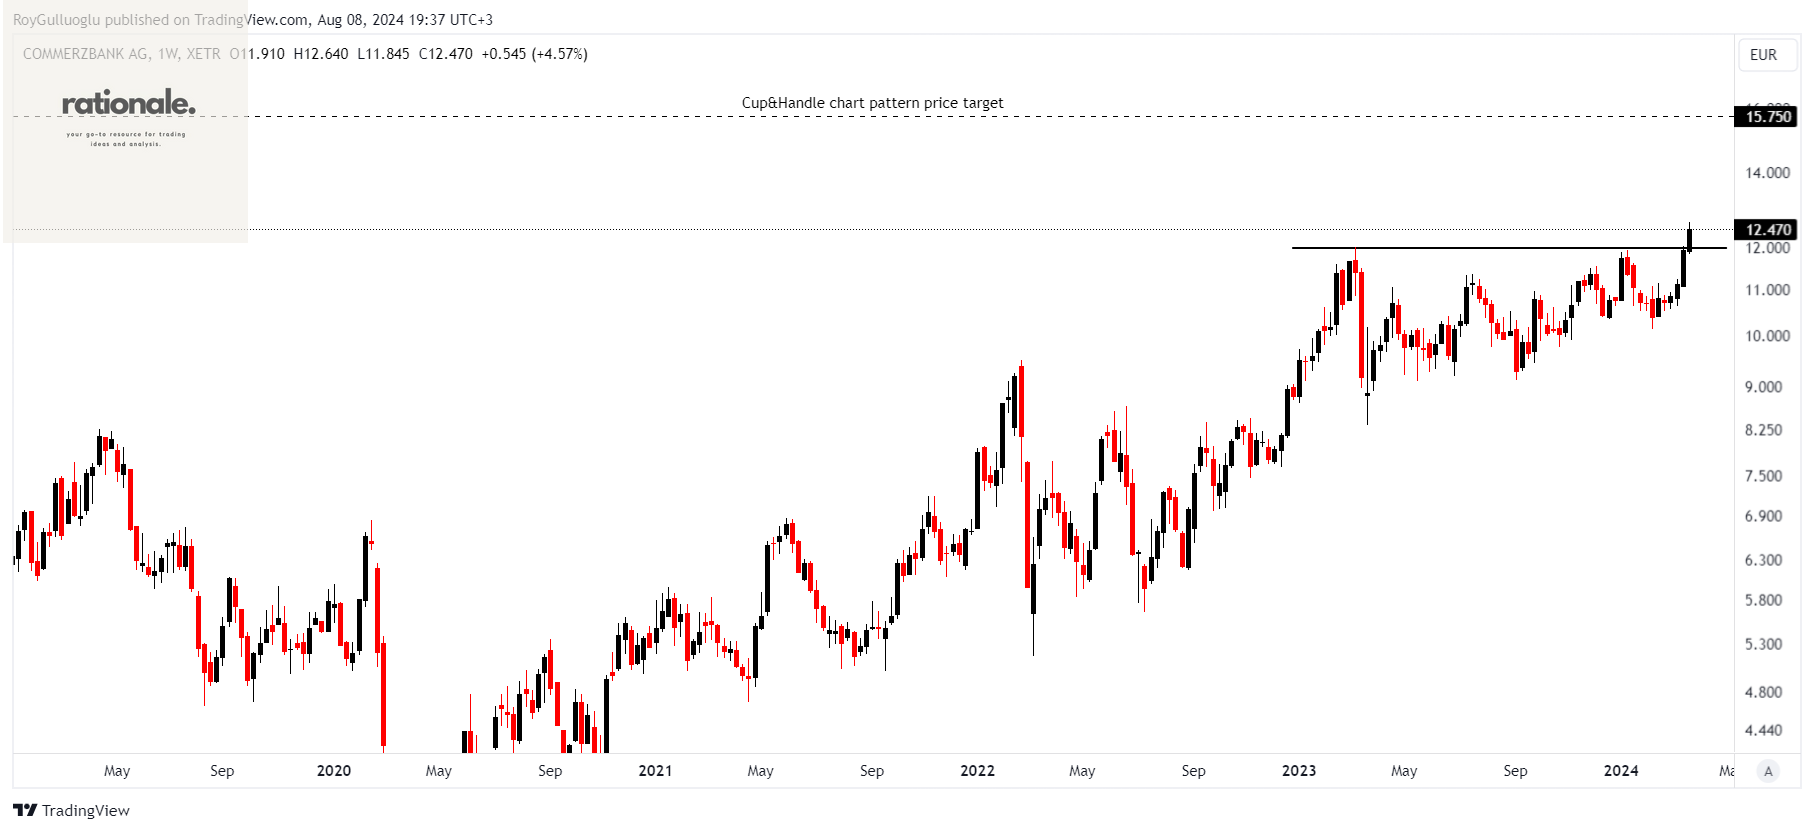
Commerzbank AG offers banking and capital market products and services to a wide range of customers including private individuals, small businesses, corporations, financial service providers, and institutional clients. Its operations span across Germany, the rest of Europe, the Americas, Asia, and other international markets.
The above weekly chart formed an approximately 13-month-long ascending triangle chart pattern as a bullish continuation after an uptrend.
The horizontal boundary at 11.985 levels acted as a resistance within this pattern.
A daily close above 12.34 levels validated the breakout from the 13-month-long ascending triangle chart pattern.
Based on this chart pattern, the potential price target is 15.75 levels.
CBK, classified under the "financial services" sector, falls under the “Large Cap - Income” stock category.
Compass Group PLC-(CPG/LSE)-Long Idea
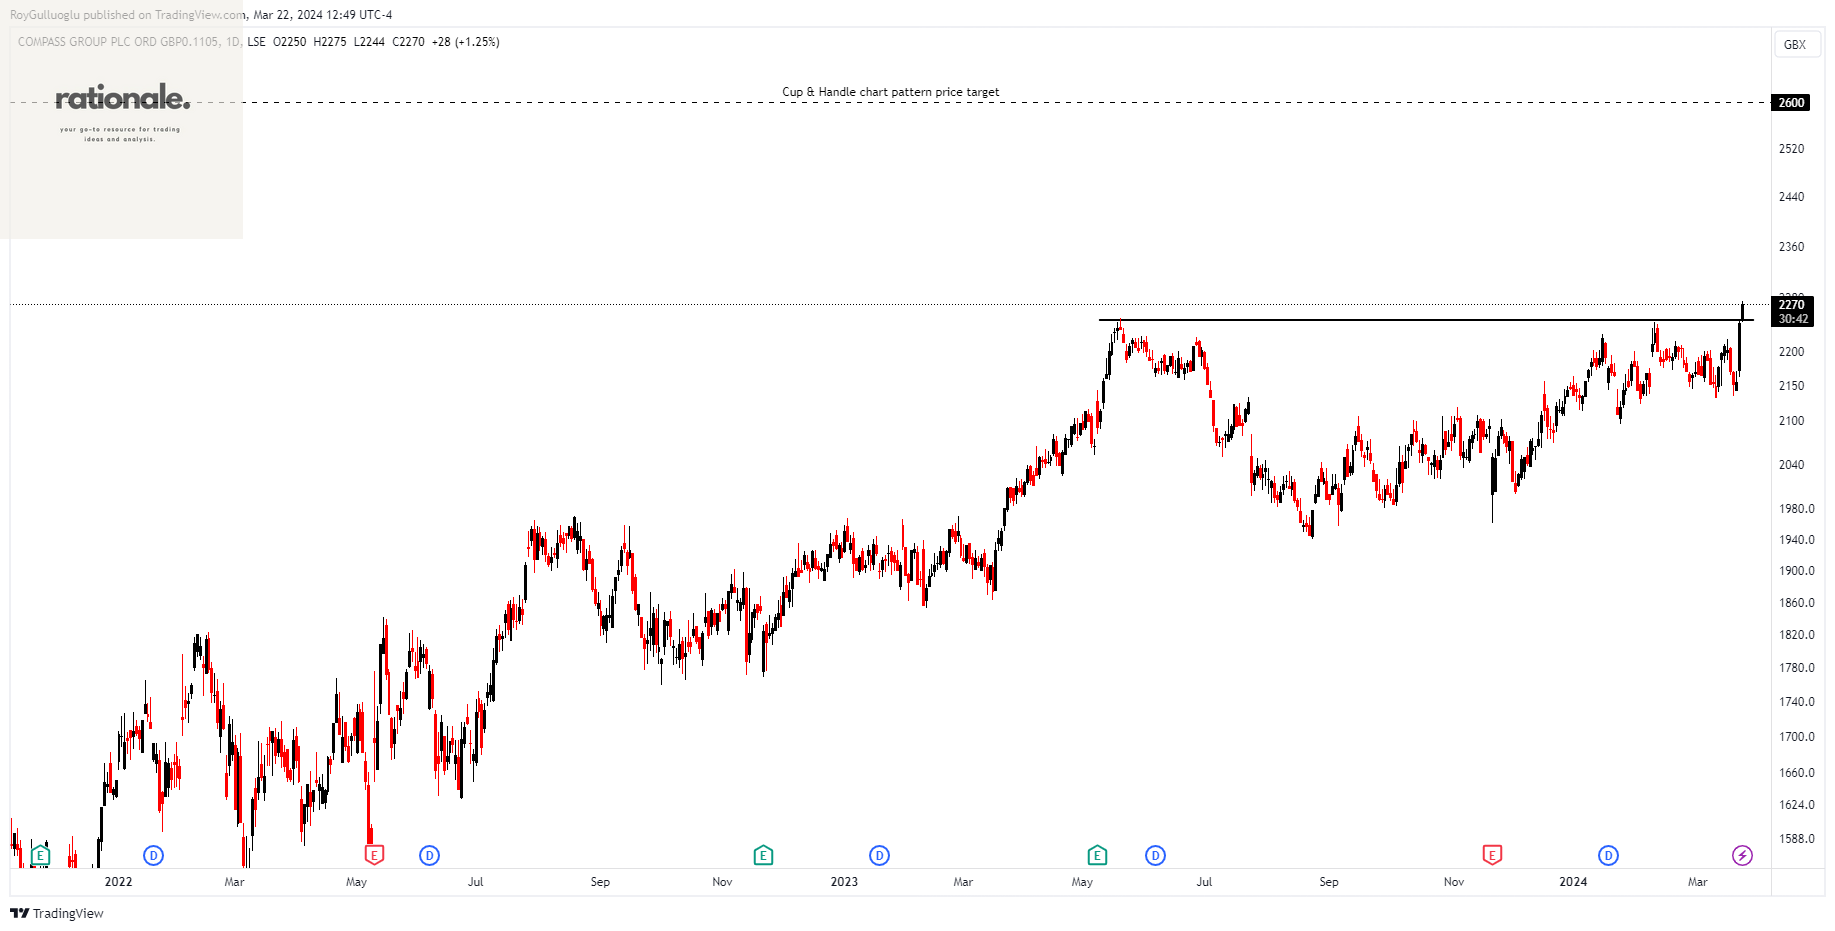
Compass Group PLC is a food and support services provider across North America, Europe, and various international locations. Its offerings encompass support services such as hospital cleaning, corporate headquarters reception services, management of remote camps, grounds, and facilities maintenance at educational institutions, among others.
The above daily chart formed an approximately 7-month-long Cup & Handle chart pattern as a bullish continuation after an uptrend.
The horizontal boundary at 2247 levels acts as a resistance within this pattern.
A daily close above 2314 levels would validate the breakout from the 7-month-long Cup & Handle chart pattern.
Based on this chart pattern, the potential price target is 2600 levels.
CPG, classified under the "consumer cyclical" sector, falls under the “Large Cap - Growth” stock category.
Daicel Corporation-(4202/TSE)-Long Idea
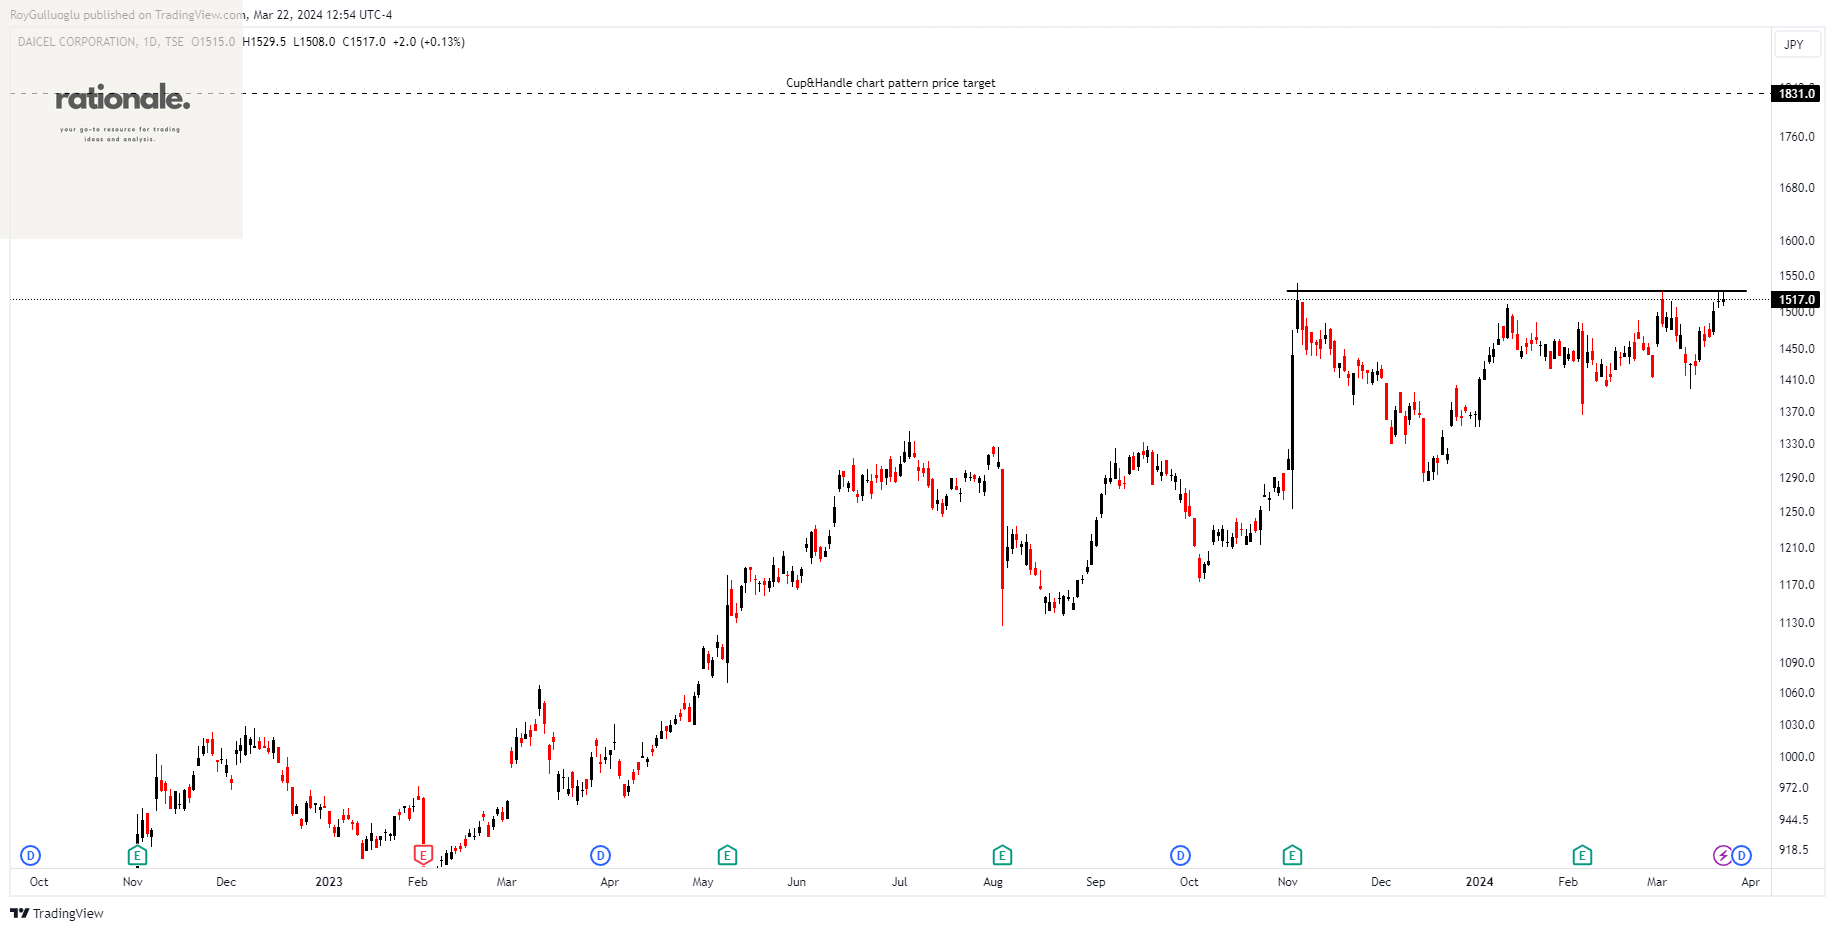
Daicel Corporation operates in various sectors including materials, medical/healthcare, smart technology, safety, engineering plastics, and other industries. Its operations span across Japan, China, and global markets.
The above daily chart formed an approximately 3-month-long Cup & Handle chart pattern as a bullish continuation after an uptrend.
The boundary at 1528 levels acts as a resistance within this pattern.
A daily close above 1573 levels would validate the breakout from the 3-month-long rectangle chart pattern.
Based on this chart pattern, the potential price target is 1831 levels.
4202, classified under the "basic materials" sector, falls under the “Mid Cap - Value” stock category.
Oceaneering International, Inc.-(OII/NYSE)-Long Idea
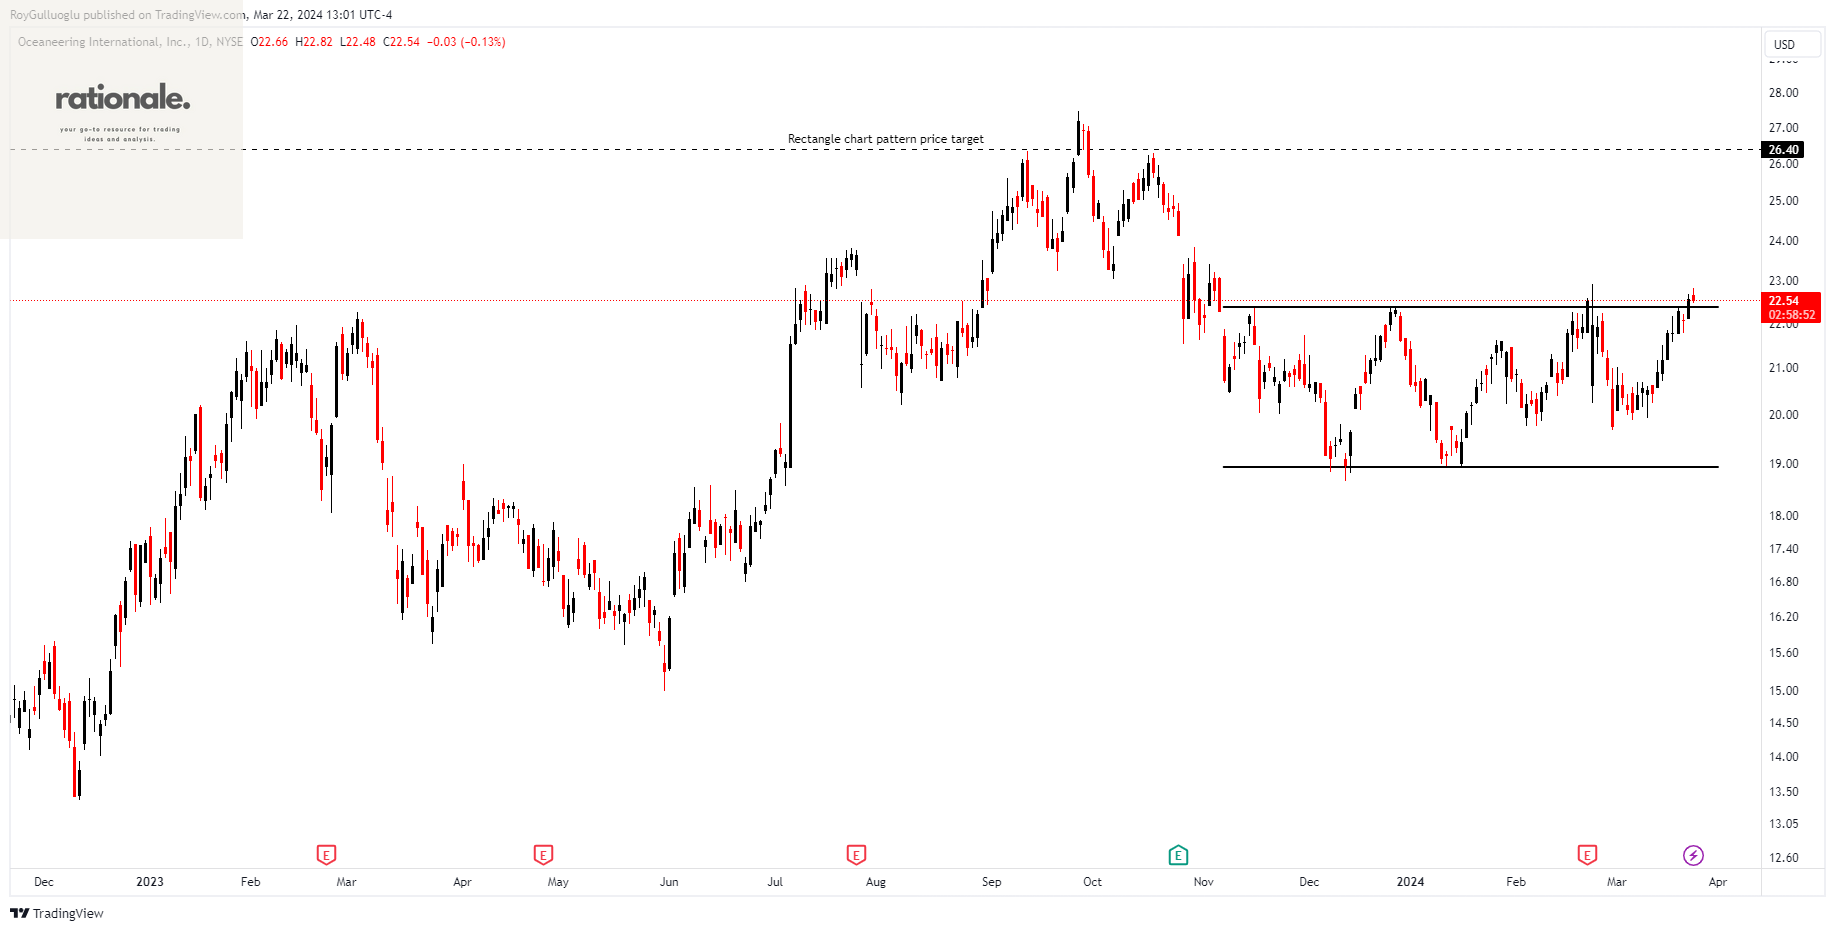
Oceaneering International, Inc. offers engineered services, products, and robotic solutions to various industries globally, including offshore energy, defense, aerospace, manufacturing, and entertainment.
The above daily chart formed an approximately 3-month-long rectangle chart pattern as a bullish reversal after a downtrend.
The boundary at 22.4 levels acts as a resistance within this pattern.
A daily close above 23 levels would validate the breakout from the 3-month-long rectangle chart pattern.
Based on this chart pattern, the potential price target is 26.4 levels.
OII, classified under the "energy" sector, falls under the “Mid Cap - Income” stock category.
Lear Corporation-(LEA/NYSE)-Long Idea
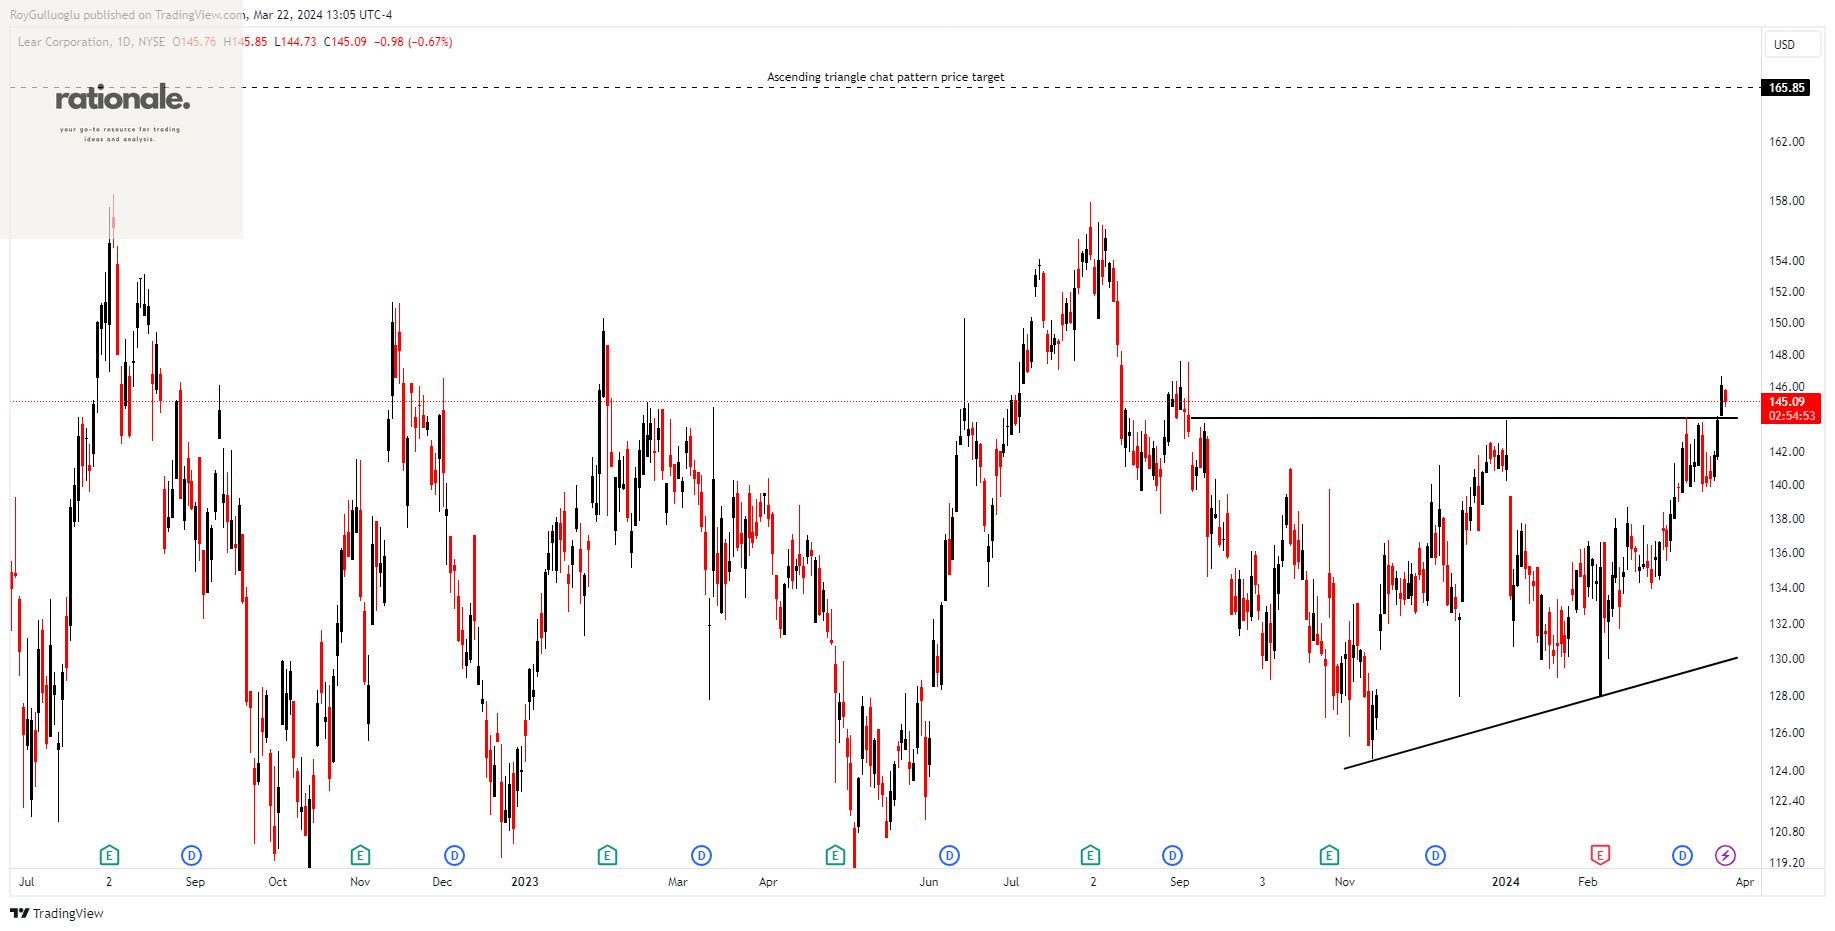
Lear Corporation specializes in the design, development, engineering, manufacturing, assembly, and supply of automotive seating, as well as electrical distribution systems and associated components for original equipment manufacturers in the automotive industry. Its operations extend across North America, Europe, Africa, Asia, and South America.
The above daily chart formed an approximately 4-month-long ascending triangle chart pattern as a bullish reversal after a downtrend.
The horizontal boundary at 144 levels acts as a resistance within this pattern.
A daily close above 148.3 levels would validate the breakout from the 4-month-long ascending triangle chart pattern.
Based on this chart pattern, the potential price target is 165.85 levels.
LEA, classified under the "consumer cyclicals" sector, falls under the “Mid Cap - Growth” stock category.
Lincoln National Corporation-(LNC/NYSE)-Long Idea
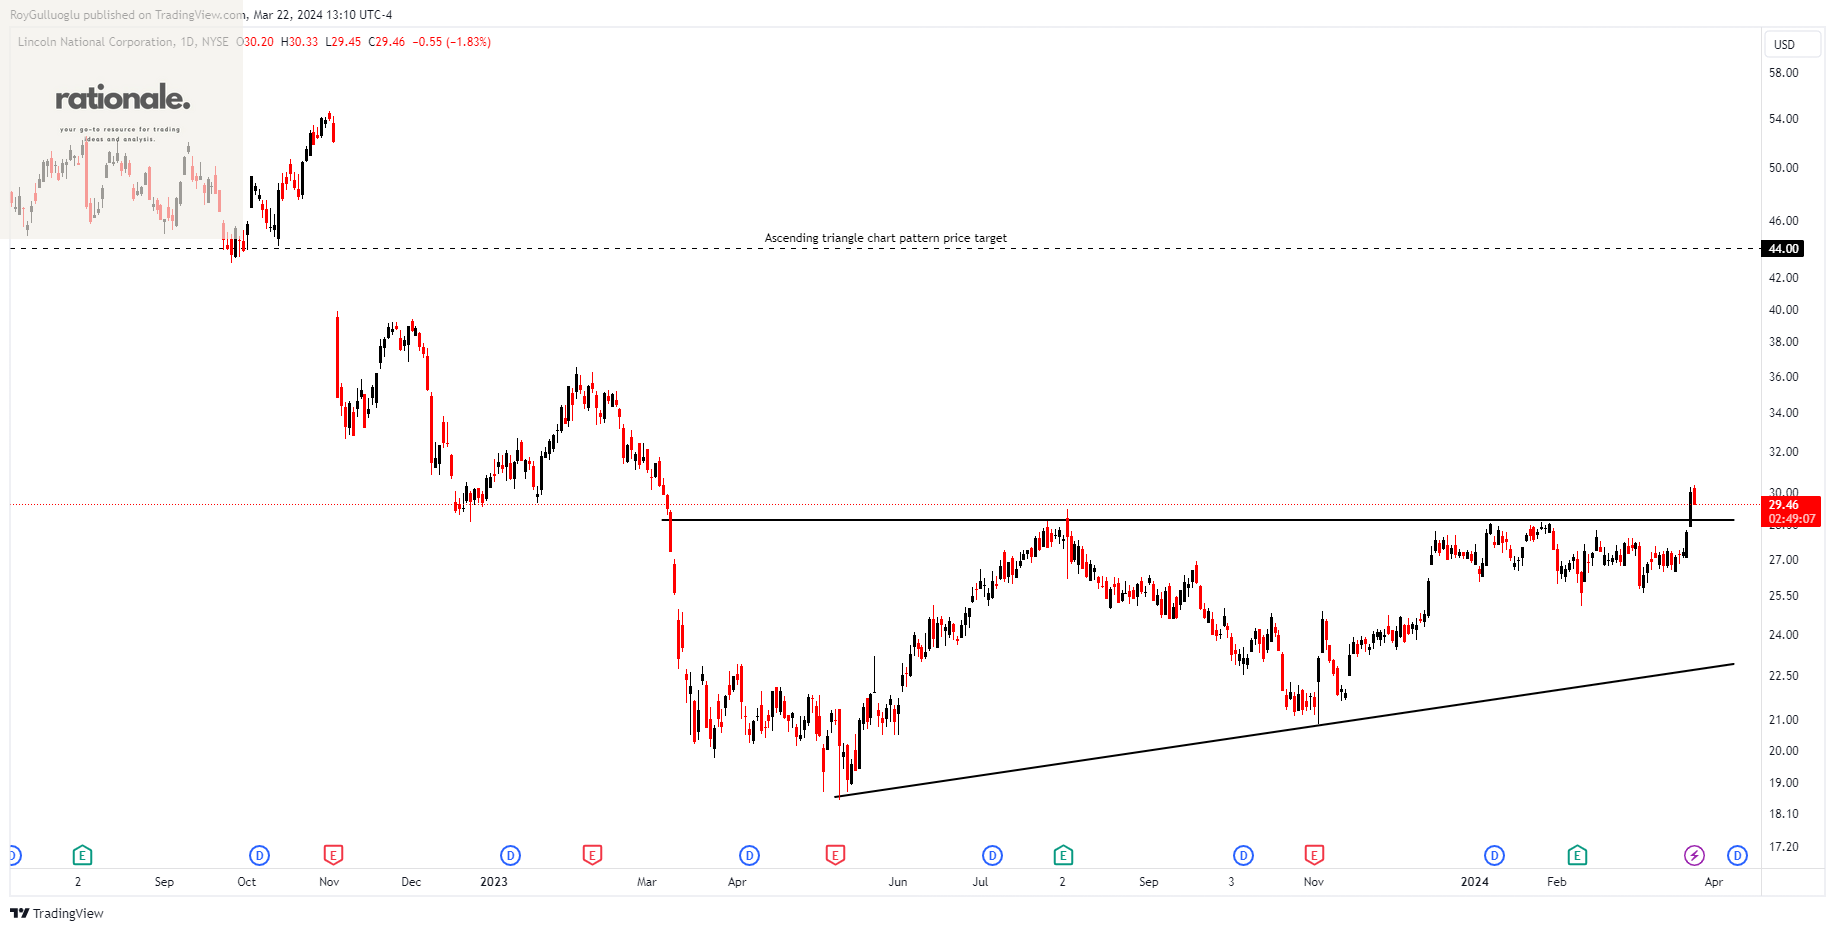
Lincoln National Corporation and its subsidiaries manage various insurance and retirement enterprises within the United States. The company is divided into four segments: Life Insurance, Annuities, Group Protection, and Retirement Plan Services.
The above daily chart formed an approximately 7-month-long ascending triangle chart pattern as a bullish reversal after a downtrend.
The horizontal boundary at 28.7 levels acted as a resistance within this pattern.
A daily close above 29.5 levels validated the breakout from the 7-month-long ascending triangle chart pattern.
Based on this chart pattern, the potential price target is 44 levels.
LNC, classified under the "financial services" sector, falls under the “Mid Cap - Income” stock category.
Public Service Enterprise Group Incorporated-(PEG/NYSE)-Long Idea
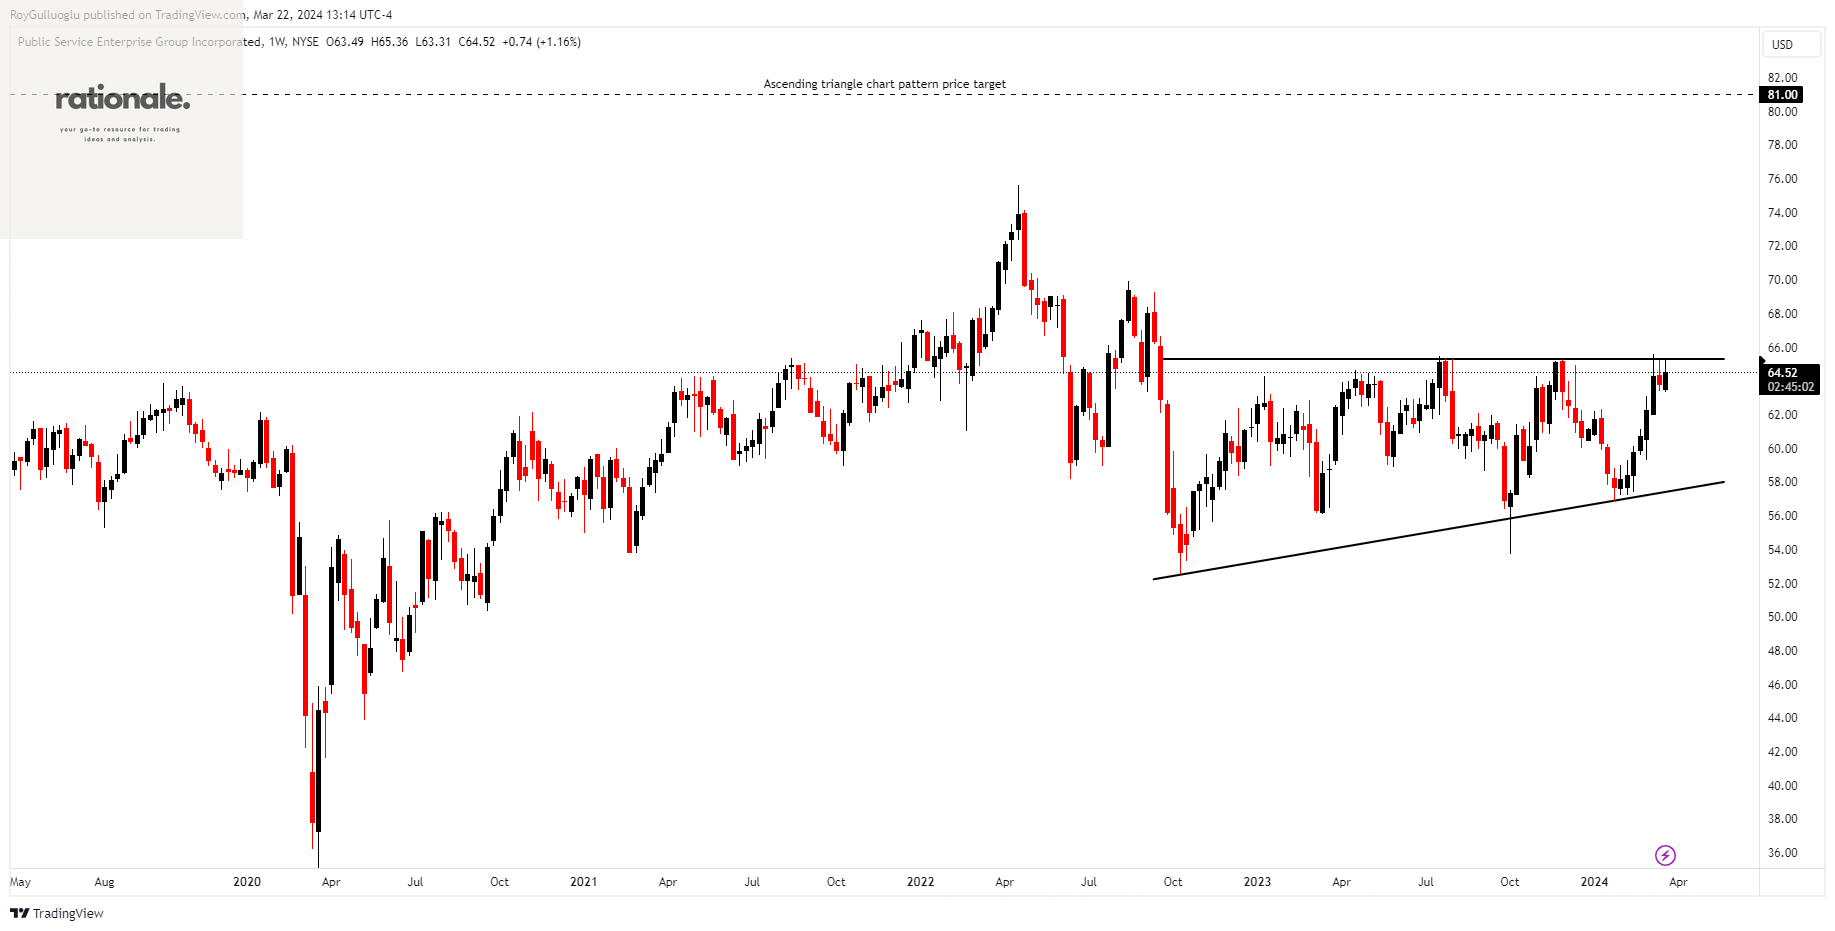
Public Service Enterprise Group Incorporated, along with its subsidiaries, engages in the electric and gas utility sector within the United States. The company's operations are divided into PSE&G and PSEG Power segments.
The above weekly chart formed an approximately 18-month-long ascending triangle chart pattern as a bullish reversal after a downtrend.
The horizontal boundary at 65.3 levels acts as a resistance within this pattern.
A daily close above 67.25 levels would validate the breakout from the 18-month-long ascending triangle chart pattern.
Based on this chart pattern, the potential price target is 81 levels.
PEG, classified under the "utilities" sector, falls under the “Large Cap - Income” stock category.
Blackstone Inc.-(BX/NYSE)-Long Idea
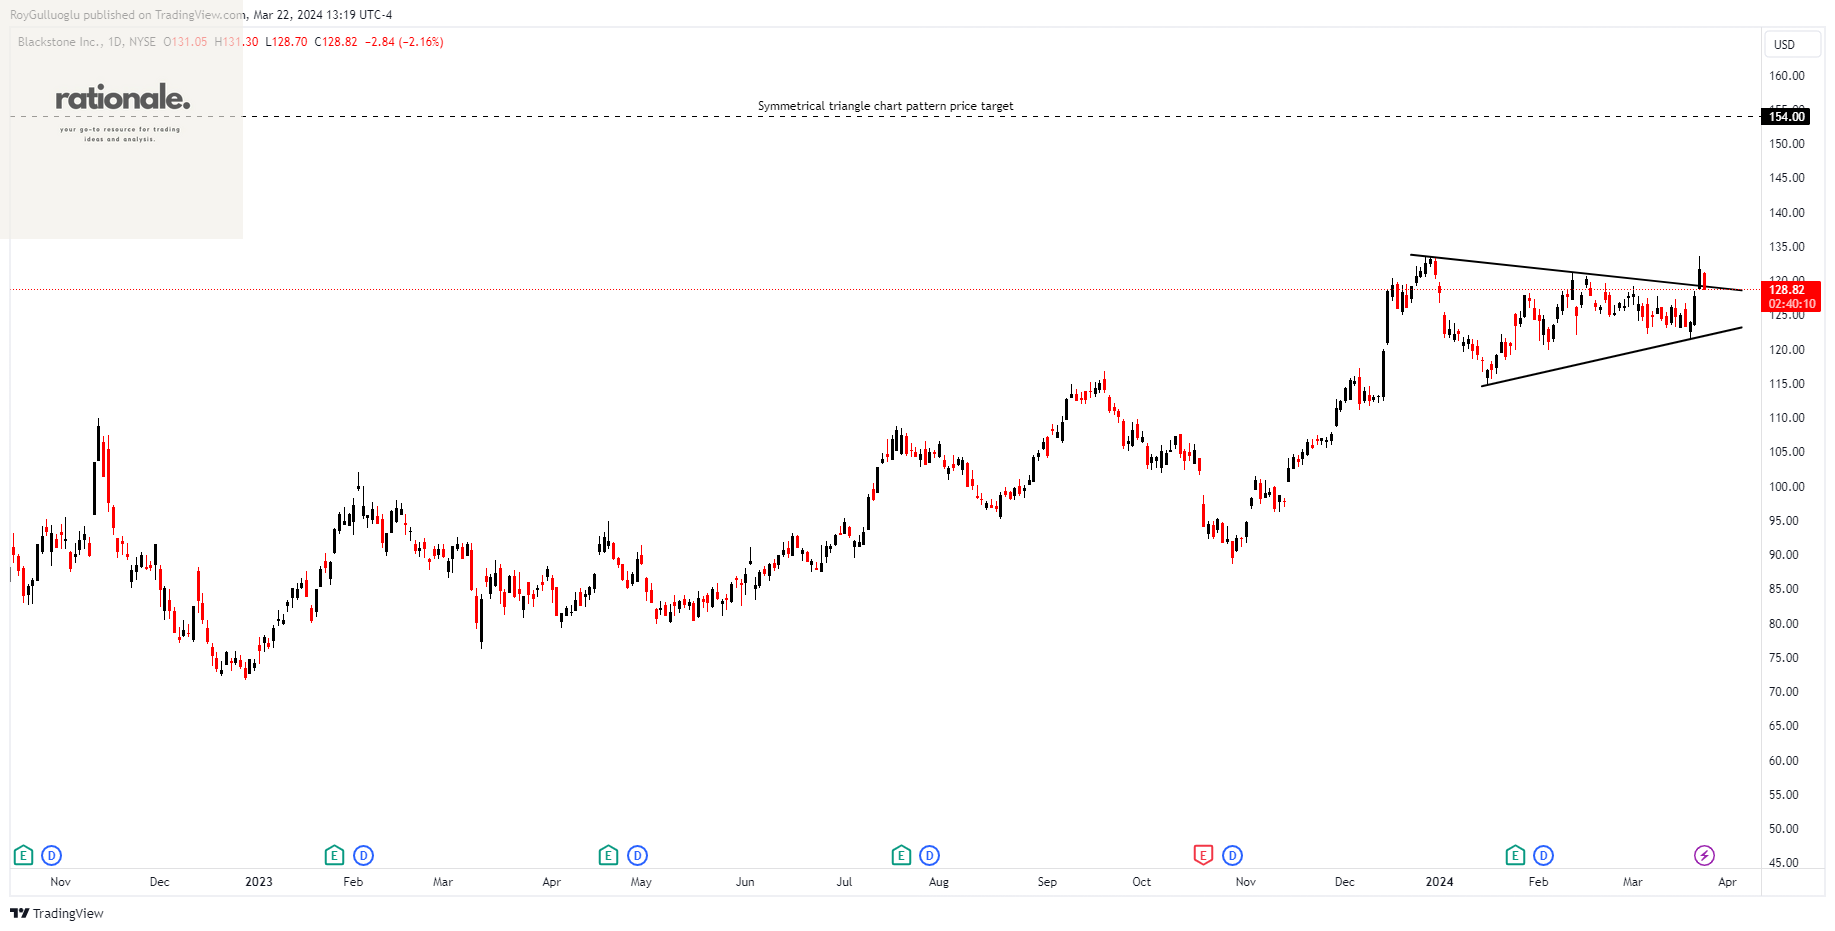
Blackstone Inc. is an alternative asset management company that focuses on real estate, private equity, hedge fund solutions, credit, secondary funds of funds, public debt and equity, as well as multi-asset class strategies.
The above weekly chart formed an approximately 2-month-long symmetrical triangle chart pattern as a bullish continuation after an uptrend.
The boundary at 131.4 levels acts as a resistance within this pattern.
A daily close above 135.3 levels would validate the breakout from the 2-month-long symmetrical triangle chart pattern.
Based on this chart pattern, the potential price target is 154 levels.
BX, classified under the "financial services" sector, falls under the “Large Cap - Income” stock category.