

Trade Ideas Equities
SIG(NYSE), LW(NYSE), OGS(NYSE), DIN(NYSE), CORZ(NASDAQ), VFC(NYSE), CPA(NYSE)

Signet Jewelers Limited-(SIG/NYSE)-Long Idea
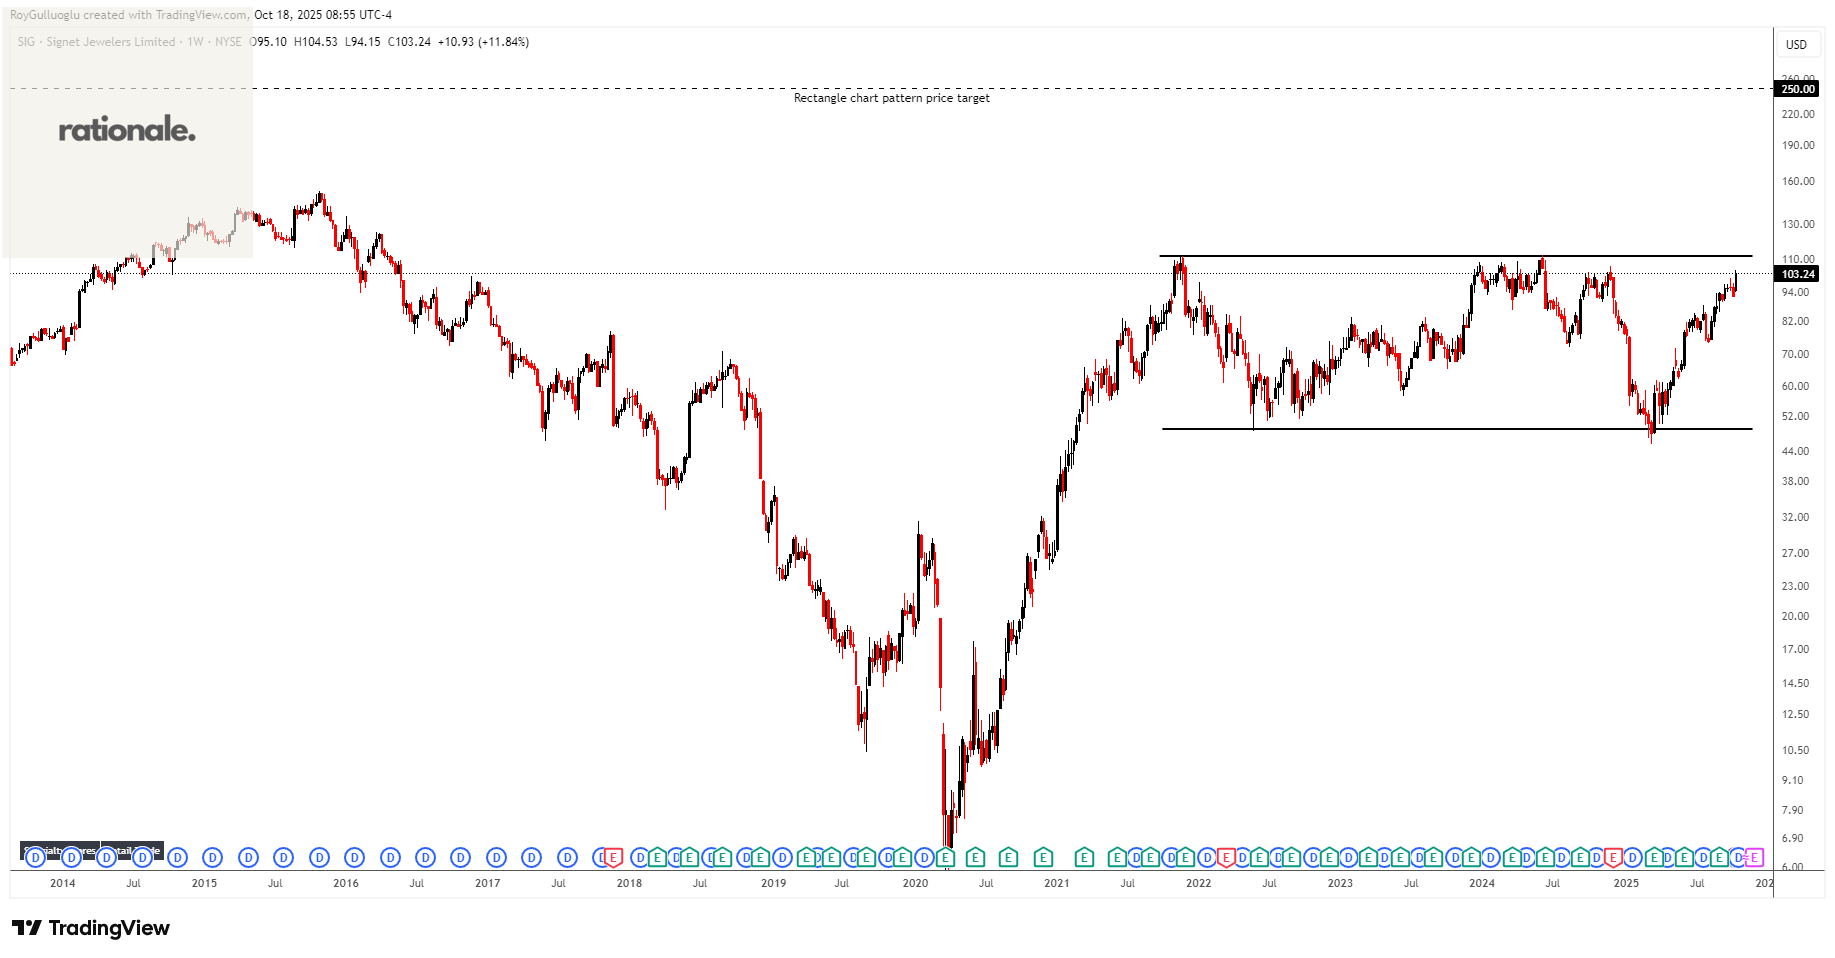
Signet Jewelers Limited operates as a diamond jewelry retailer. It operates through three segments: North America, International, and Other.
The above weekly chart formed an approximately 50-month-long rectangle chart pattern as a bullish continuation after an uptrend.
The horizontal boundary at 111.72 levels acts as a resistance within this pattern.
A daily close above 115 levels would validate the breakout from the 50-month-long rectangle chart pattern.
Based on this chart pattern, the potential price target is 250 levels.
SIG, classified under the “consumer cyclical” sector, falls under the “Mid Cap - Growth” stock category.
Lamb Weston Holdings, Inc.-(LW/NYSE)-Long Idea
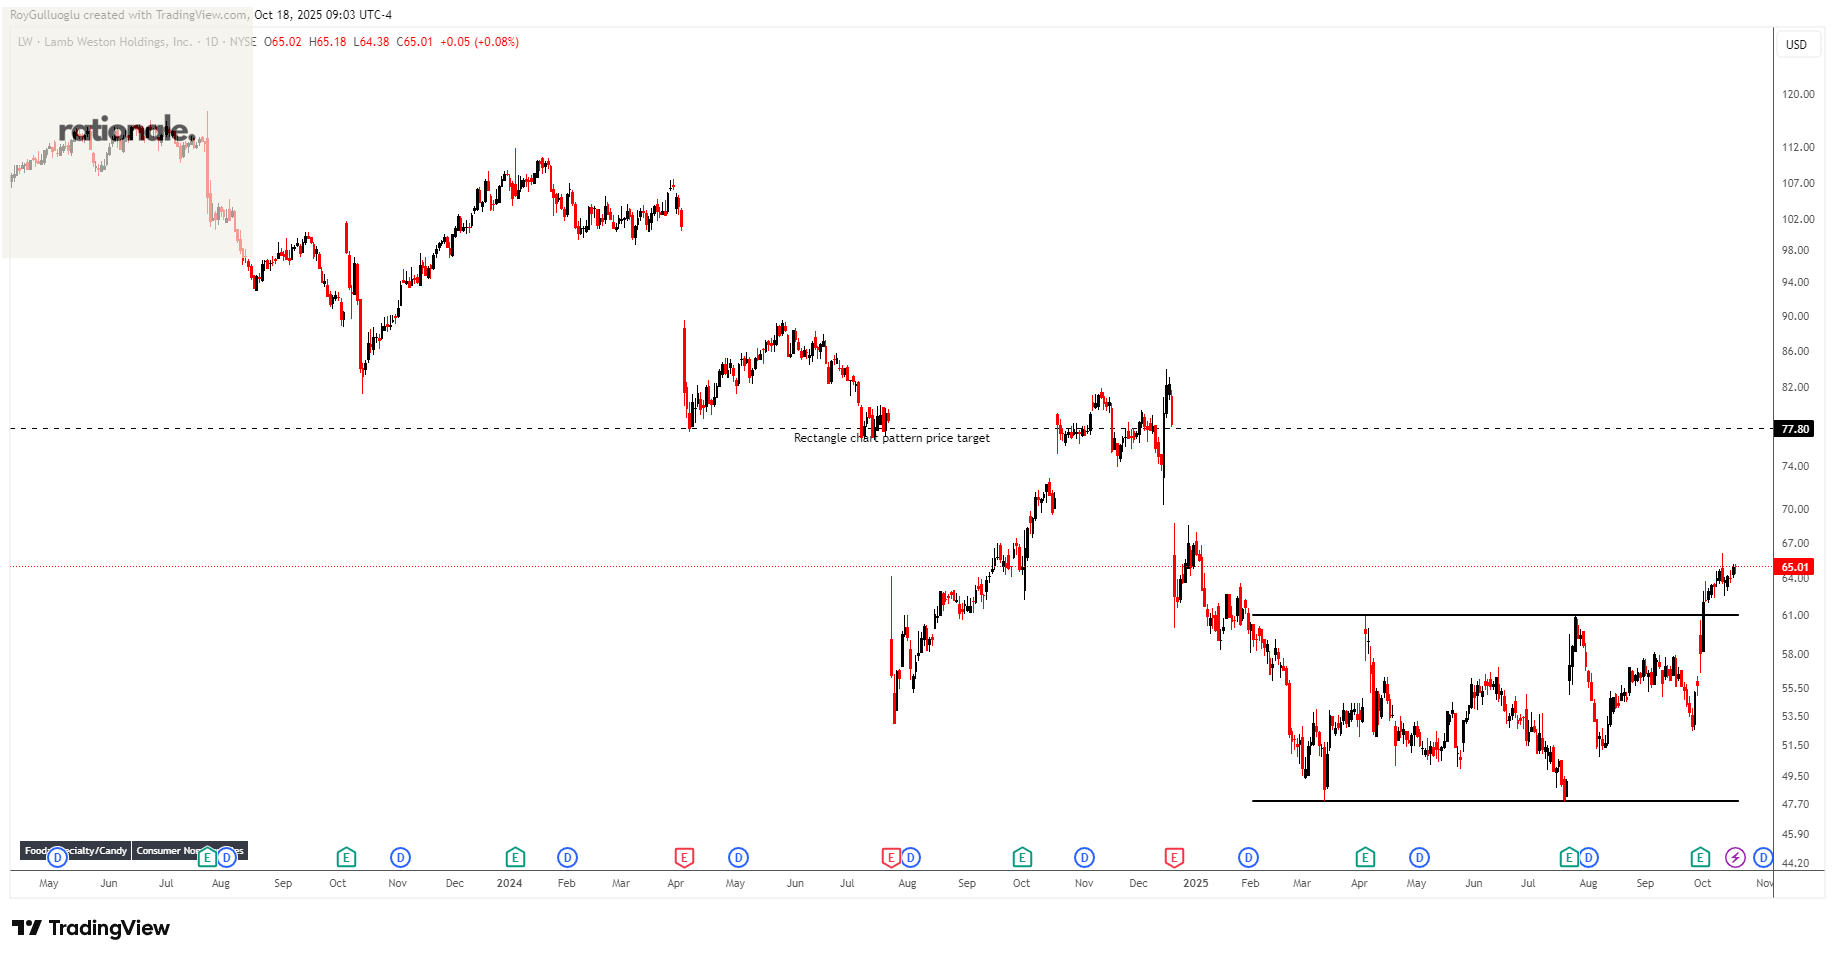
Lamb Weston Holdings, Inc. engages in the production, distribution, and marketing of frozen potato products in the United States, Canada, Mexico, and internationally.
The above daily chart formed an approximately 5-month-long rectangle chart pattern as a bullish reversal after a downtrend.
The horizontal boundary at 61 levels acted as a resistance within this pattern.
A daily close above 62.8 levels validated the breakout from the 5-month-long rectangle chart pattern.
Based on this chart pattern, the potential price target is 77.8 levels.
LW, classified under the “consumer defensive” sector, falls under the “Mid Cap - Value” stock category.
ONE Gas, Inc.-(OGS/NYSE)-Long Idea
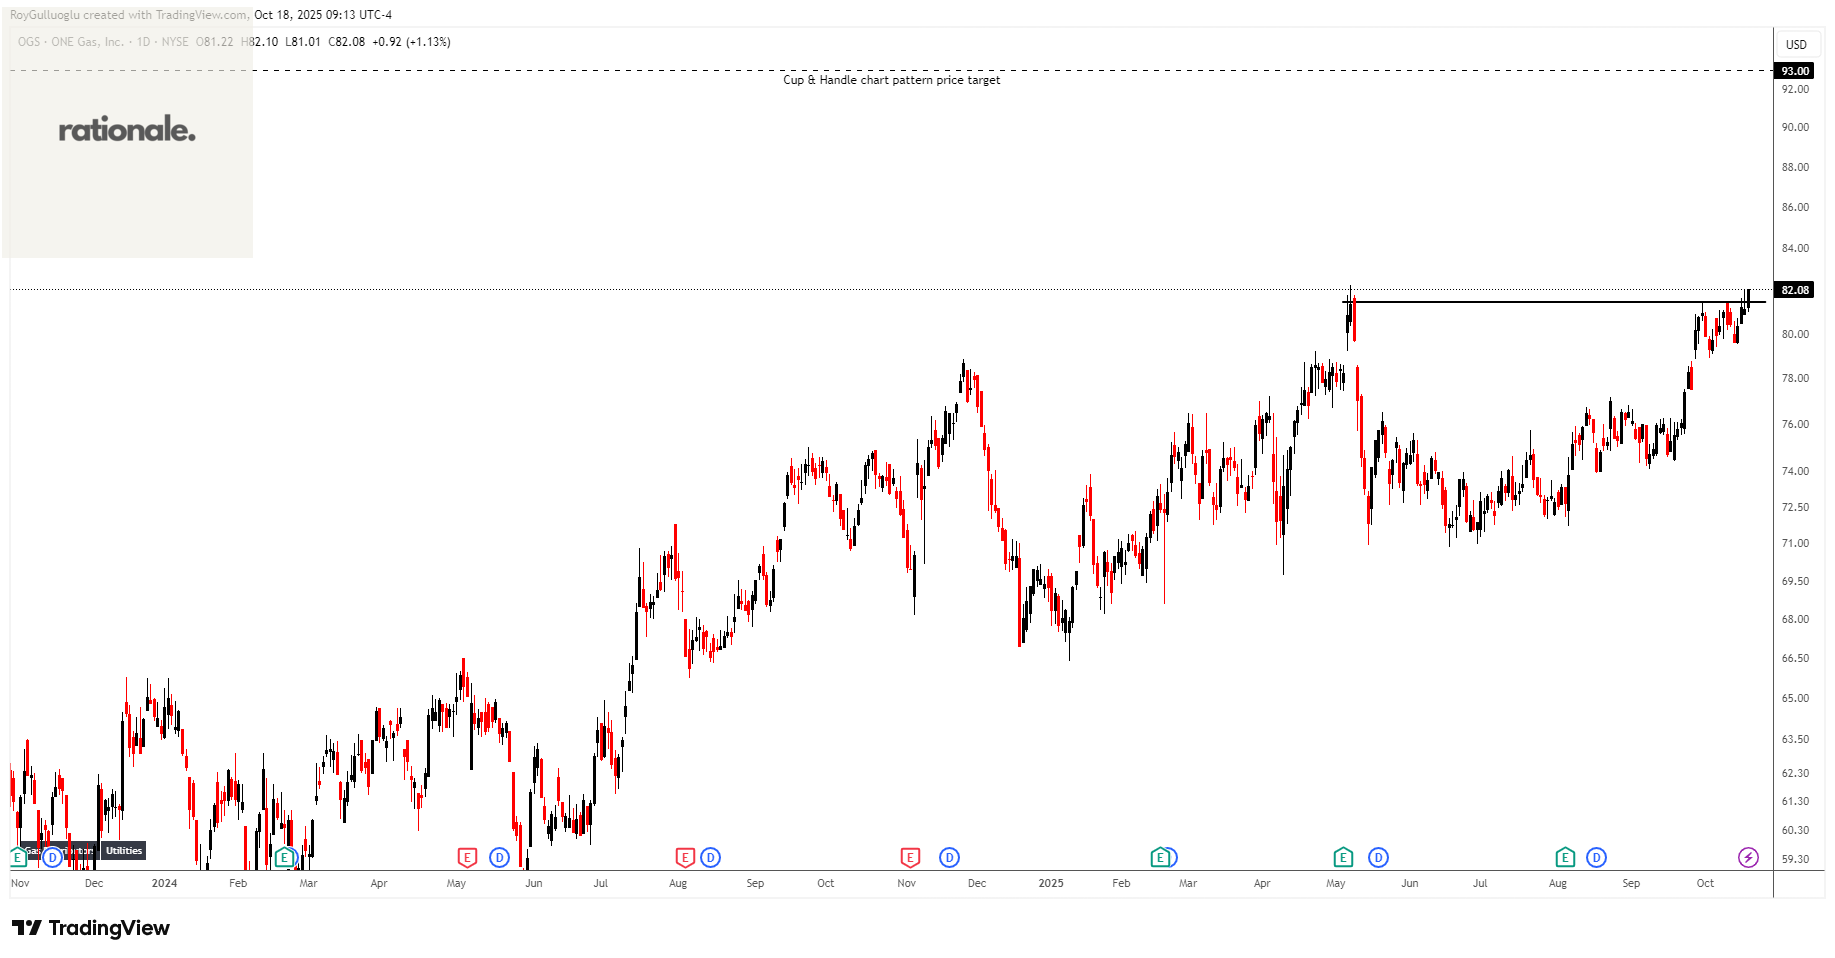
ONE Gas, Inc., together with its subsidiaries, operates as a regulated natural gas distribution utility company in the United States.
The above daily chart formed an approximately 4-month-long cup & handle chart pattern as a bullish continuation after an uptrend.
The horizontal boundary at 81.5 levels acts as a resistance within this pattern.
A daily close above 84 levels would validate the breakout from the 4-month-long cup & handle chart pattern.
Based on this chart pattern, the potential price target is 93 levels.
OGS, classified under the “utilities” sector, falls under the “Mid Cap - Income” stock category.
Dine Brands Global, Inc.-(DIN/NYSE)-Long Idea
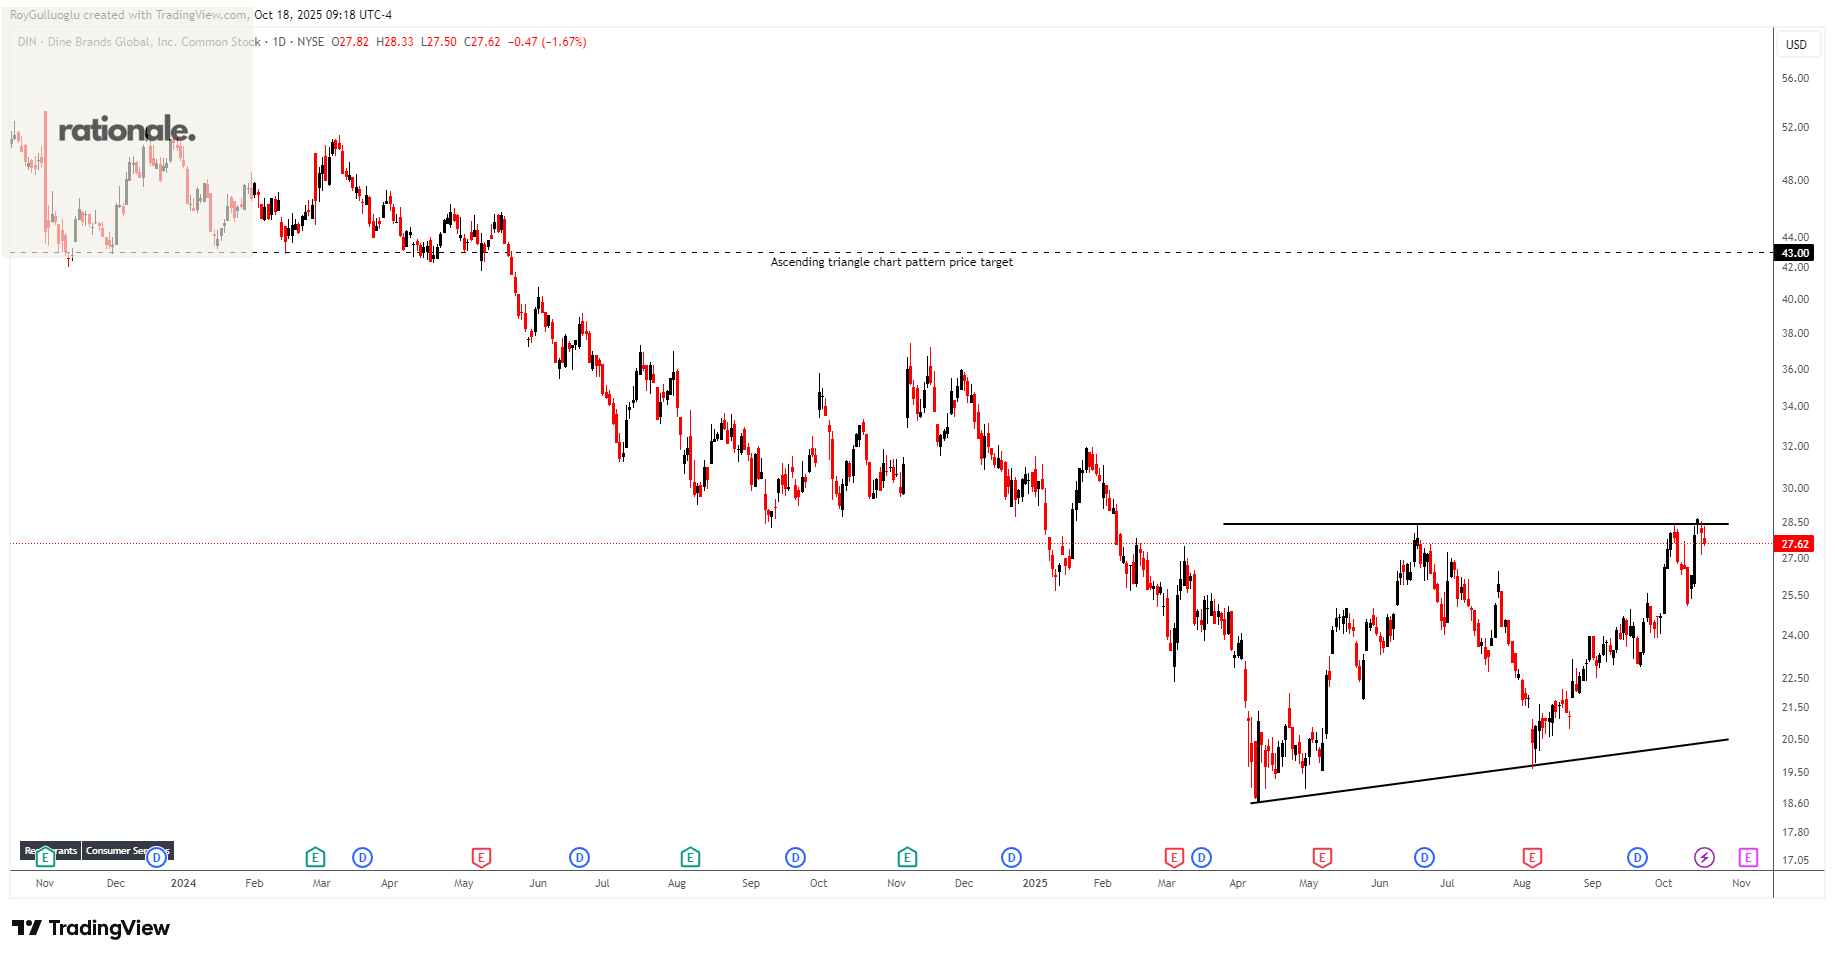
Dine Brands Global, Inc., together with its subsidiaries, owns, franchises, and operates restaurants in the United States and internationally
The above daily chart formed an approximately 4-month-long ascending triangle chart pattern as a bullish reversal after a downtrend.
The horizontal boundary at 28.4 levels acts as a resistance within this pattern.
A daily close above 29.25 levels would validate the breakout from the 4-month-long ascending triangle chart pattern.
Based on this chart pattern, the potential price target is 43 levels.
DIN, classified under the “consumer cyclical” sector, falls under the “Small Cap - Growth” stock category.
Core Scientific, Inc.-(CORZ/NASDAQ)-Long Idea
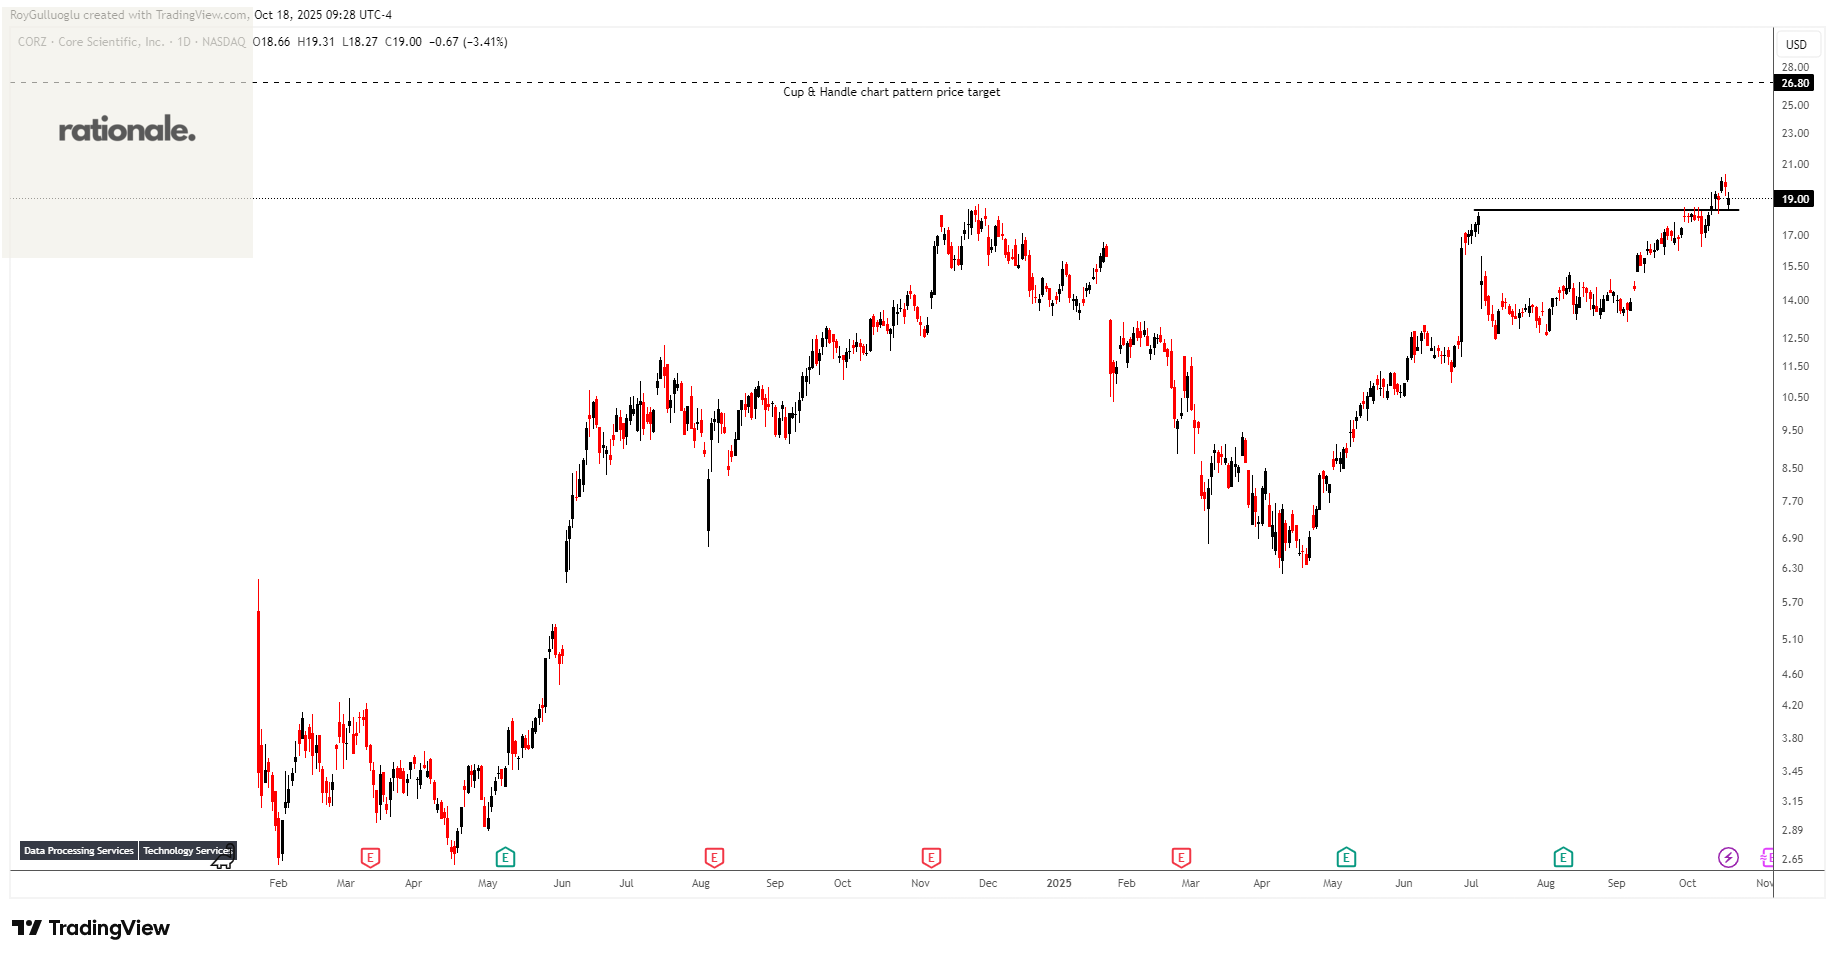
Core Scientific, Inc. provides digital asset mining services in the United States. It operates through three segments: Digital Asset Self-Mining; Digital Asset Hosted Mining; and HPC Hosting.
The above daily chart formed an approximately 3-month-long cup & handle chart pattern as a bullish continuation after an uptrend.
The horizontal boundary at 18.3 levels acted as a resistance within this pattern.
A daily close above 18.85 levels validated the breakout from the 3-month-long cup & handle chart pattern.
Based on this chart pattern, the potential price target is 26.8 levels.
CORZ, classified under the “technology” sector, falls under the “Mid Cap - Growth” stock category.
V.F. Corporation-(VFC/NYSE)-Long Idea
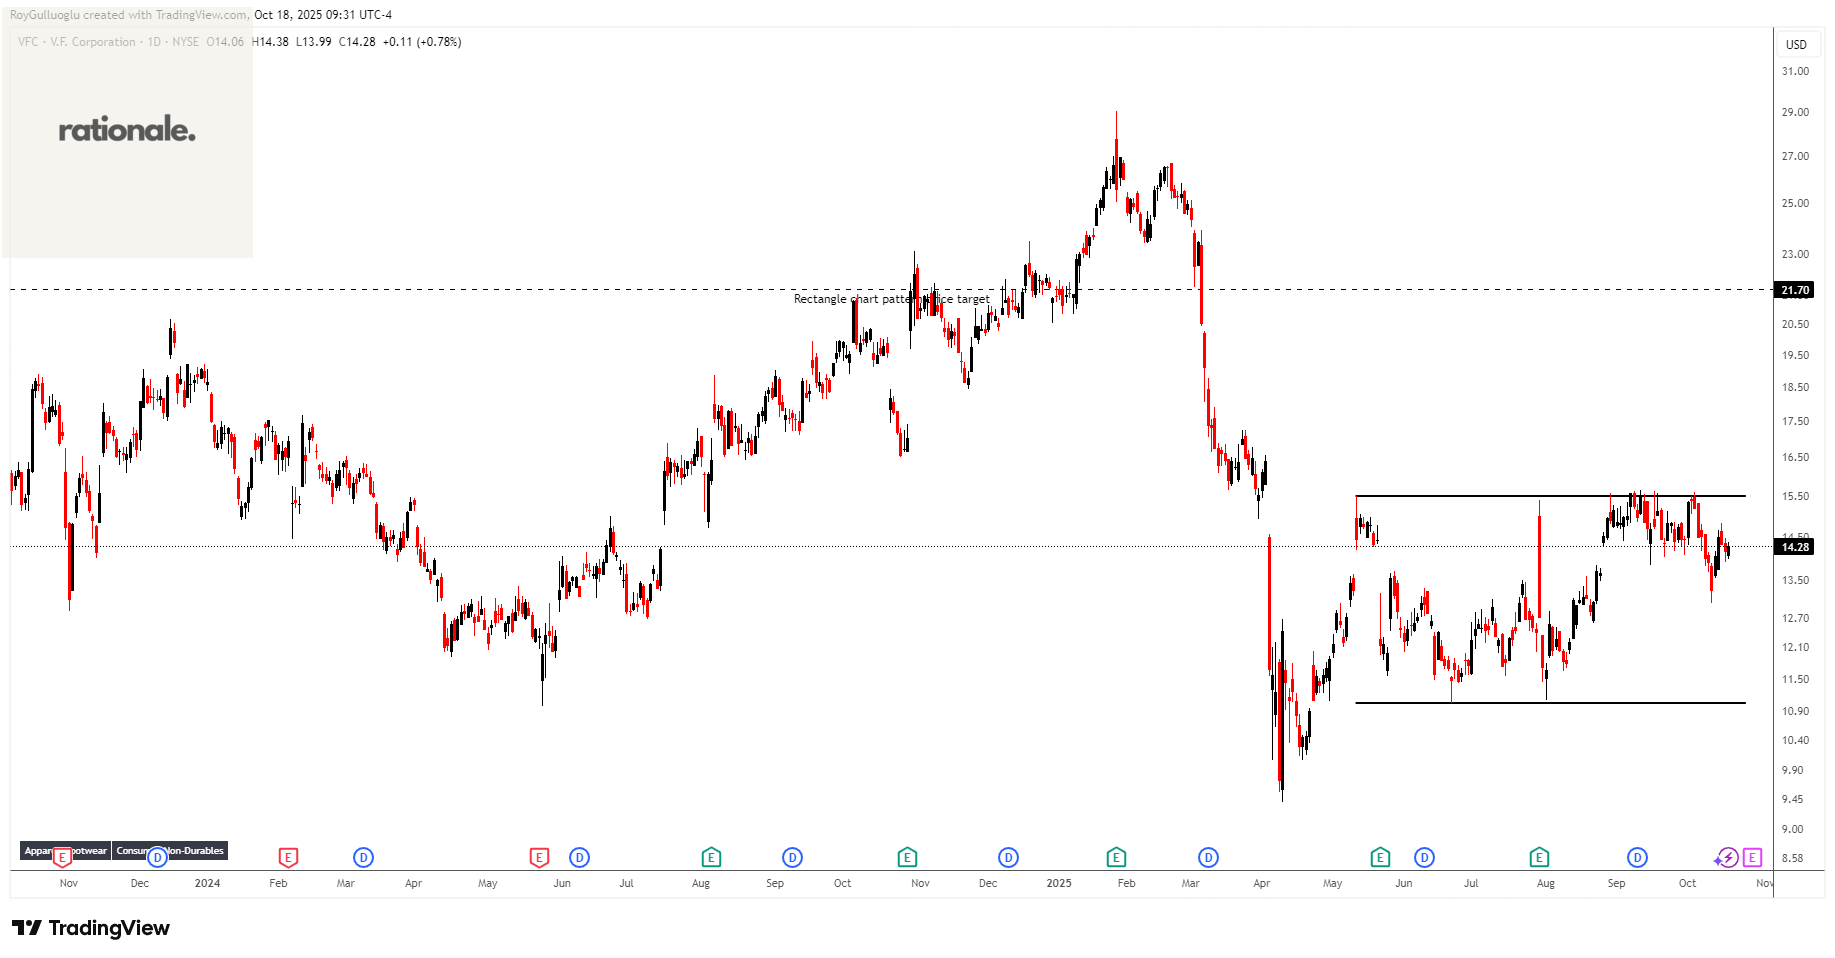
V.F. Corporation, together with its subsidiaries, offers branded apparel, footwear, and accessories for men, women, and children in the Americas, Europe, and the Asia-Pacific.
The above daily chart formed an approximately 4-month-long rectangle chart pattern as a bullish continuation after an uptrend.
The horizontal boundary at 15.49 levels acts as a resistance within this pattern.
A daily close above 15.95 levels would validate the breakout from the 4-month-long rectangle chart pattern.
Based on this chart pattern, the potential price target is 21.7 levels.
VFC, classified under the “consumer cyclical” sector, falls under the “Mid Cap - Growth” stock category.
Copa Holdings, S.A.-(CPA/NYSE)-Long Idea
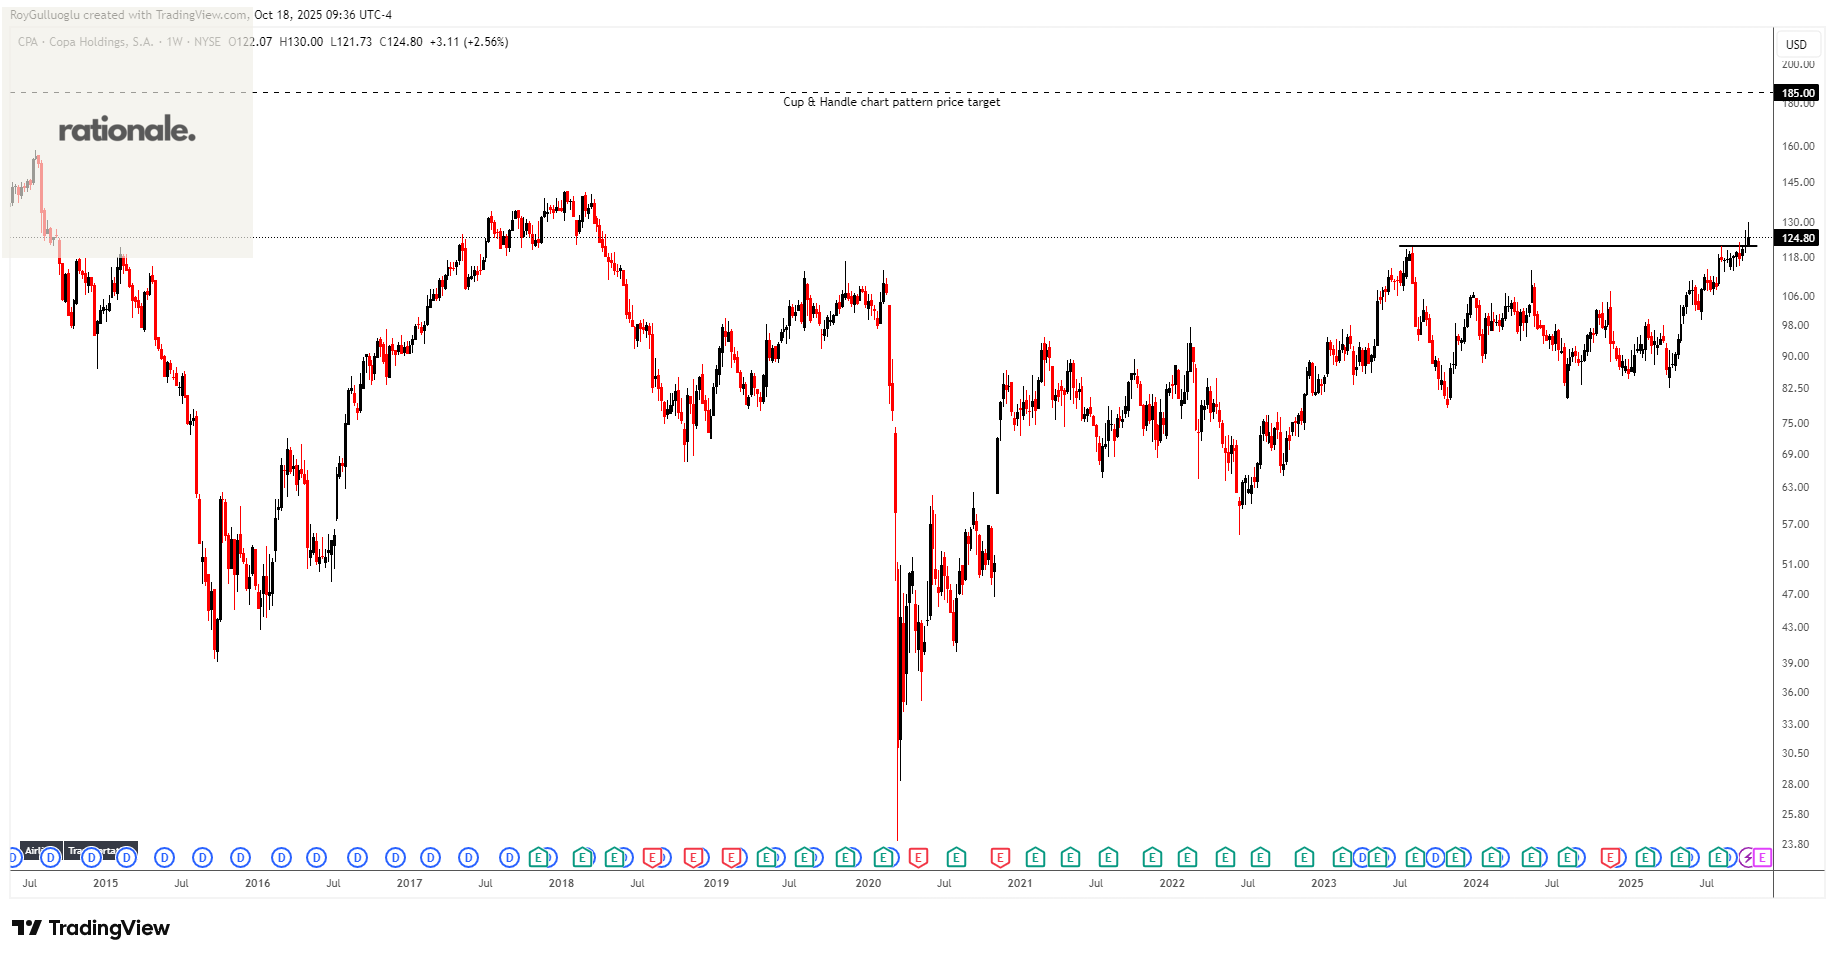
Copa Holdings, S.A., through its subsidiaries, provides airline passenger and cargo transport services.
The above weekly chart formed an approximately 30-month-long cup & handle chart pattern as a bullish continuation after an uptrend.
The horizontal boundary at 121.67 levels acts as a resistance within this pattern.
A daily close above 125.3 levels would validate the breakout from the 30-month-long cup & handle chart pattern.
Based on this chart pattern, the potential price target is 185 levels.
CPA, classified under the “industrials” sector, falls under the “Mid Cap - Value” stock category.