


NextNav Inc.-(NN/NASDAQ)-Long Idea
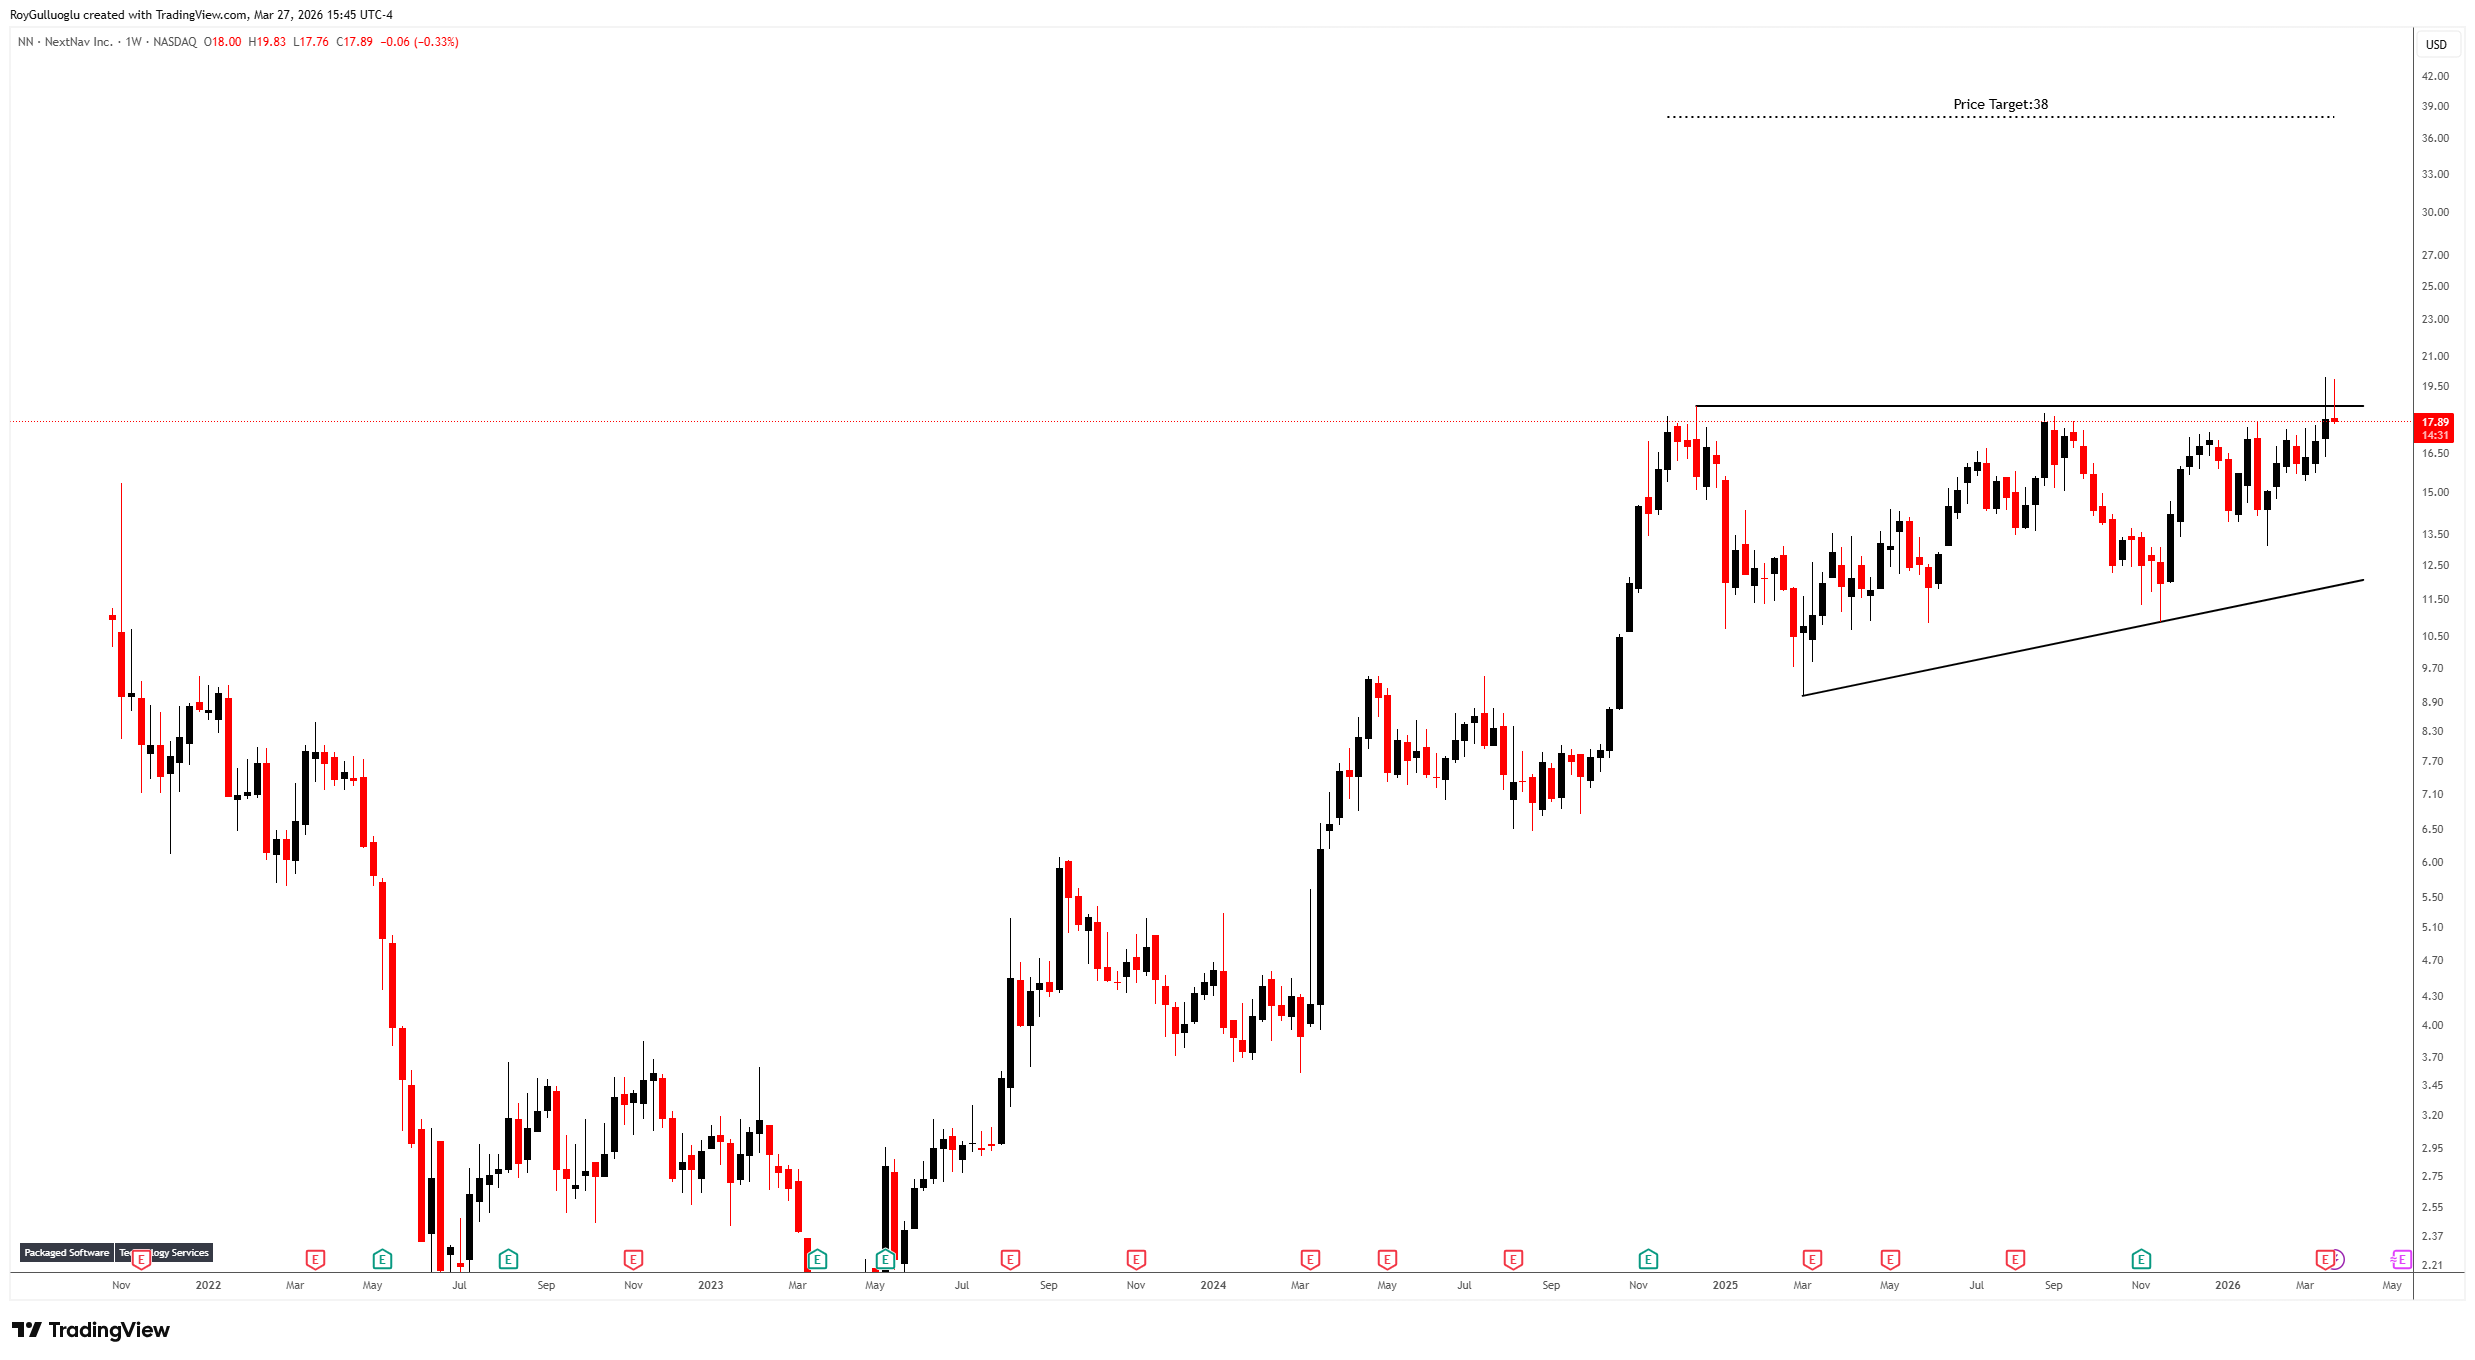
NextNav Inc. provides positioning, navigation, and timing (PNT) solutions in the United States.
The above weekly chart formed an approximately 16-month-long ascending triangle chart pattern as a bullish reversal after a downtrend.
The horizontal boundary at 18.54 levels acts as a resistance within this pattern.
A daily close above 19 levels would validate the breakout from the 16-month-long ascending triangle chart pattern.
Based on this chart pattern, the potential price target is 38 levels.
Restaurant Brands International Inc. -(QSR/NYSE)-Long Idea
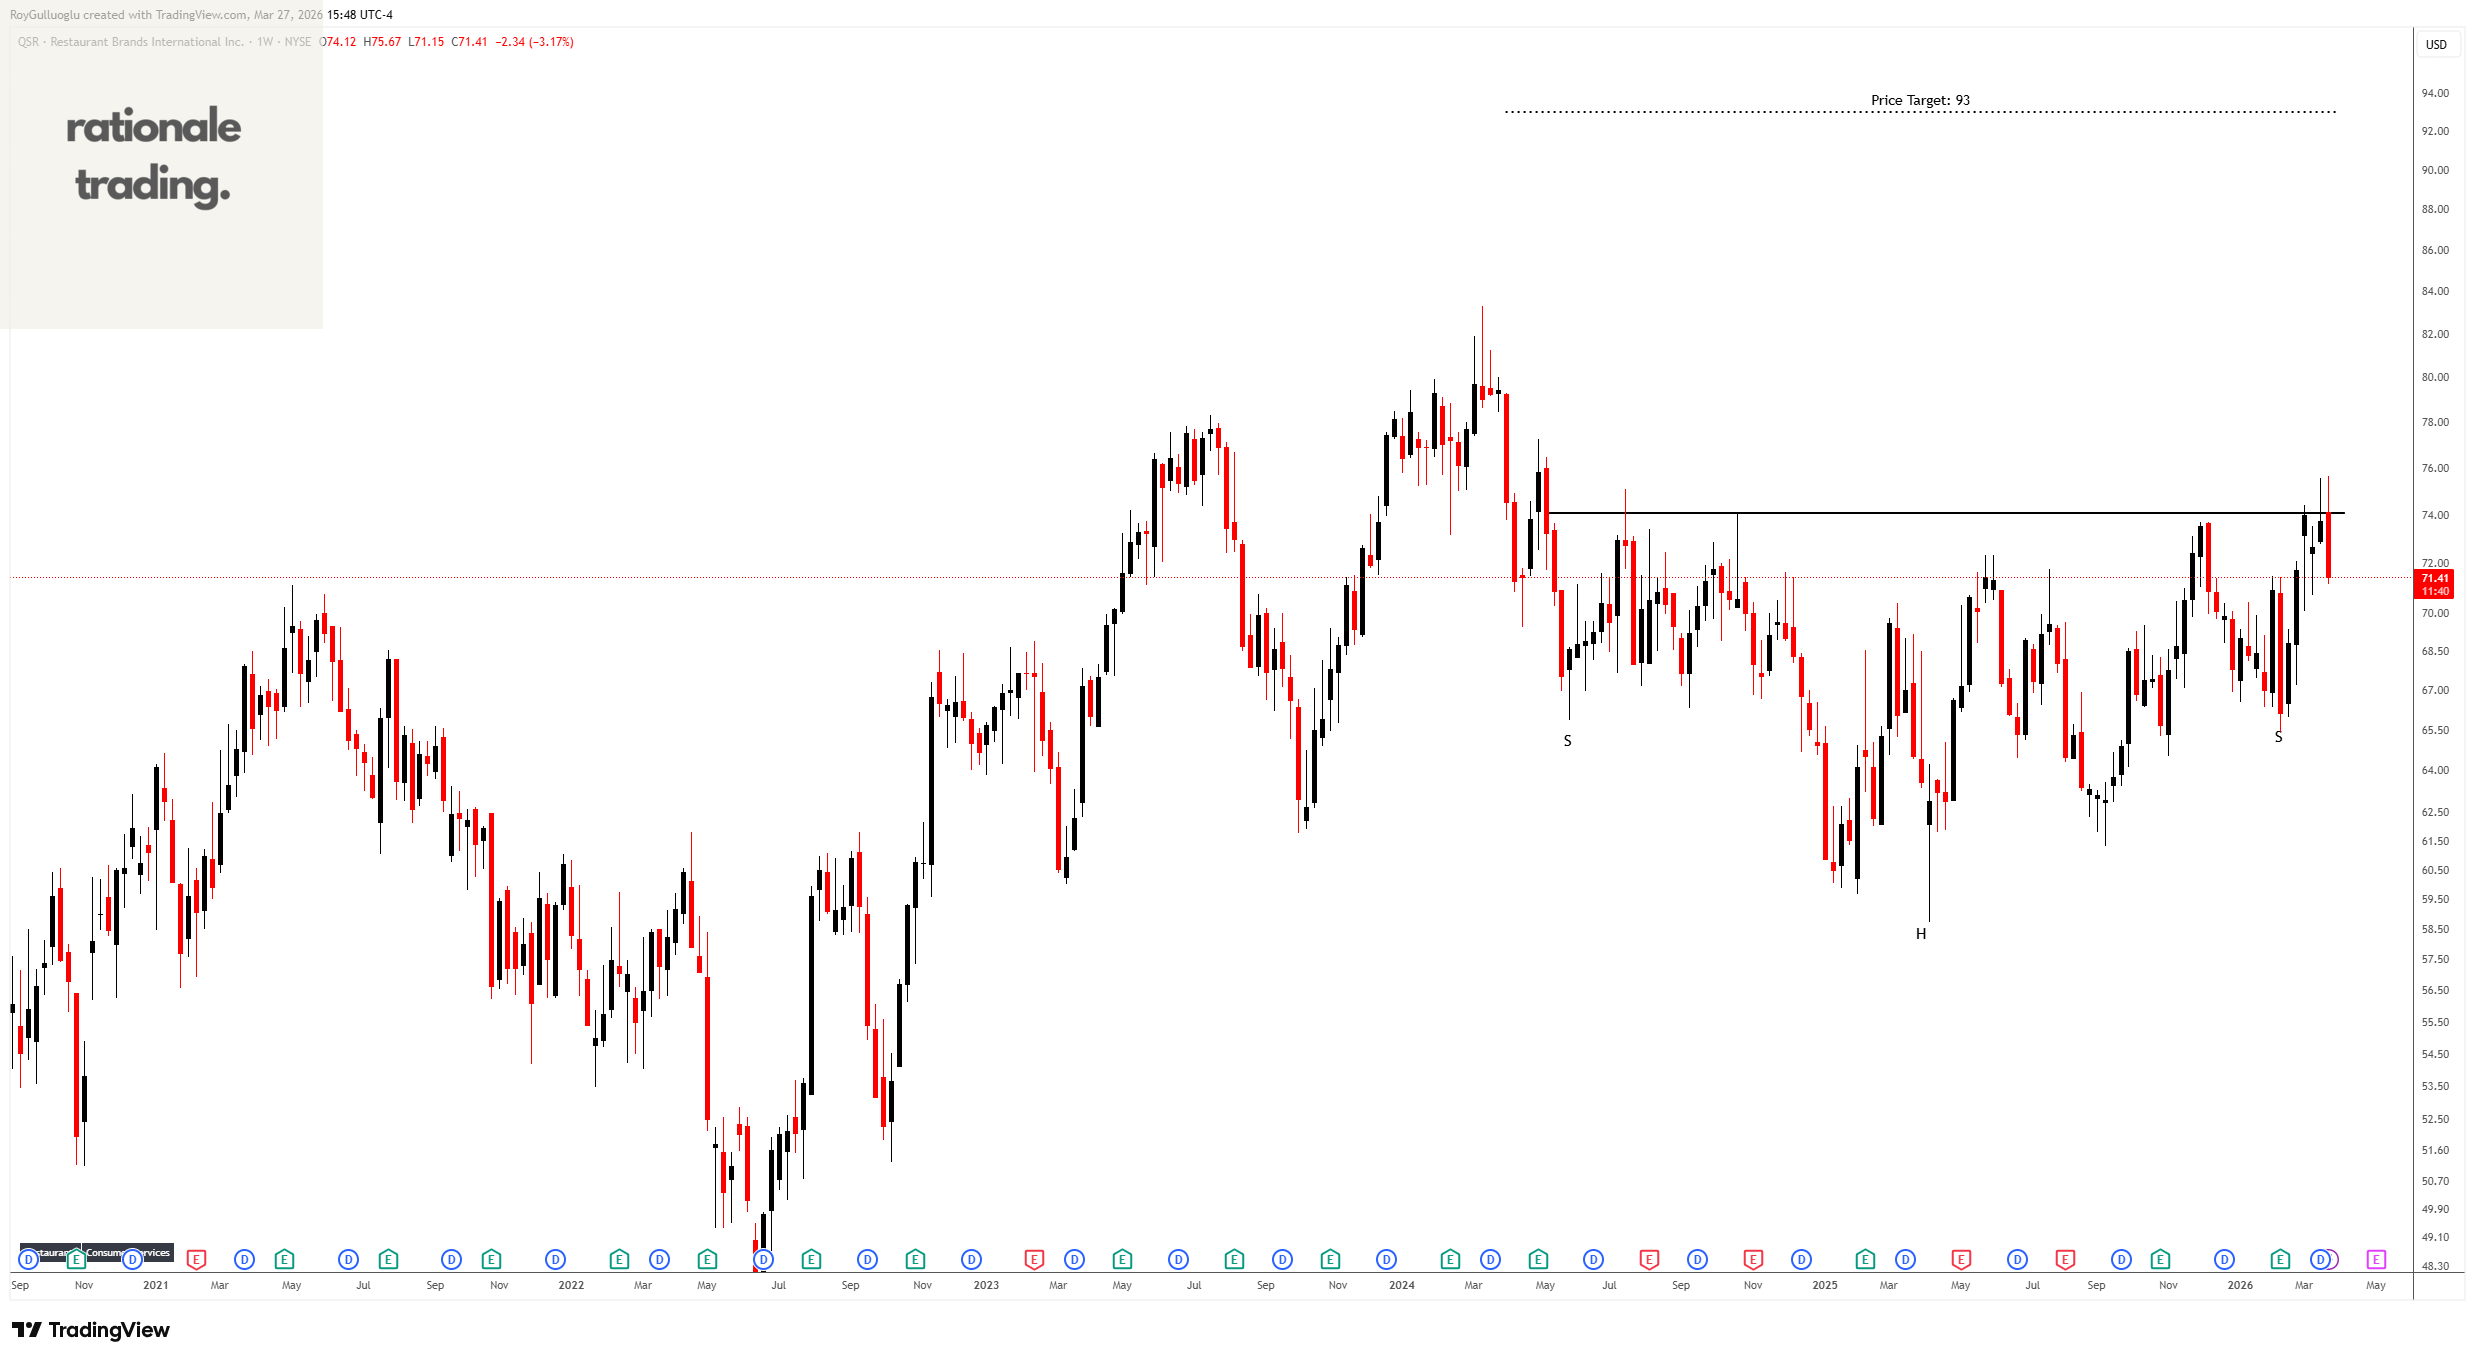
Restaurant Brands International Inc. operates as a quick service restaurant company in Canada, the United States, and internationally.
The above weekly chart formed an approximately 24-month-long H&S bottom chart pattern as a bullish reversal after a downtrend.
The horizontal boundary at 74 levels acts as a resistance within this pattern.
A daily close above 76.2 levels would validate the breakout from the 24-month-long H&S bottom chart pattern.
Based on this chart pattern, the potential price target is 93 levels.
OneSpaWorld Holdings Limited-(OSW/NASDAQ)-Long Idea
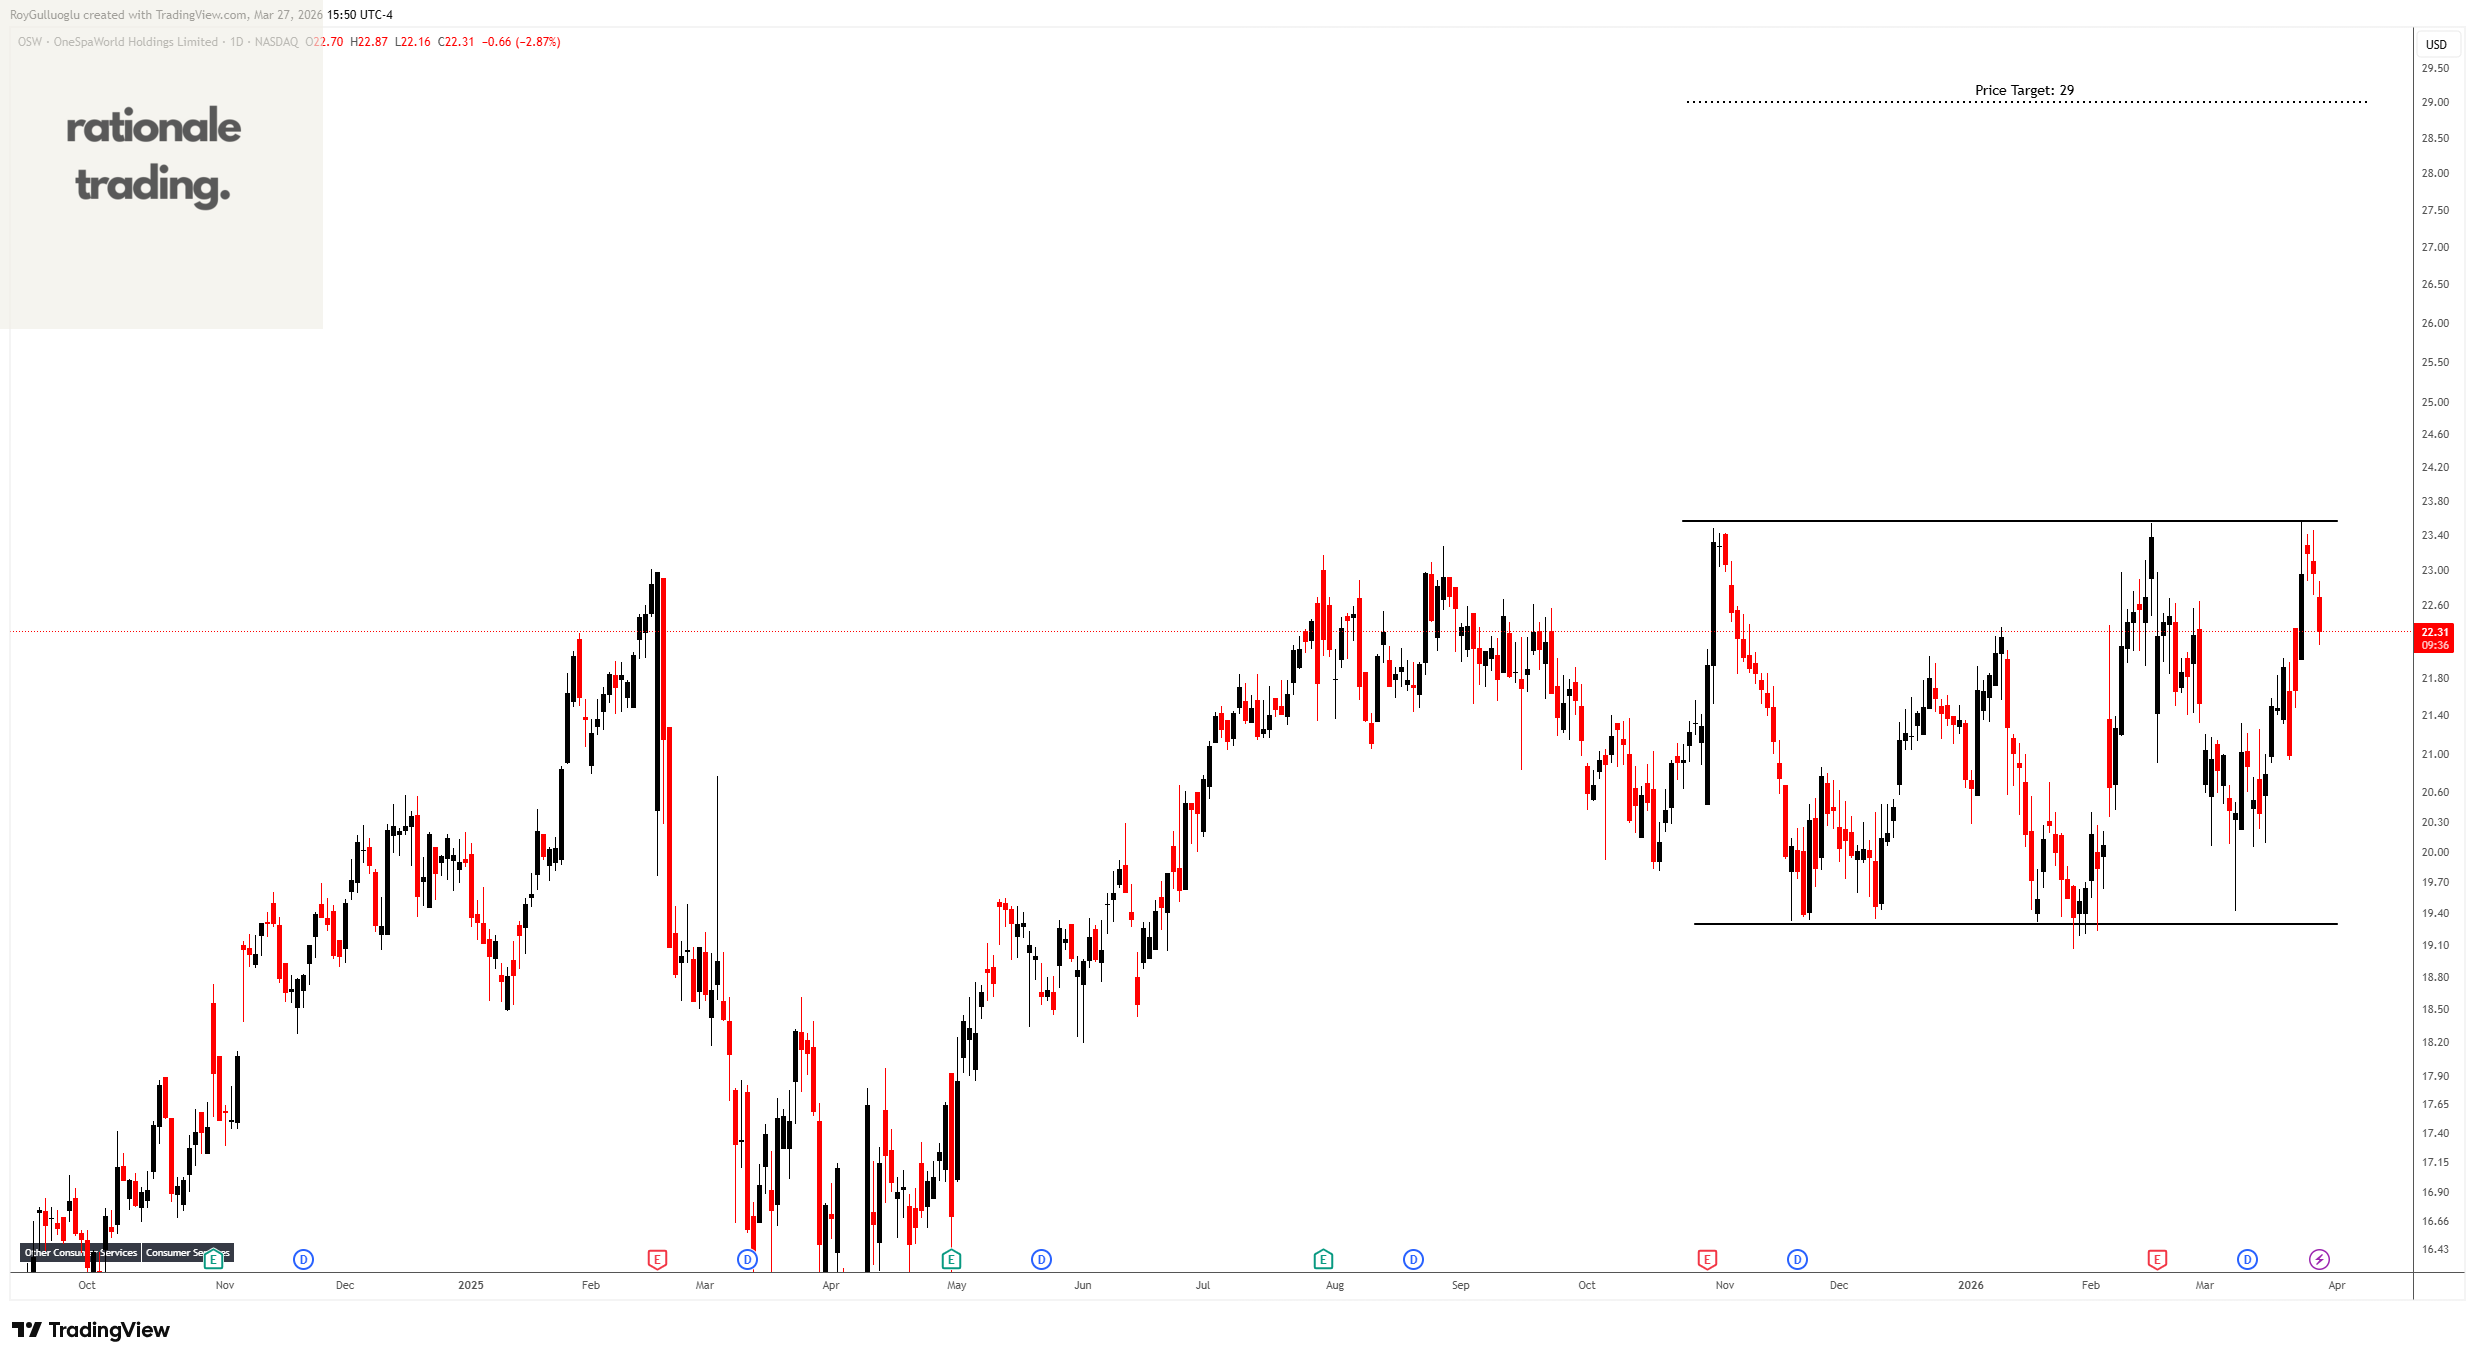
OneSpaWorld Holdings Limited operates health and wellness centers onboard cruise ships and at destination resorts in the United States and internationally.
The above daily chart formed an approximately 3-month-long rectangle chart pattern as a bullish reversal after a downtrend.
The horizontal boundary at 23.56 levels acts as a resistance within this pattern.
A daily close above 24.25 levels would validate the breakout from the 3-month-long rectangle chart pattern.
Based on this chart pattern, the potential price target is 29 levels.
Intuitive Machines, Inc.-(LUNR/NASDAQ)-Long Idea
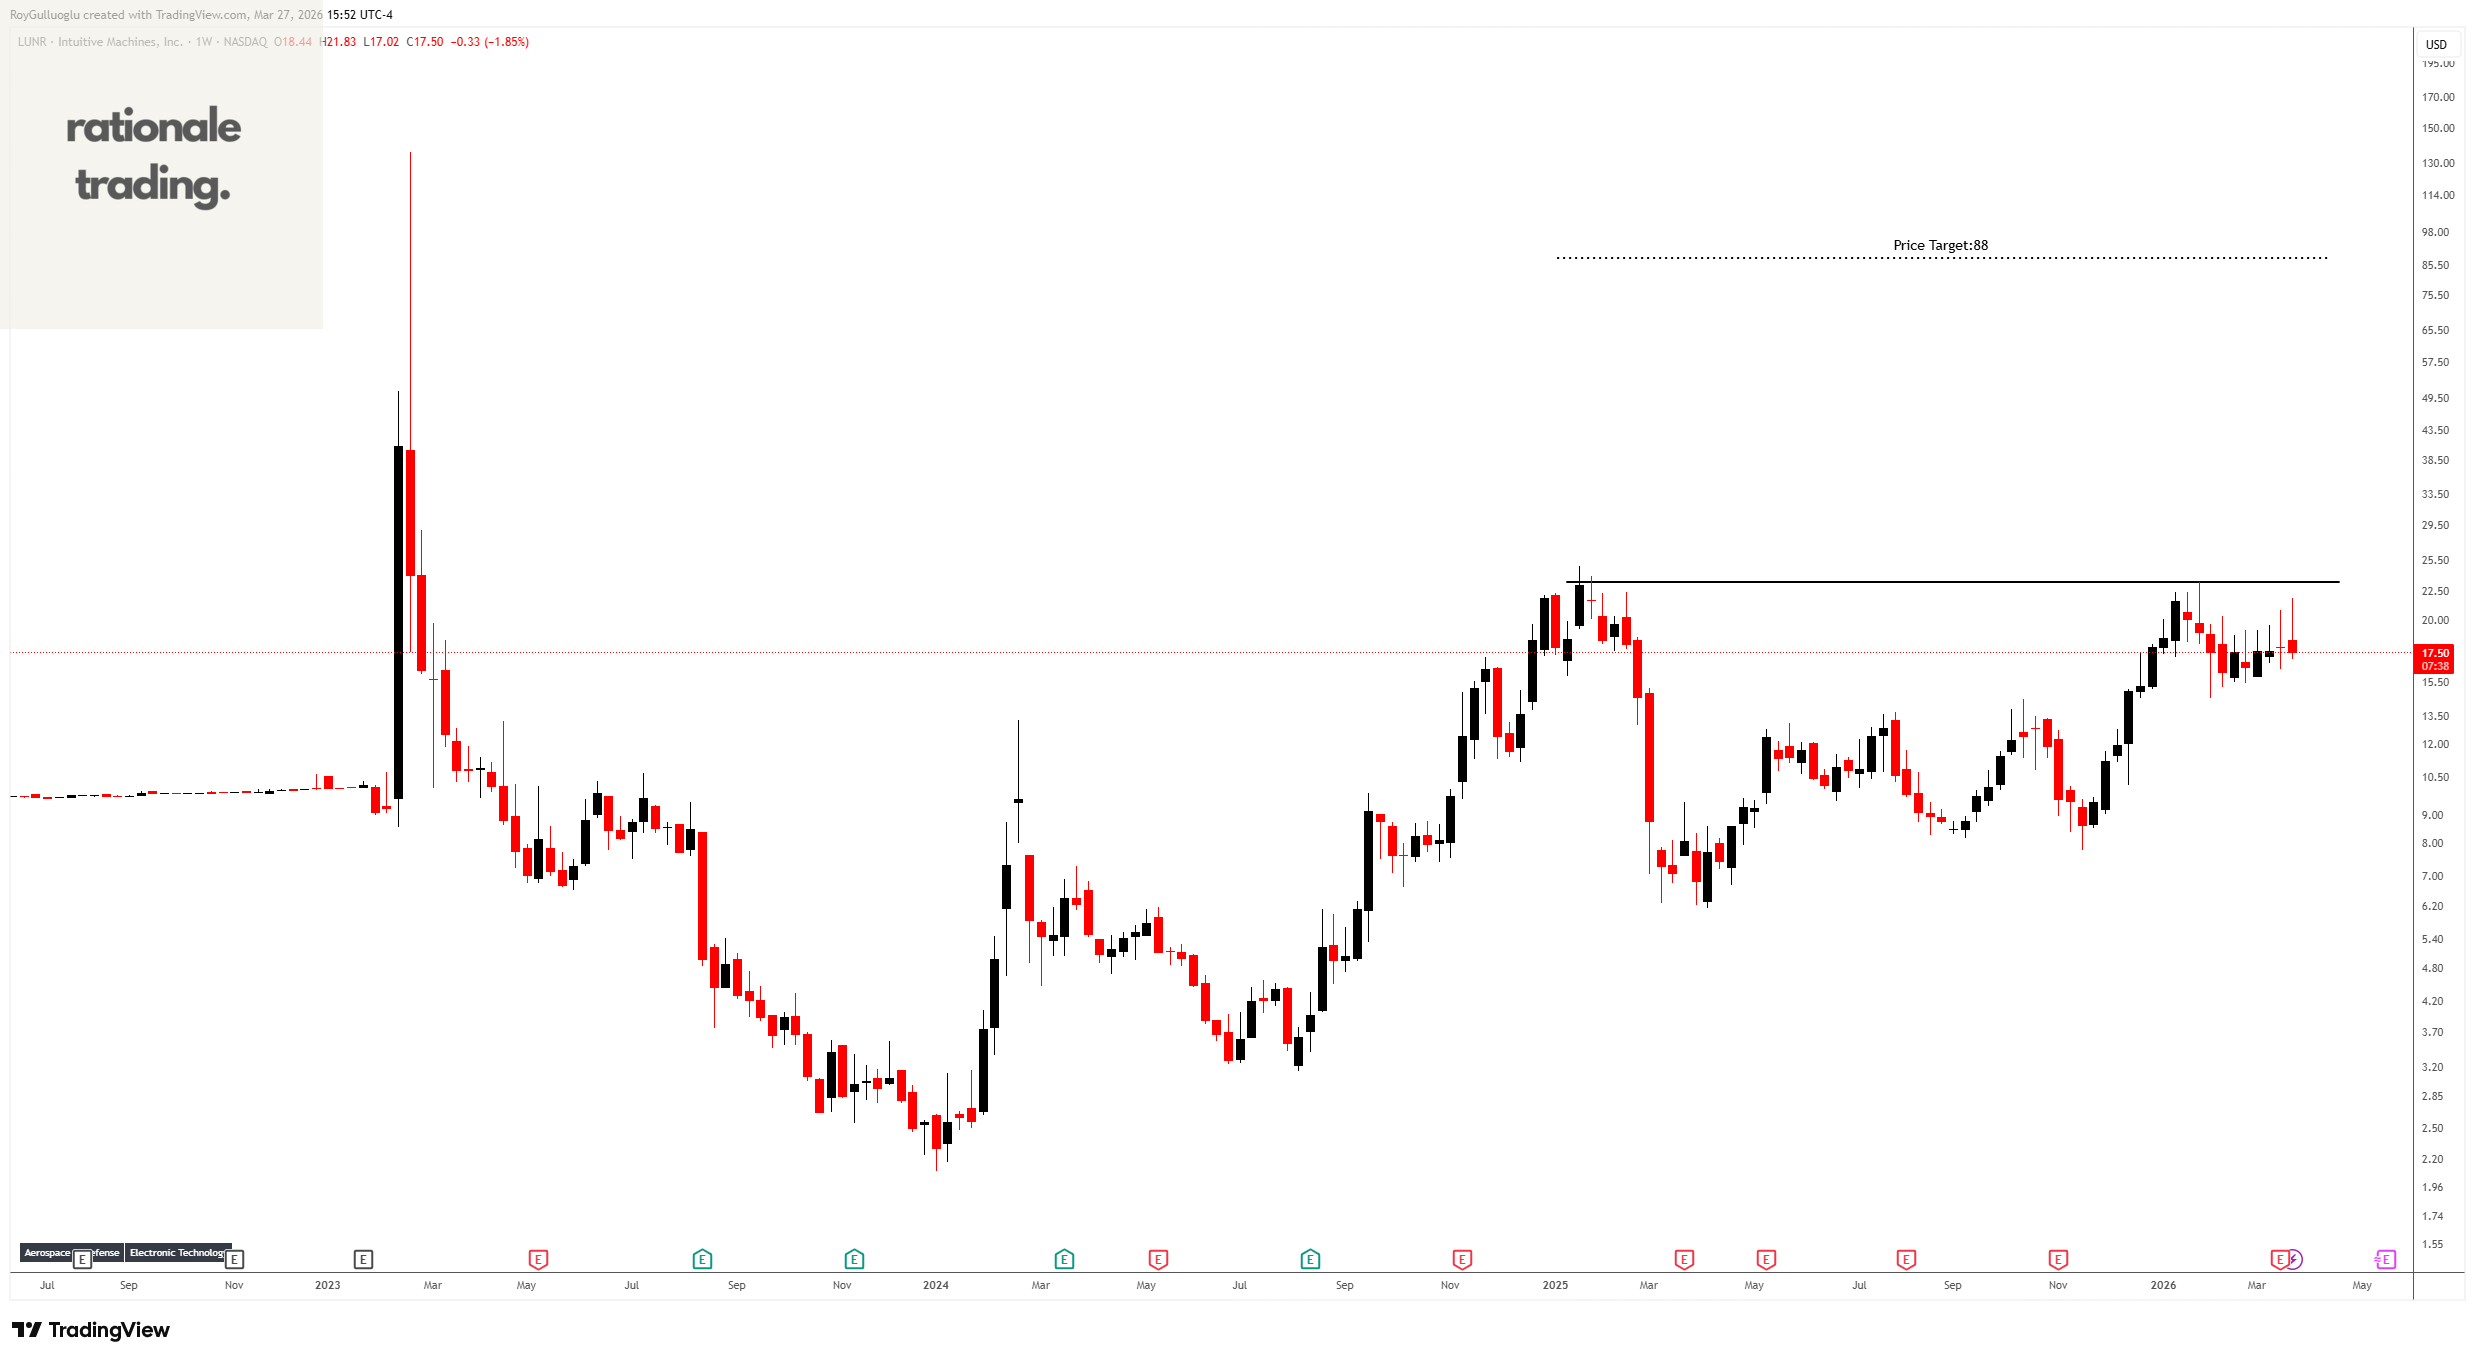
Intuitive Machines, Inc. operates as a space infrastructure and services company in the United States.
The above weekly chart formed an approximately 15-month-long cup & handle chart pattern as a bullish reversal after a downtrend.
The horizontal boundary at 23.32 levels acts as a support within this pattern.
A daily close above 24 levels would validate the breakout from the 15-month-long cup & handle chart pattern.
Based on this chart pattern, the potential price target is 88 levels.
Pharvaris N.V.-(PHVS/NASDAQ)-Long Idea
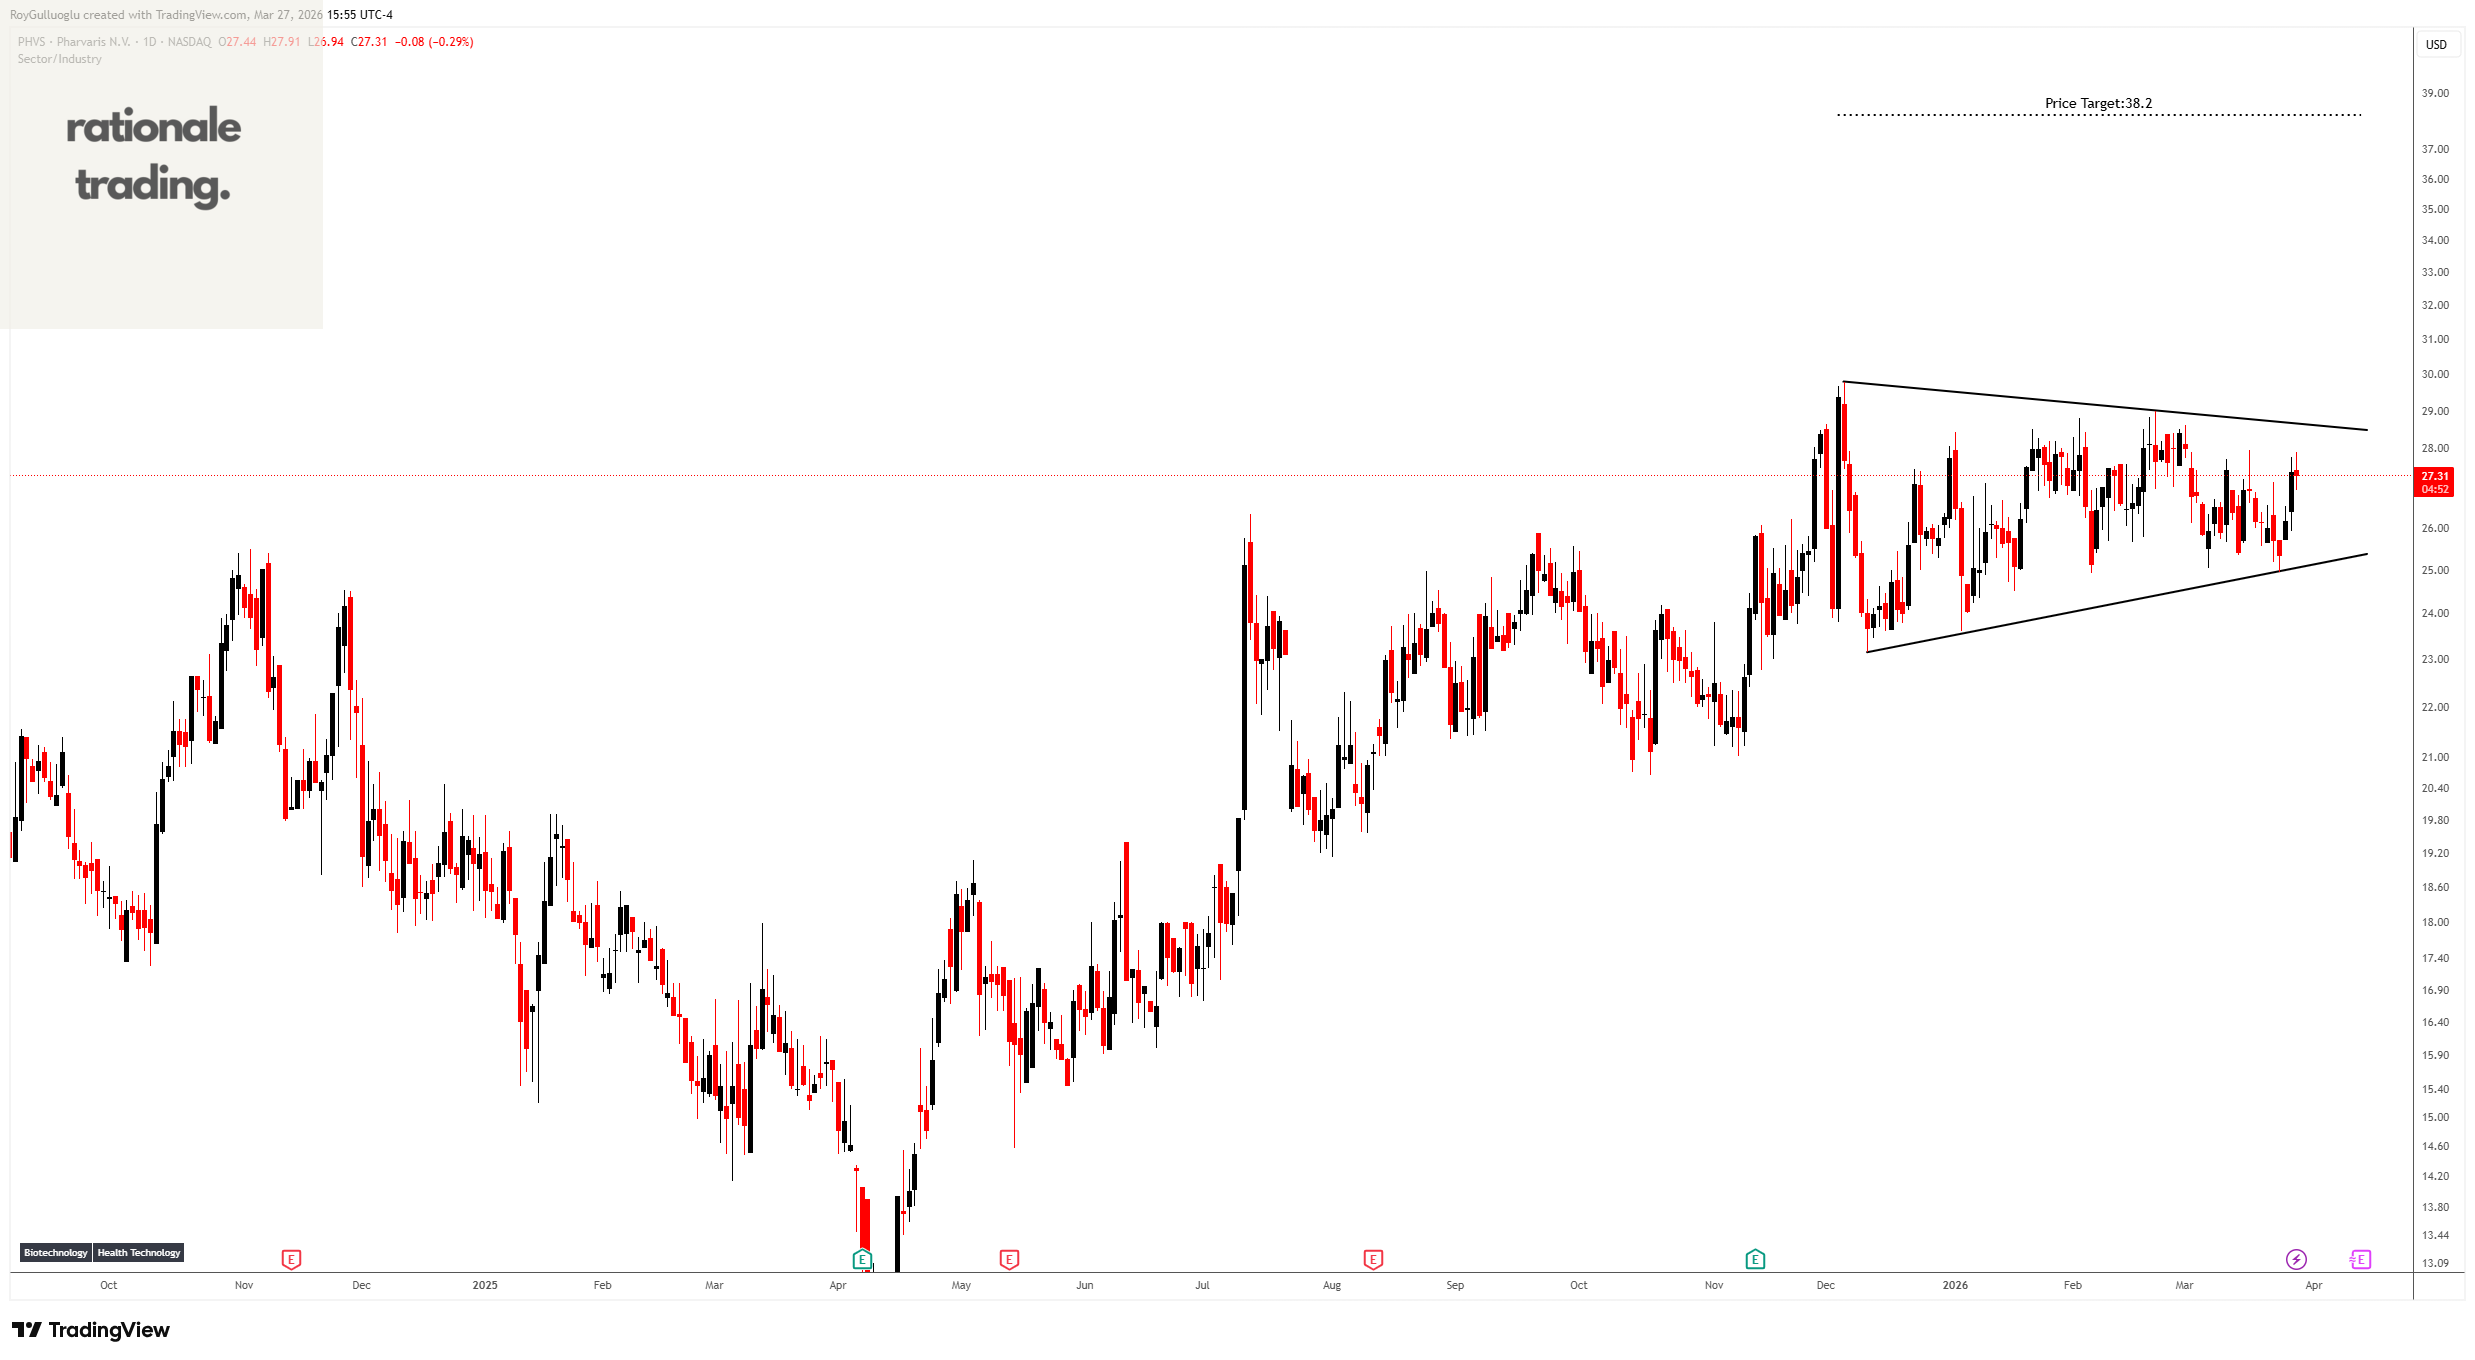
Pharvaris N.V., a late-stage biopharmaceutical company, focuses on the development and commercialization of therapies for rare diseases with unmet needs covering angioedema and other bradykinin-mediated diseases.
The above daily chart formed an approximately 3-month-long symmetrical triangle chart pattern as a bullish continuation after an uptrend.
A daily close above 29.87 levels would validate the breakout from the 3-month-long rectangle chart pattern.
Based on this chart pattern, the potential price target is 38.2 levels.
Teşekkürler Roy