


Ubiquiti Inc.-(UI/NYSE)-Long Idea
Ubiquiti Inc. develops networking technology for service providers, enterprises, and consumers.
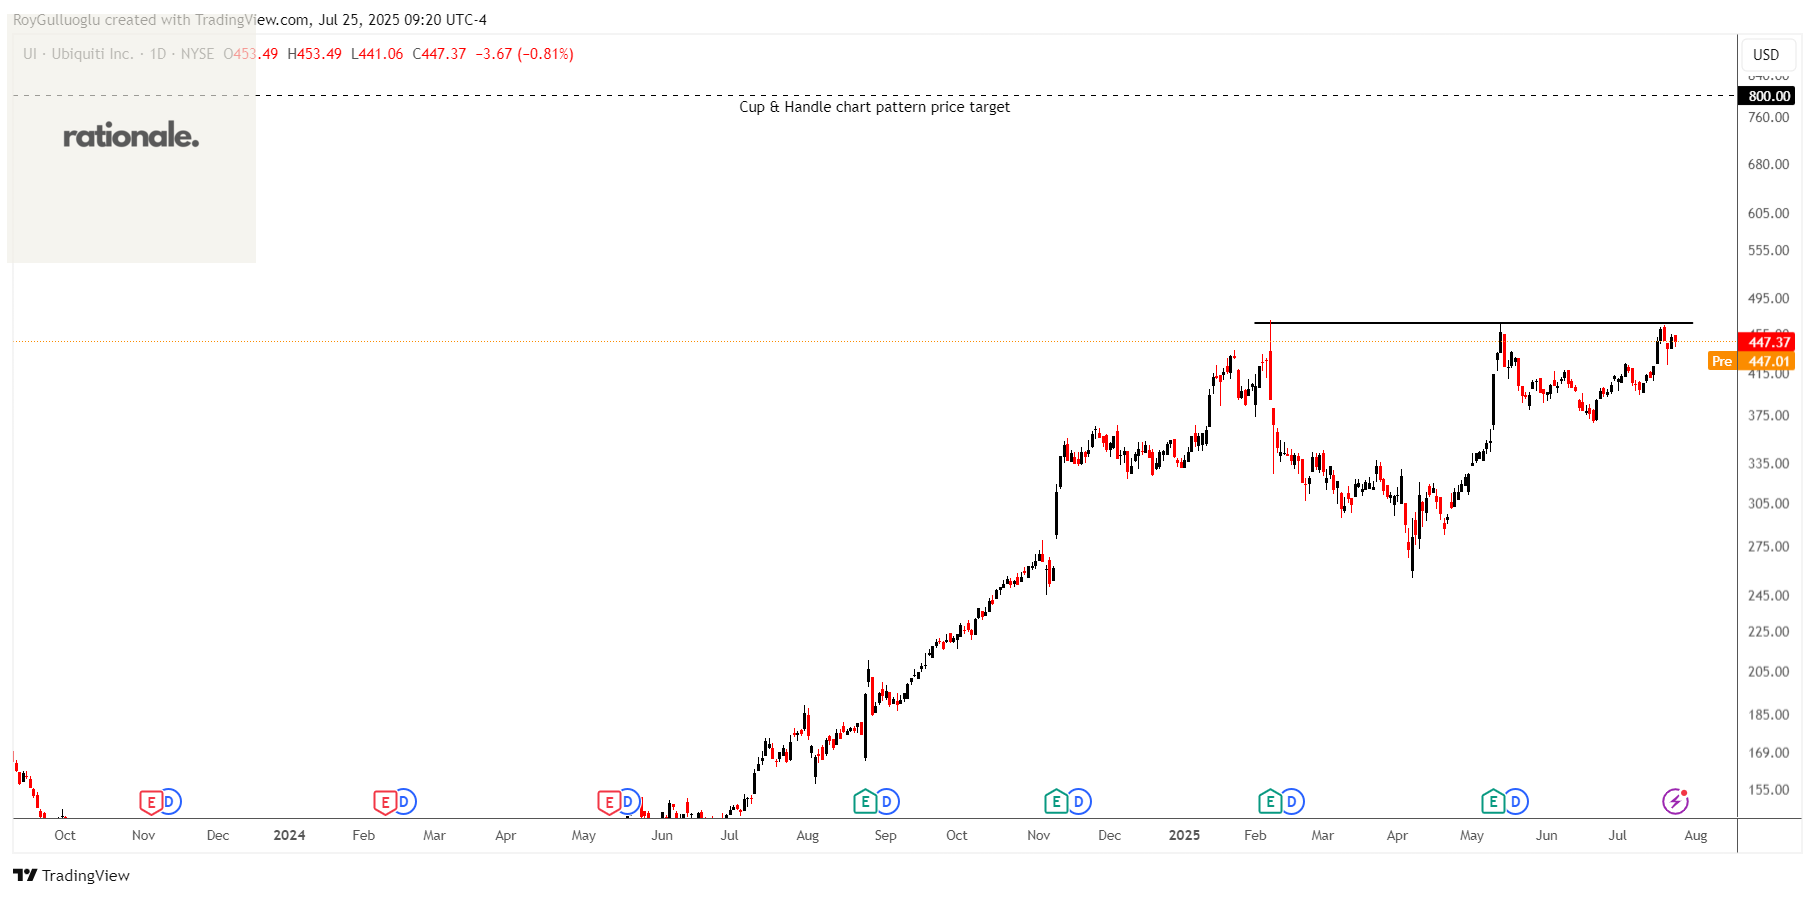
The above daily chart formed an approximately 4-month-long cup & handle chart pattern as a bullish continuation after a downtrend.
The horizontal boundary at 466.8 levels acts as a resistance within this pattern.
A daily close above 480.8 levels would validate the breakout from the 4-month-long Cup & Handle chart pattern.
Based on this chart pattern, the potential price target is 800 levels.
UI, classified under the "technology" sector, falls under the “Large Cap - Growth” stock category.
Genuine Parts Company-(GPC/NYSE)-Long Idea
Genuine Parts Company distributes automotive and industrial replacement parts. It operates in two segments, Automotive Parts Group and Industrial Parts Group.
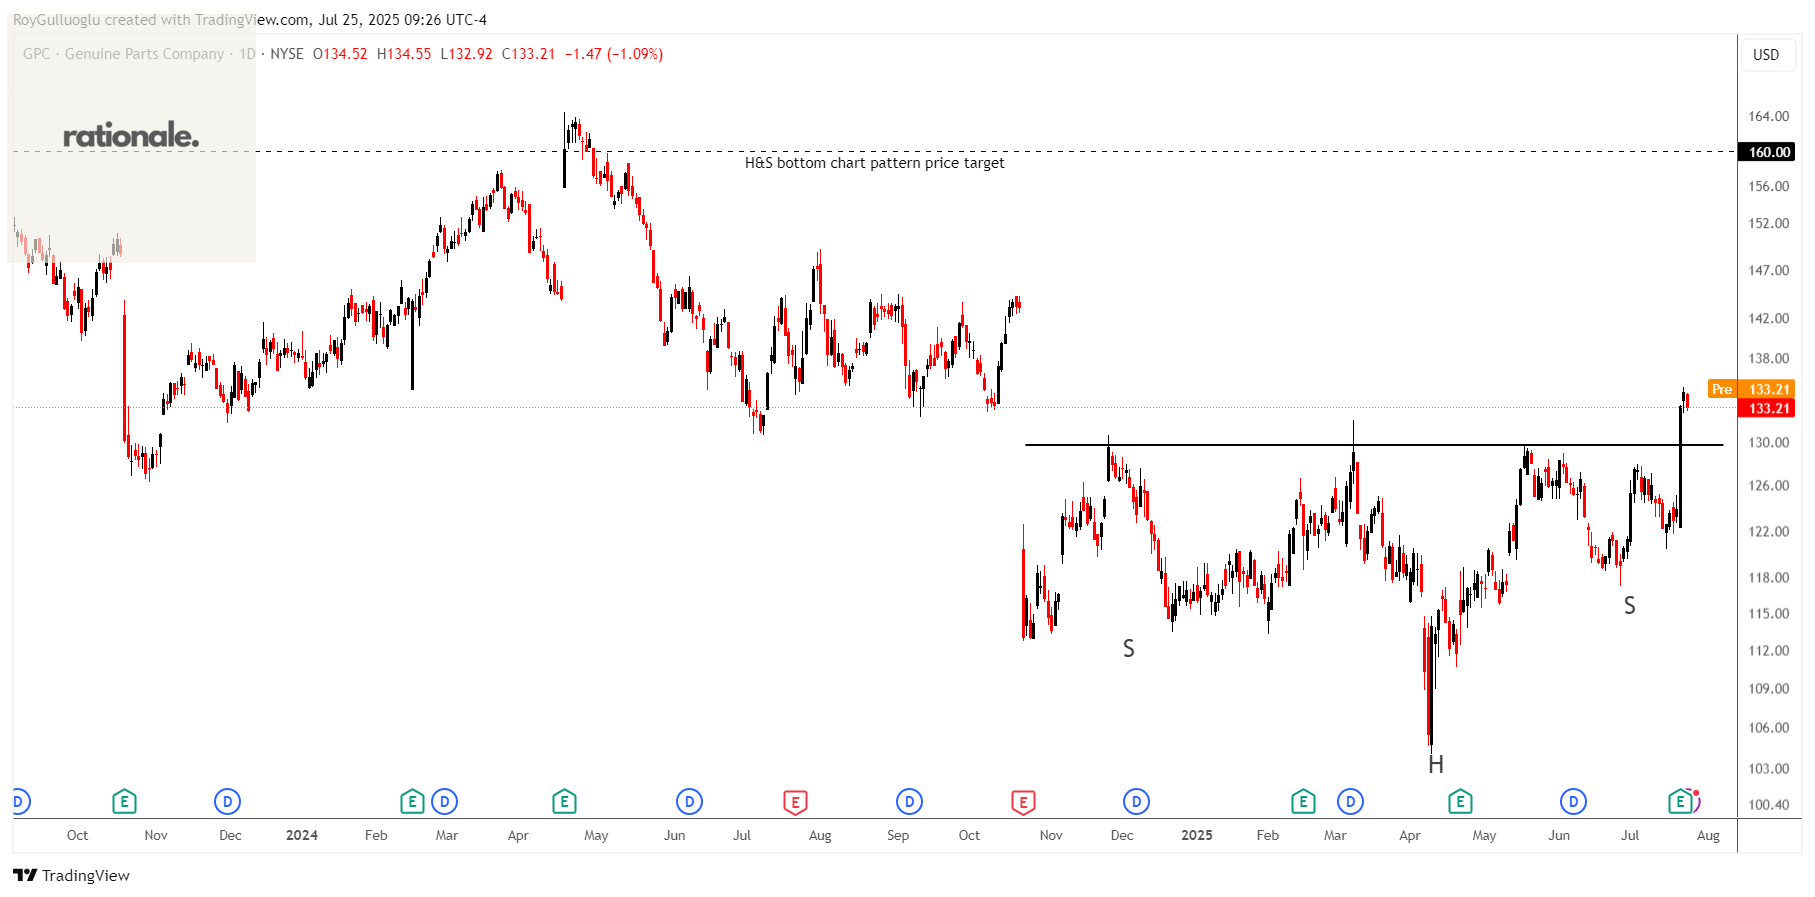
The above daily chart formed an approximately 6-month-long H&S bottom chart pattern as a bullish reversal after a downtrend.
The horizontal boundary at 129.69 levels acted as a resistance within this pattern.
A daily close above 133.5 levels validated the breakout from the 6-month-long H&S bottom chart pattern.
Based on this chart pattern, the potential price target is 160 levels.
GPC, classified under the "consumer cyclicals" sector, falls under the “Large Cap - Growth” stock category.
Merus N.V.-(MRUS/NASDAQ)-Long Idea
Merus N.V., a clinical-stage immuno-oncology company, engages in the development of antibody therapeutics in the Netherlands.
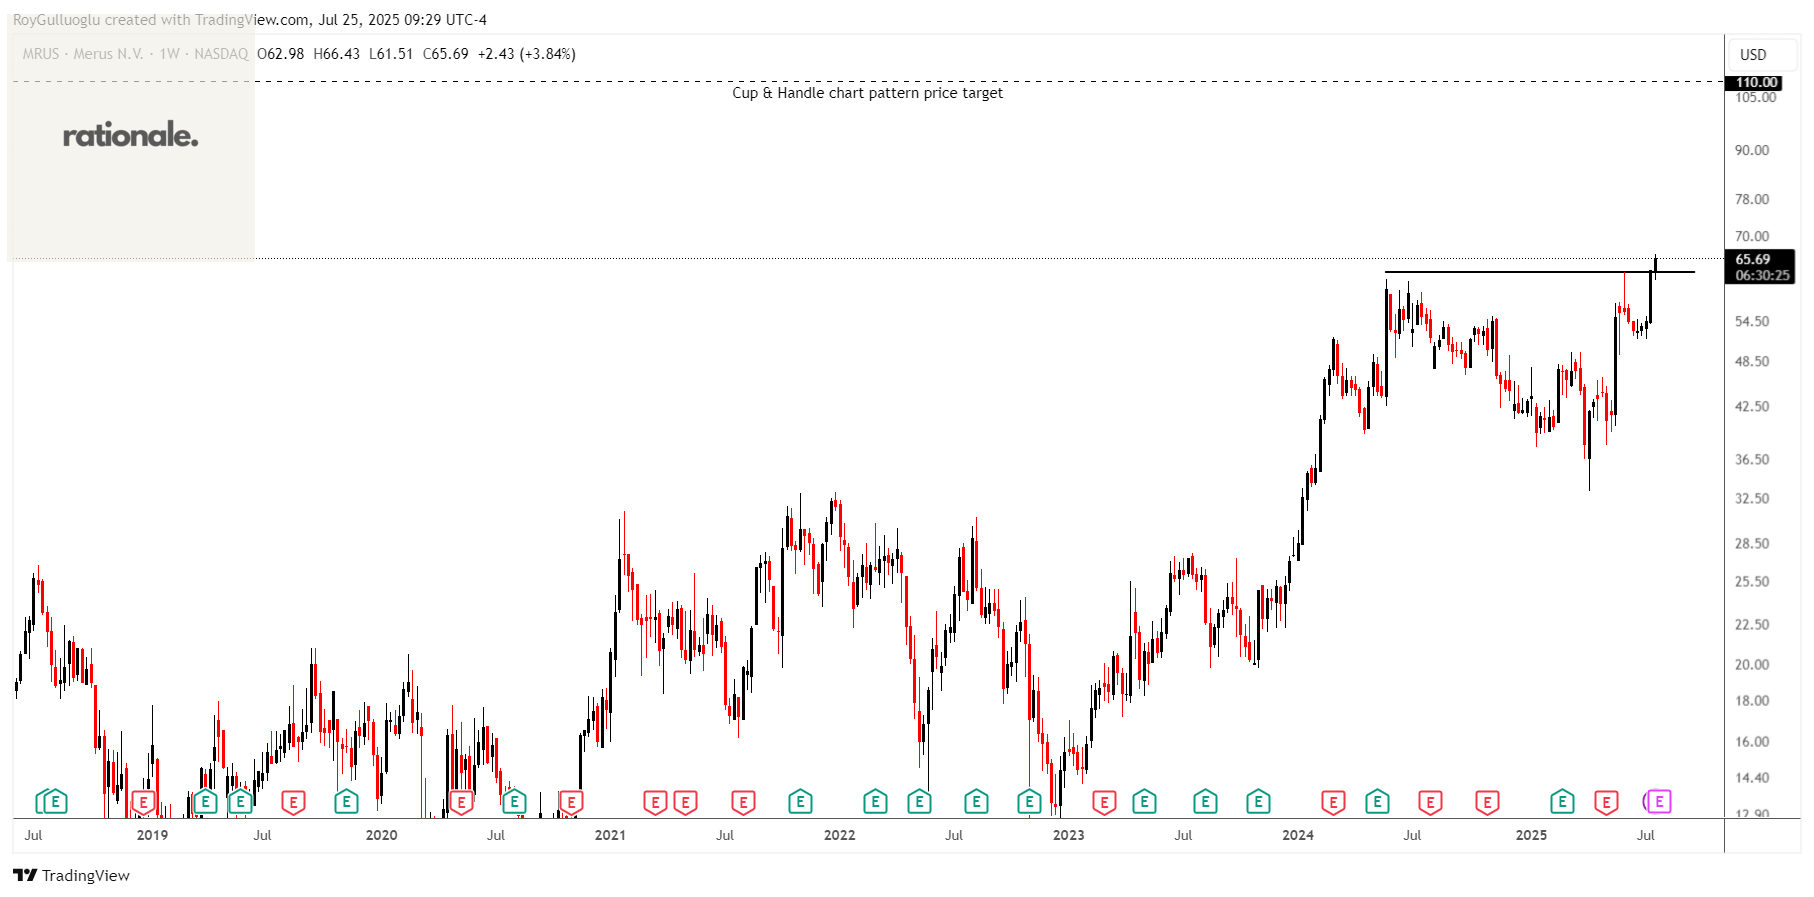
The above daily chart formed an approximately 10-month-long cup & handle chart pattern as a bullish continuation after an uptrend.
The horizontal boundary at 63 levels acted as a resistance within this pattern.
A daily close above 64.9 levels validated the breakout from the 3-month-long cup & handle chart pattern.
Based on this chart pattern, the potential price target is 110 levels.
MRUS, classified under the "healthcare" sector, falls under the “Mid Cap - Value” stock category.
Fox Factory Holding Corp.-(FOXF/NASDAQ)-Long Idea
Fox Factory Holding Corp. designs, engineers, manufactures, and markets performance-defining products and system worldwide.
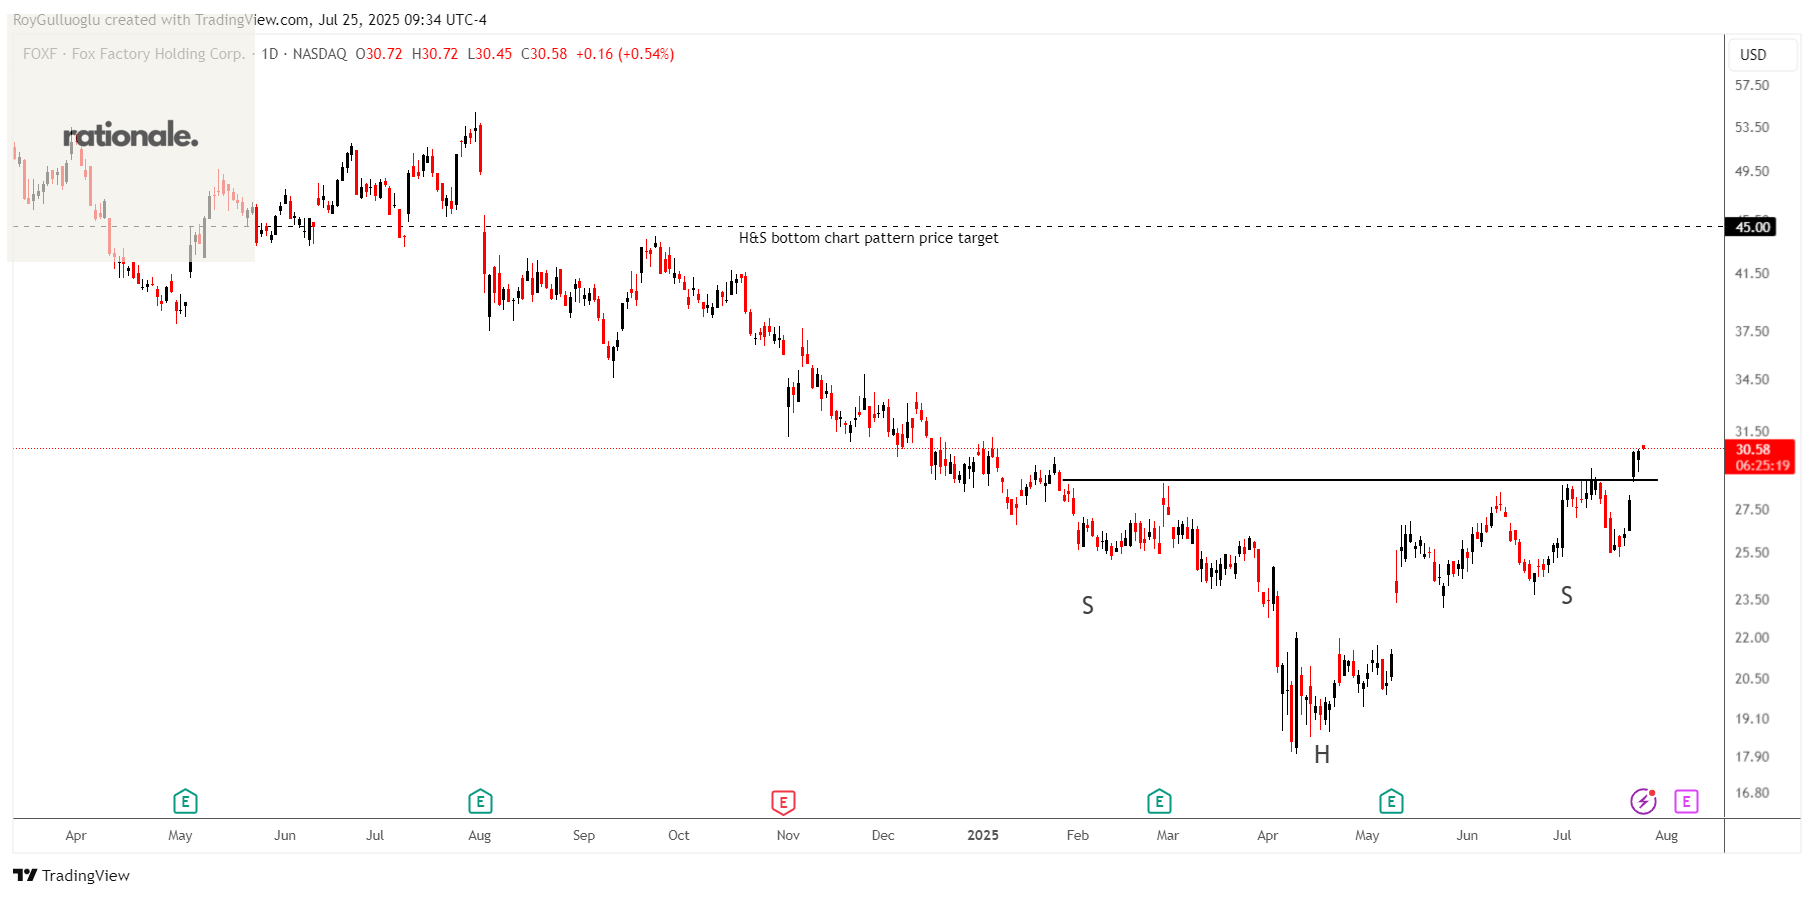
The above daily chart formed an approximately 4-month-long H&S bottom chart pattern as a bullish reversal after a downtrend.
The horizontal boundary at 28.9 levels acted as a resistance within this pattern.
A daily close above 29.75 levels validated the breakout from the 4-month-long H&S bottom chart pattern.
Based on this chart pattern, the potential price target is 45 levels.
FOXF, classified under the "consumer cyclical" sector, falls under the “Small Cap - Growth” stock category.
PR TIMES Corporation-(3922/TSE)-Long Idea
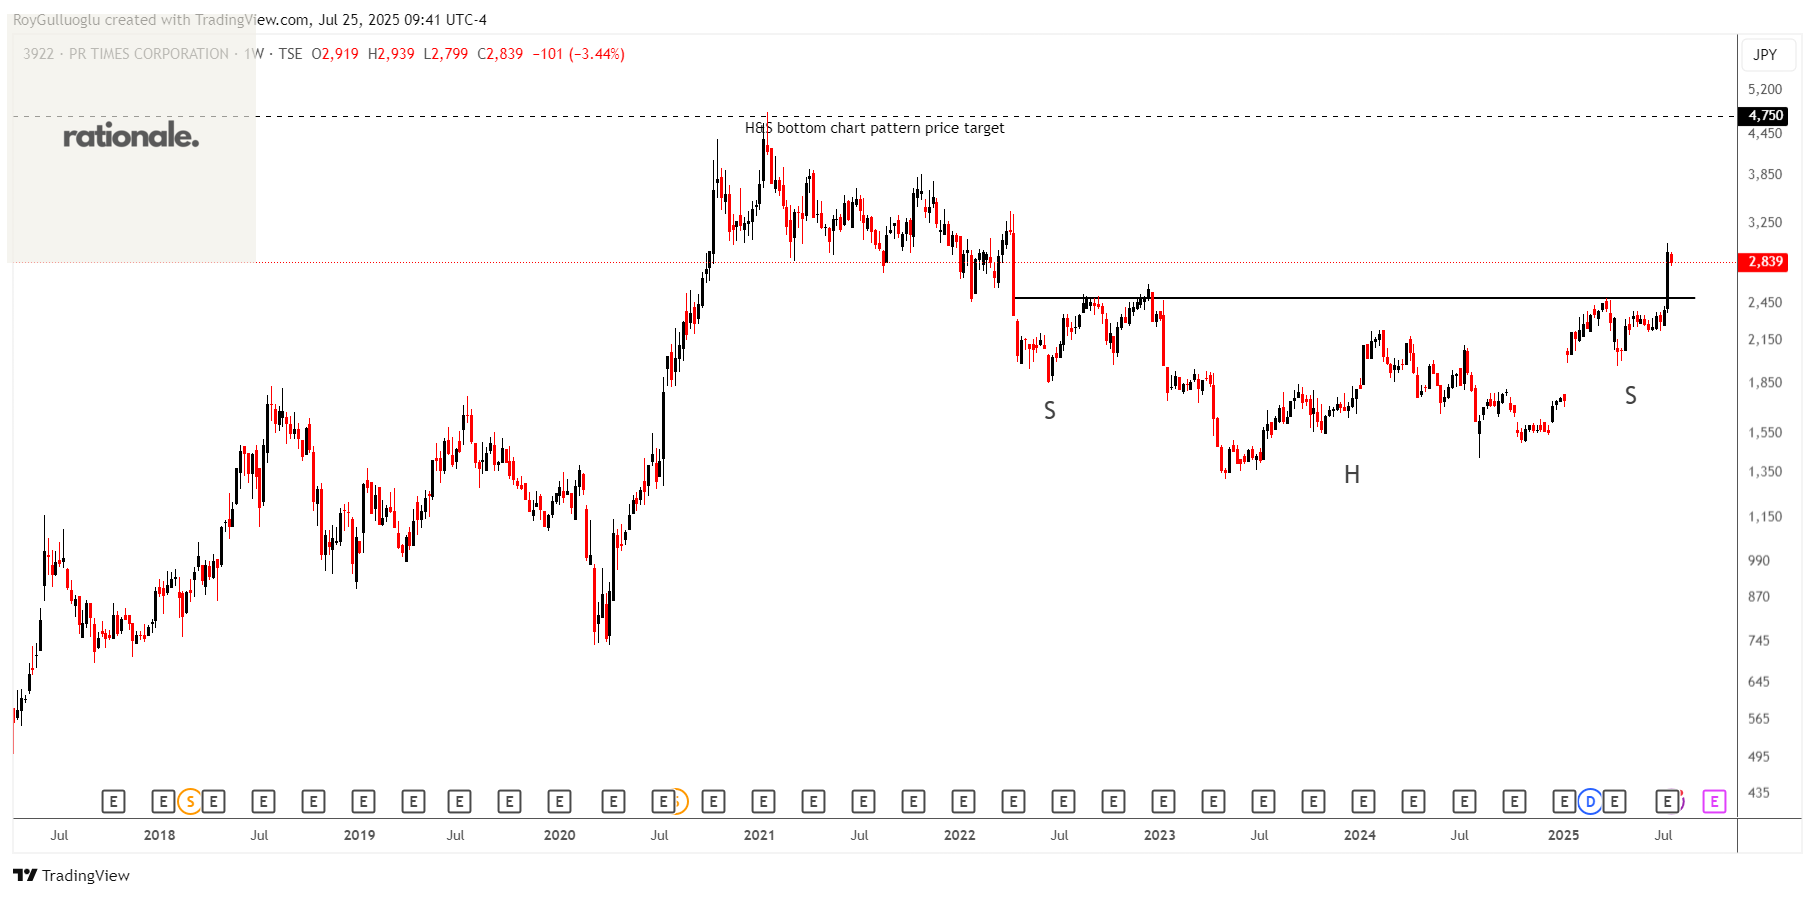
PR TIMES Corporation operates PR TIMES platform that connects companies, media, and consumers with news in Japan.
The above daily chart formed an approximately 5-month-long H&S bottom chart pattern as a bullish reversal after a downtrend.
The horizontal boundary at 2500 levels acted as a resistance within this pattern.
A daily close above 2575 levels validated the breakout from the 5-month-long H&S bottom chart pattern.
Based on this chart pattern, the potential price target is 4750 levels.
3922, classified under the "communication services" sector, falls under the “Small Cap - Growth” stock category.
Teşekkürler Roy