


Petkim Petrokimya Holding Anonim Sirketi-(PETKM/BIST)-Long Idea
Petkim Petrokimya Holding Anonim Sirketi operates as a petrochemical company in Turkey. It operates through the Petrochemical and Port segments.
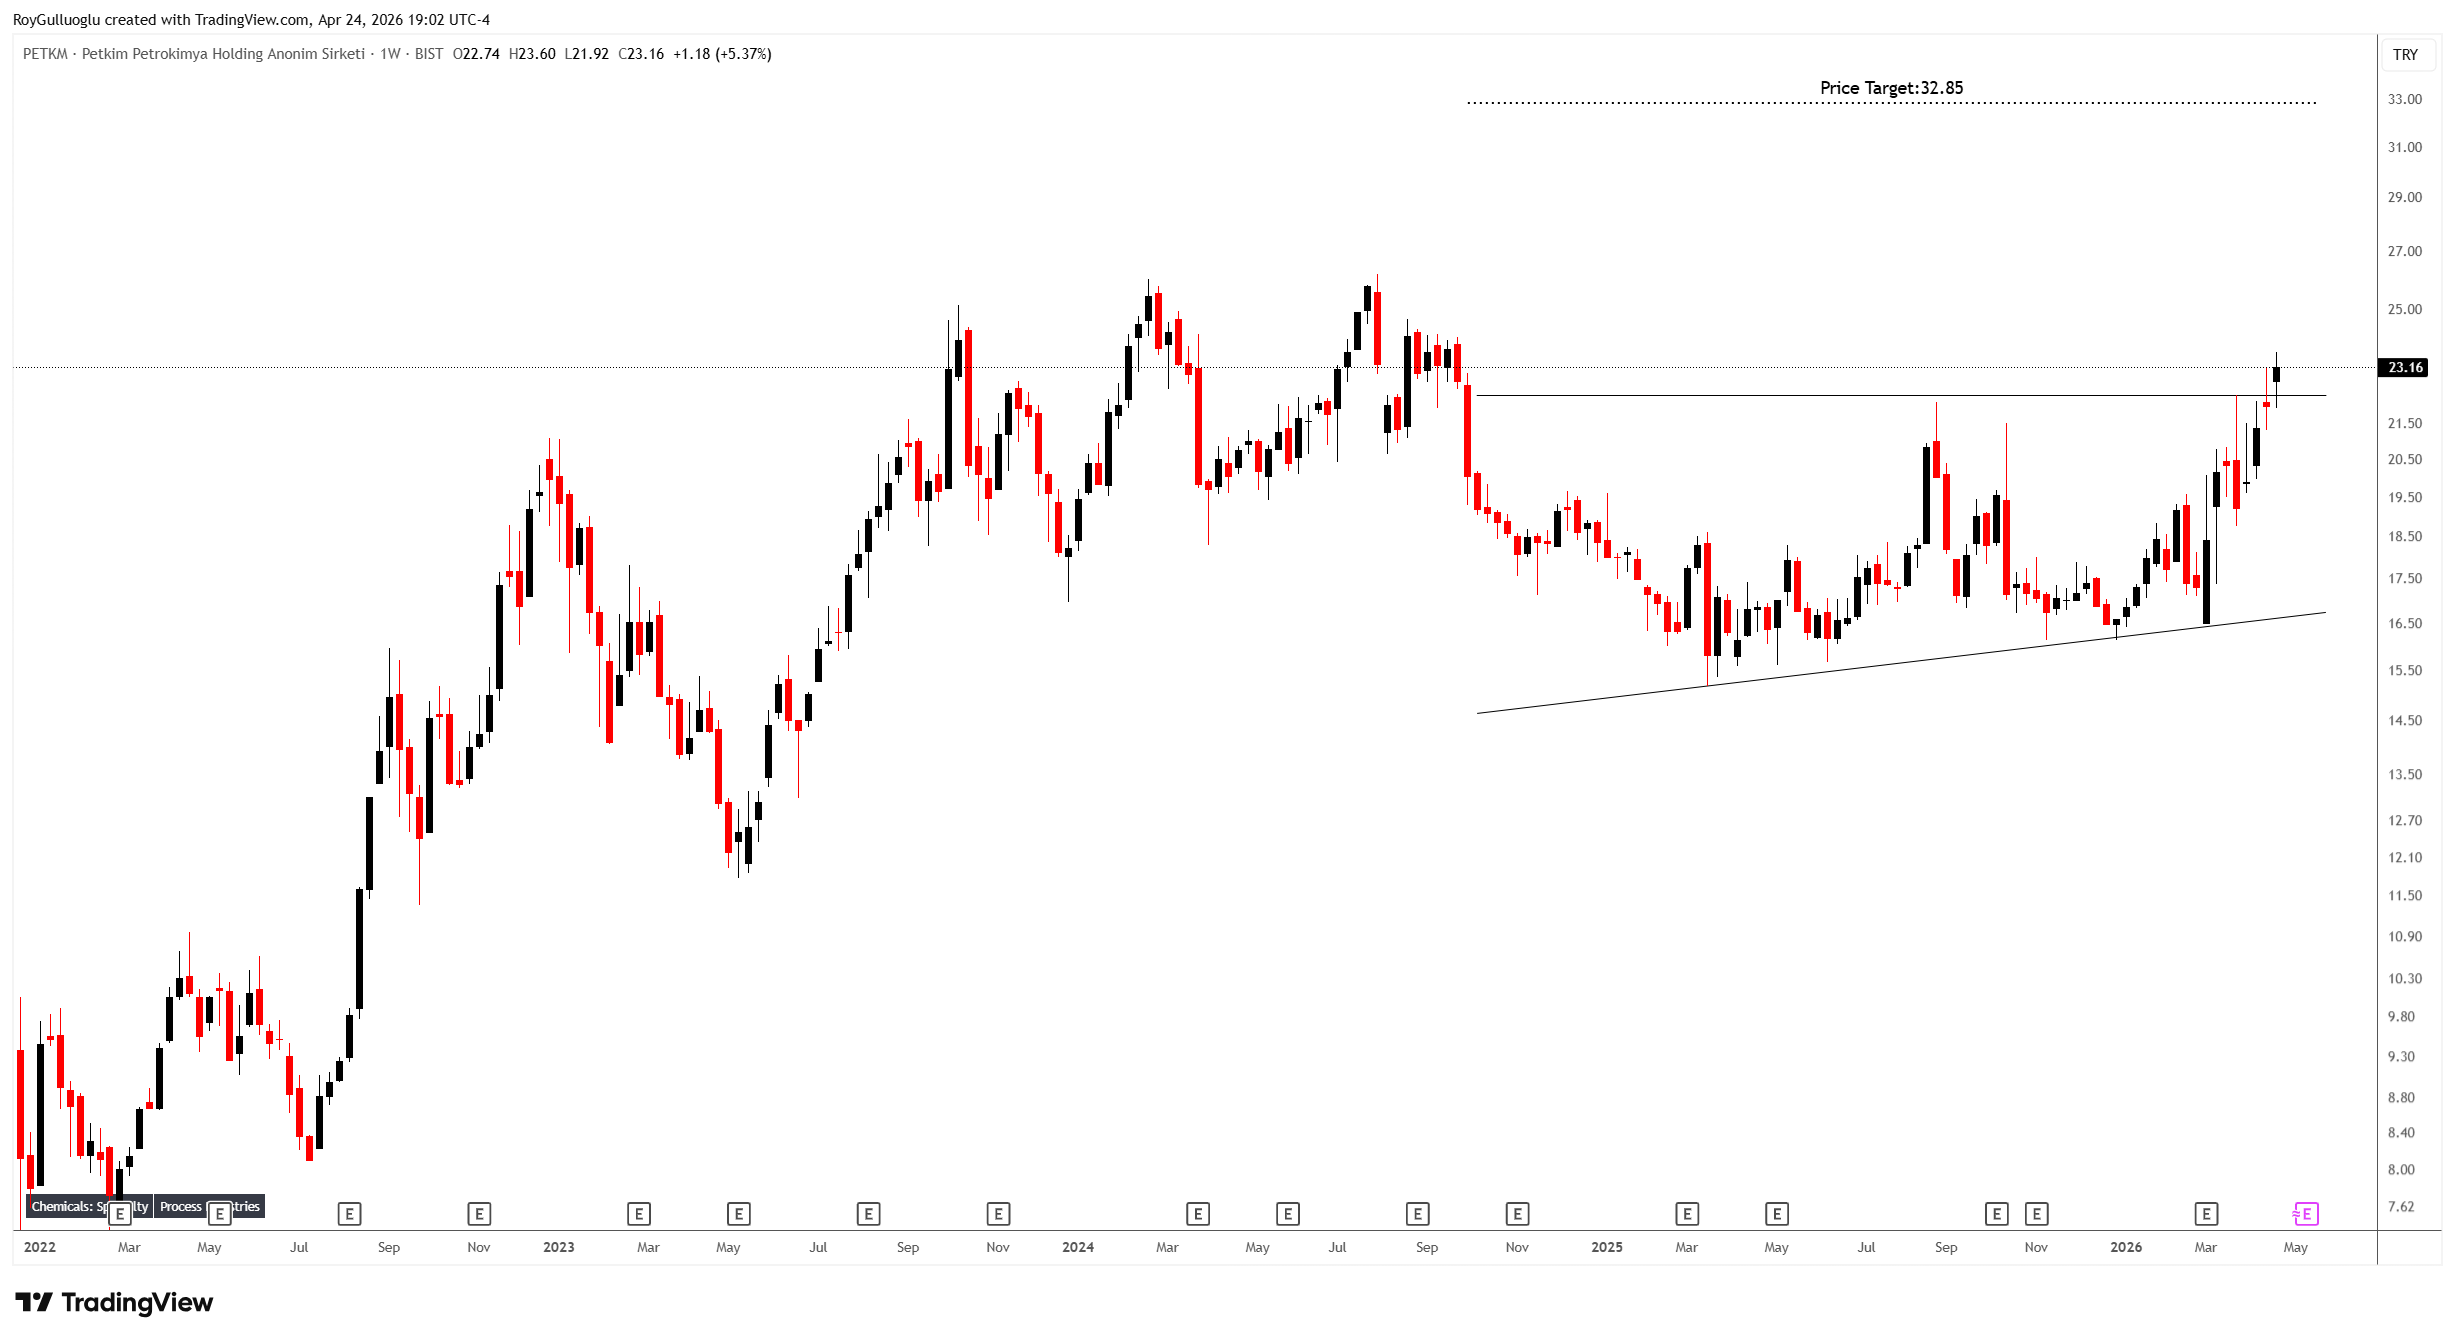
The above weekly chart formed an approximately 20-month-long ascending triangle chart pattern as a bullish reversal after a downtrend.
The horizontal boundary at 22.32 levels acted as a resistance within this pattern.
A daily close above 22.99 levels validated the breakout from the 20-month-long ascending triangle chart pattern.
Based on this chart pattern, the potential price target is 32.85 levels.
Napco Security Technologies, Inc.-(NSSC/NASDAQ)-Long Idea
Napco Security Technologies, Inc. engages in the development, manufacturing, and sale of electronic security systems for commercial, residential, institutional, industrial, and governmental applications in the United States and internationally.
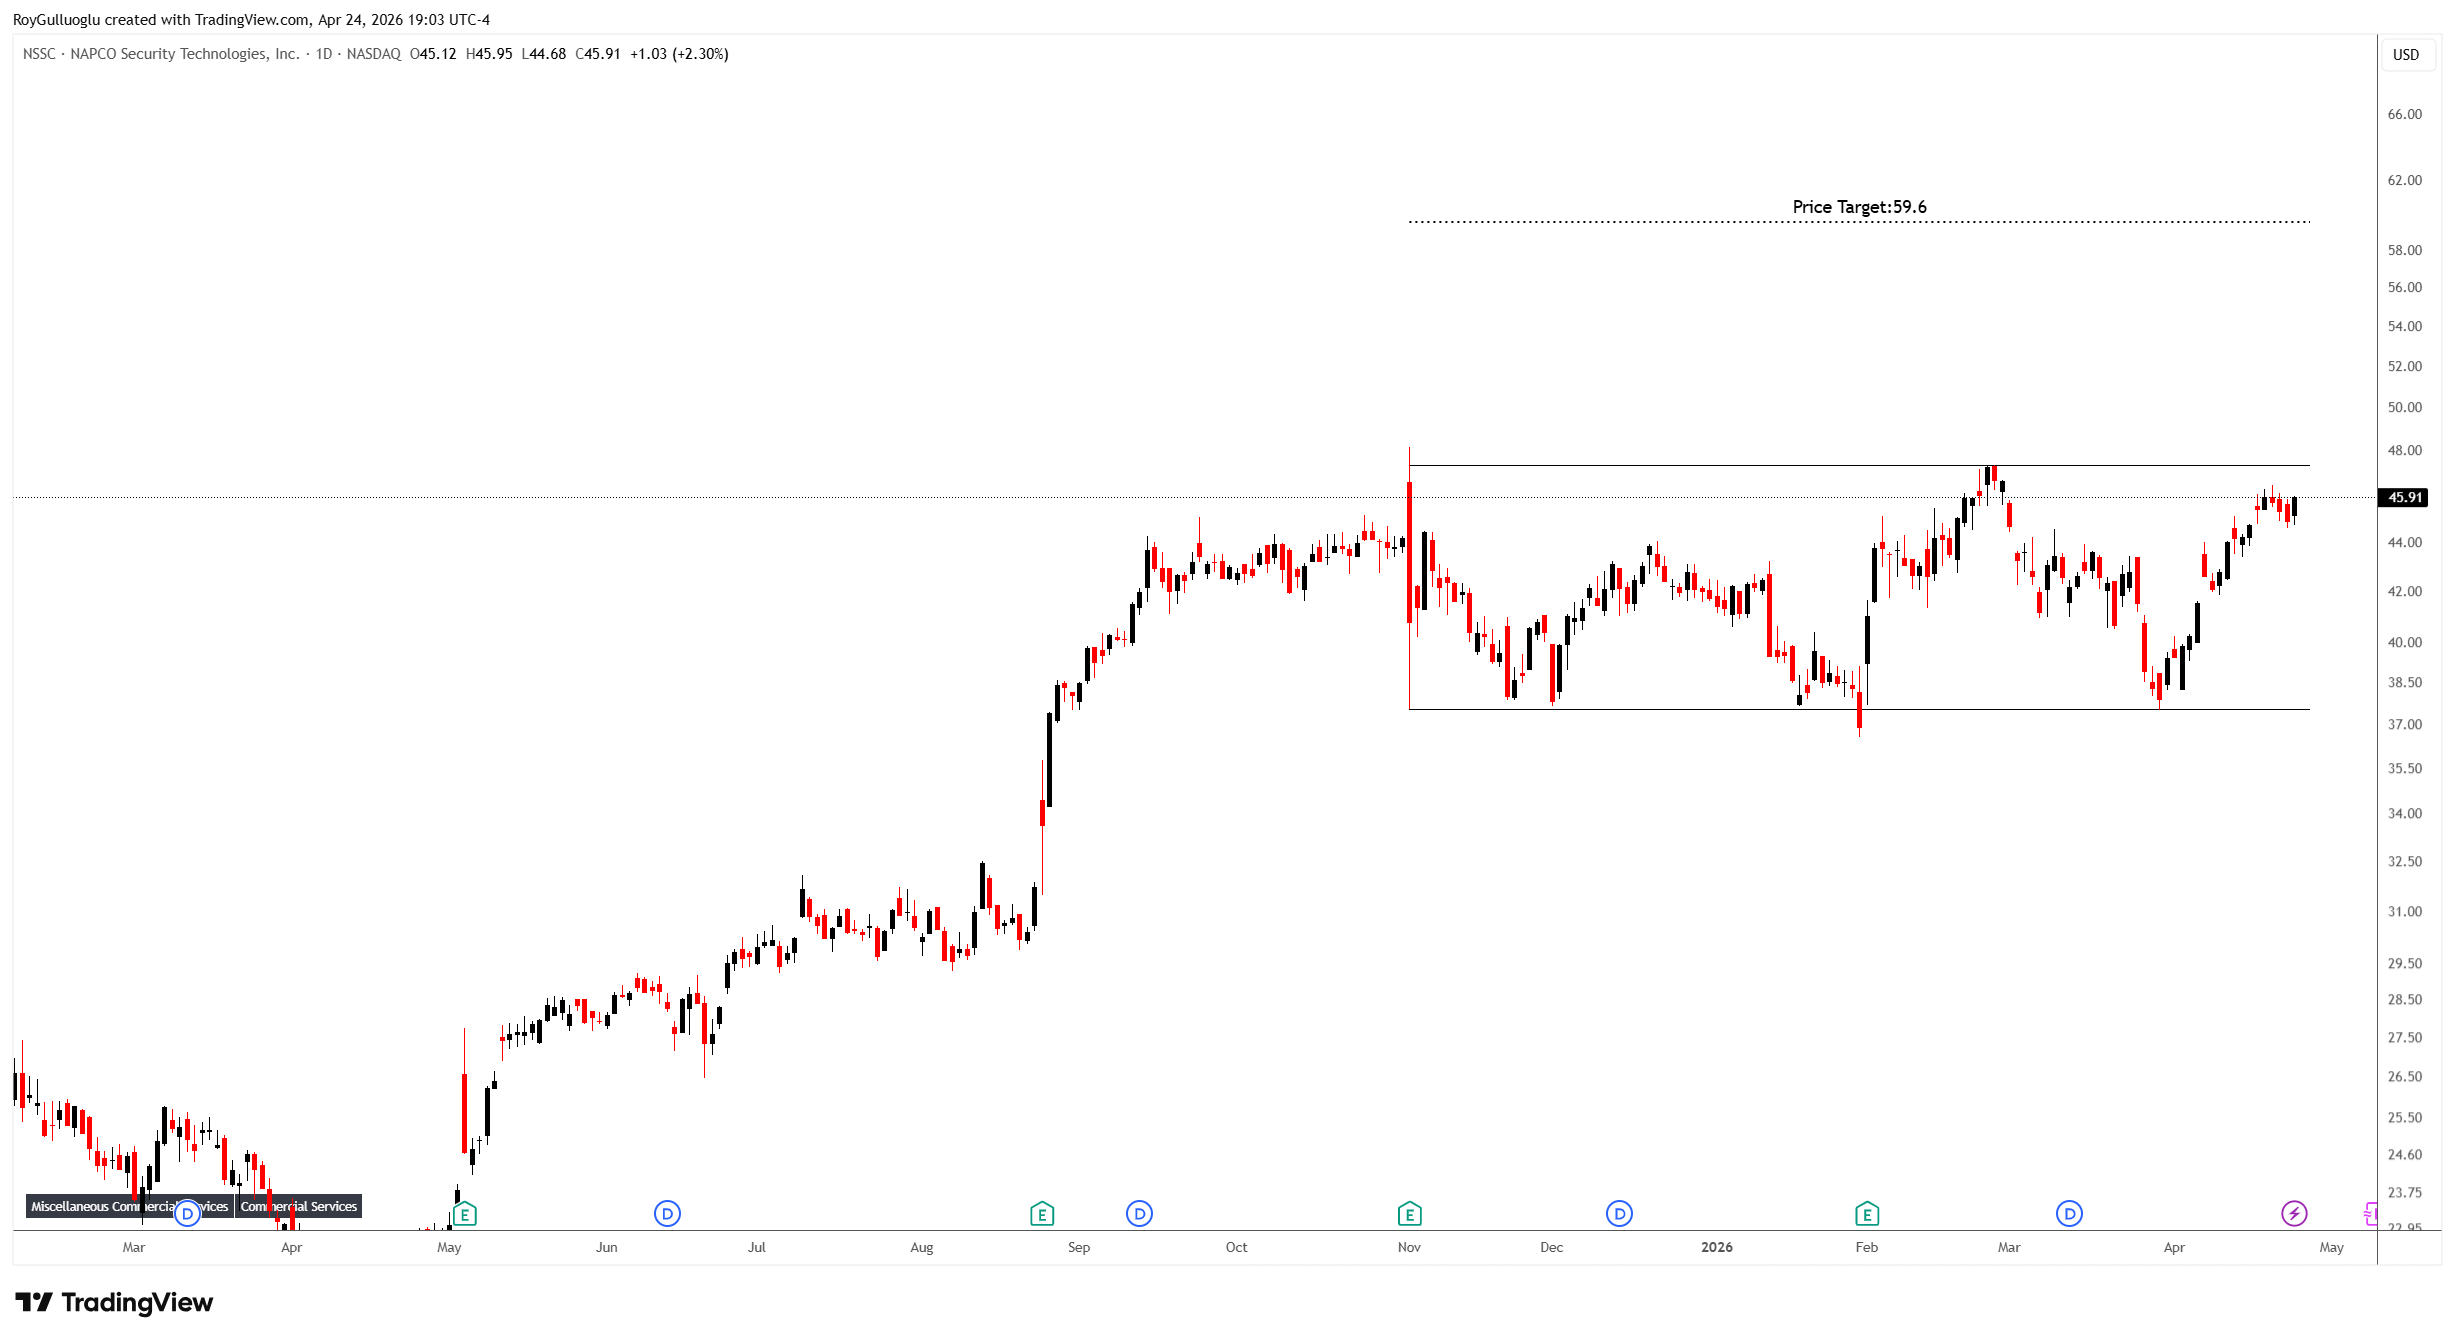
The above daily chart formed an approximately 4-month-long rectangle chart pattern as a bullish continuation after an uptrend.
The horizontal boundary at 47.3 levels acts as a resistance within this pattern.
A daily close above 48.7 levels would validate the breakout from the 4-month-long rectangle chart pattern.
Based on this chart pattern, the potential price target is 59.6 levels.
NeuroPace, Inc.-(NPCE/NASDAQ)-Long Idea
NeuroPace, Inc. operates as a medical device company in the United States. The company develops RNS system, a brain-responsive neuromodulation system that delivers personalized, real-time treatment at the seizure source for treating drug-resistant focal epilepsy.
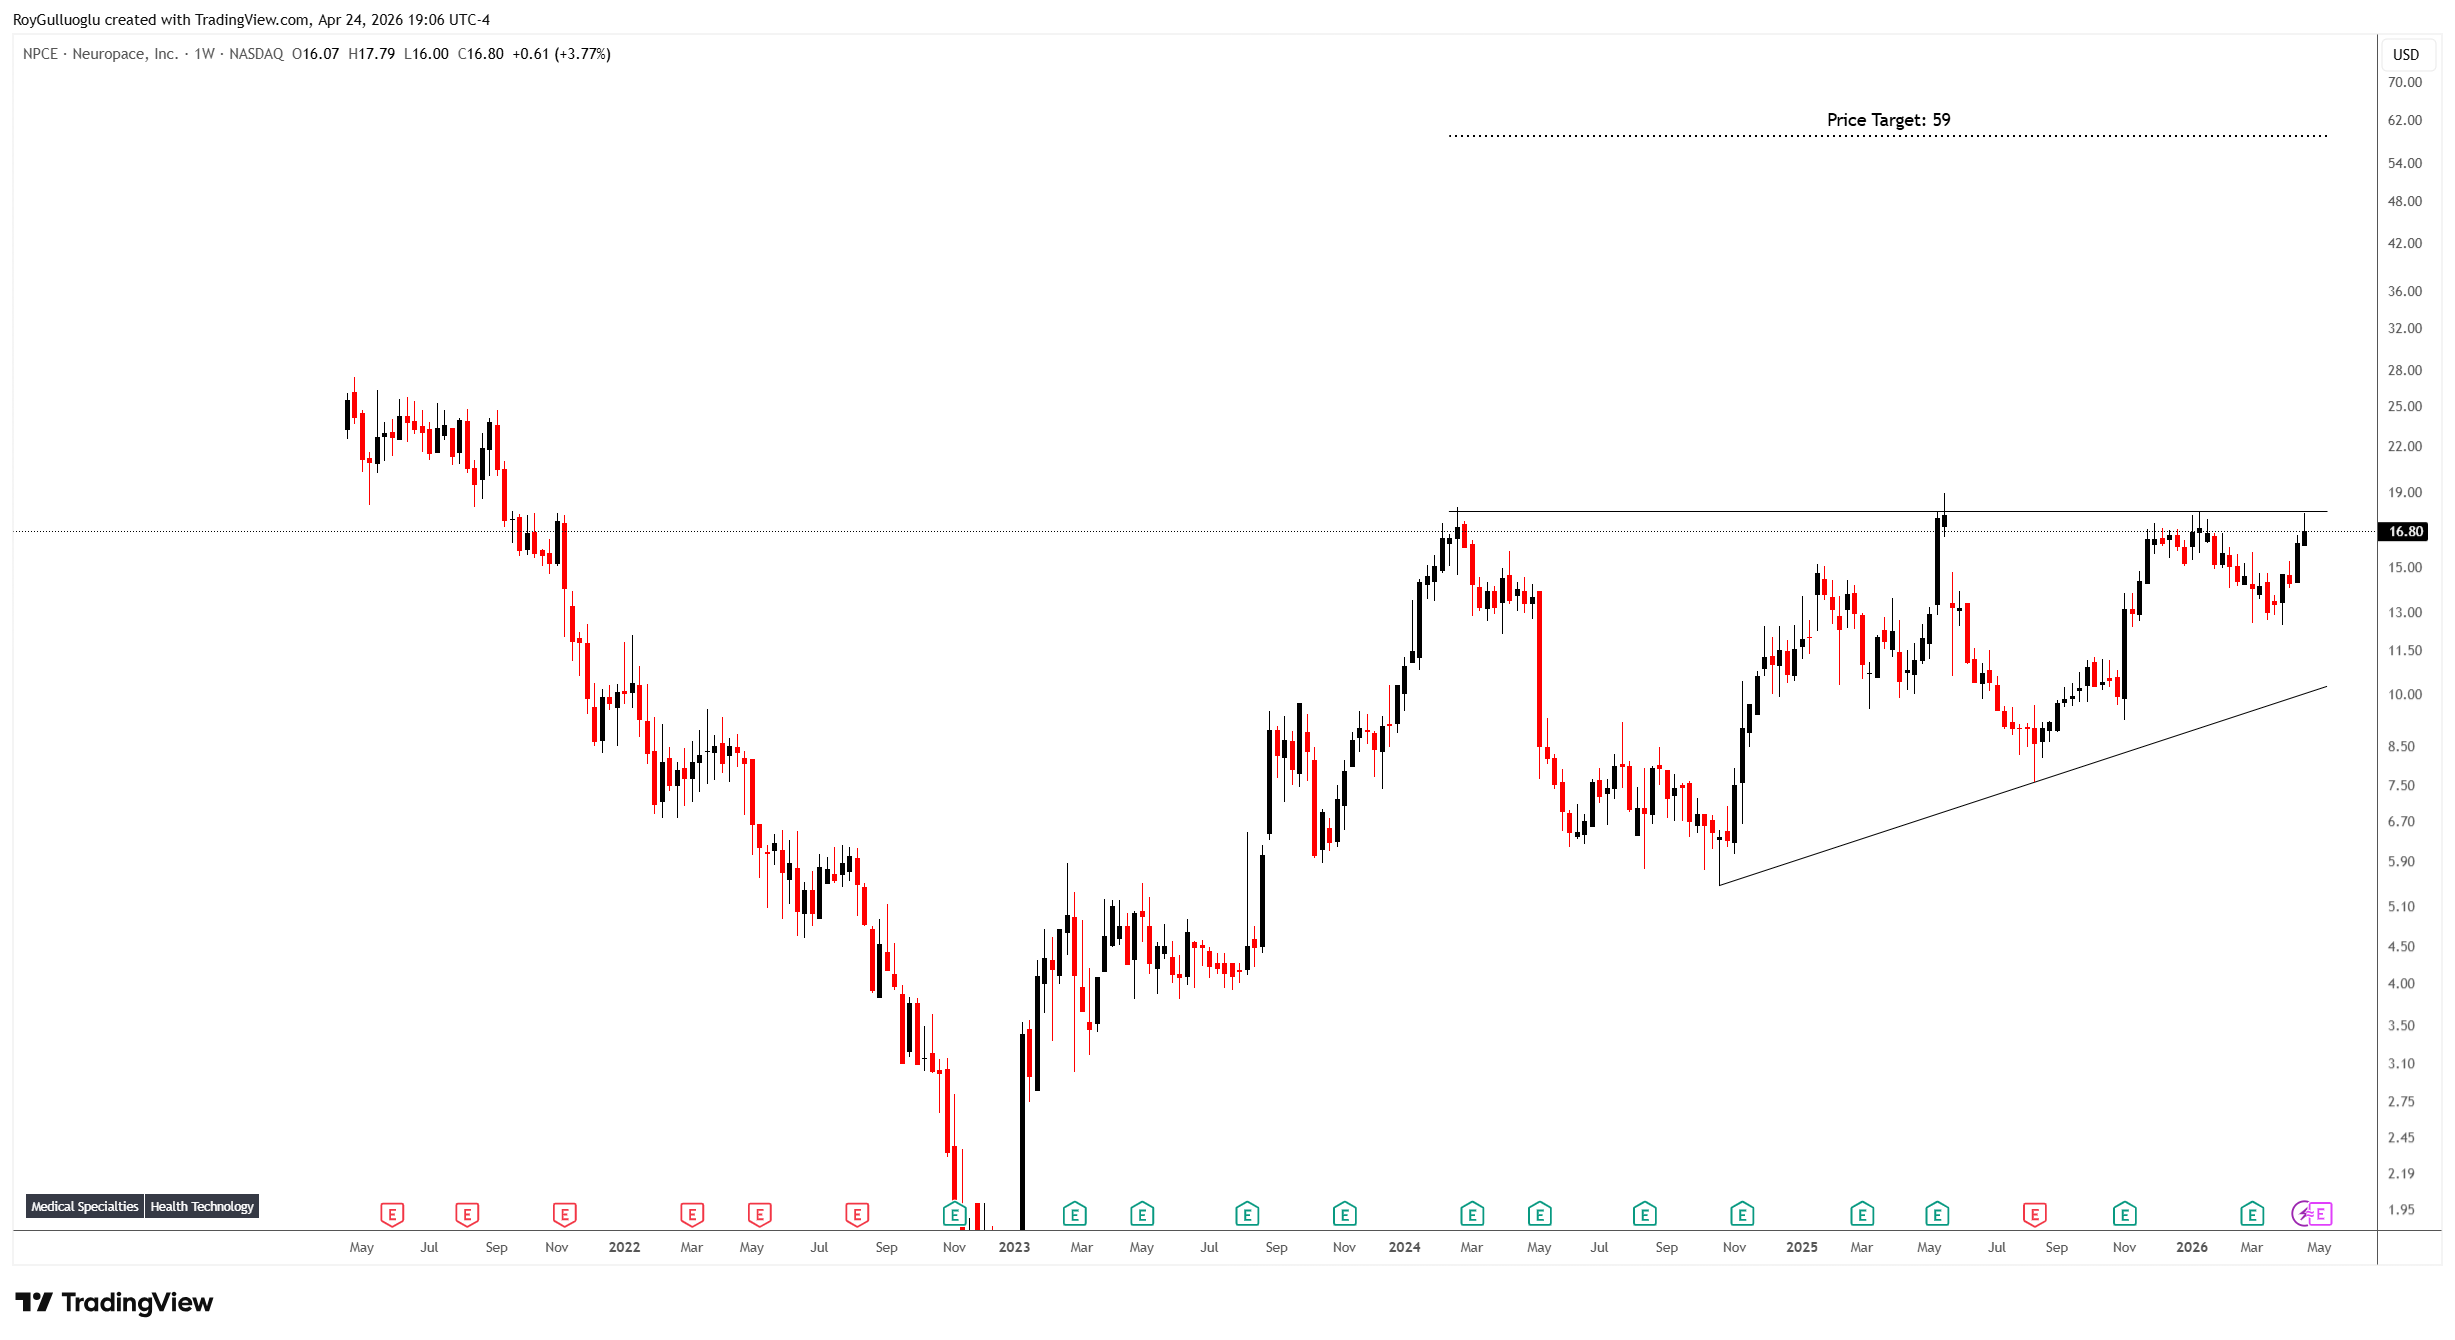
The above weekly chart formed an approximately 28-month-long ascending triangle chart pattern as a bullish reversal after a downtrend.
The horizontal boundary at 17.9 levels acts as a resistance within this pattern.
A daily close above 18.43 levels would validate the breakout from the 28-month-long ascending triangle chart pattern.
Based on this chart pattern, the potential price target is 59 levels.
The Charles Schwab Corporation -(SCHW/NYSE)-Short Idea
The Charles Schwab Corporation, together with its subsidiaries, operates as a savings and loan holding company that provides wealth management, securities brokerage, banking, asset management, custody, and financial advisory services in the United States and internationally.
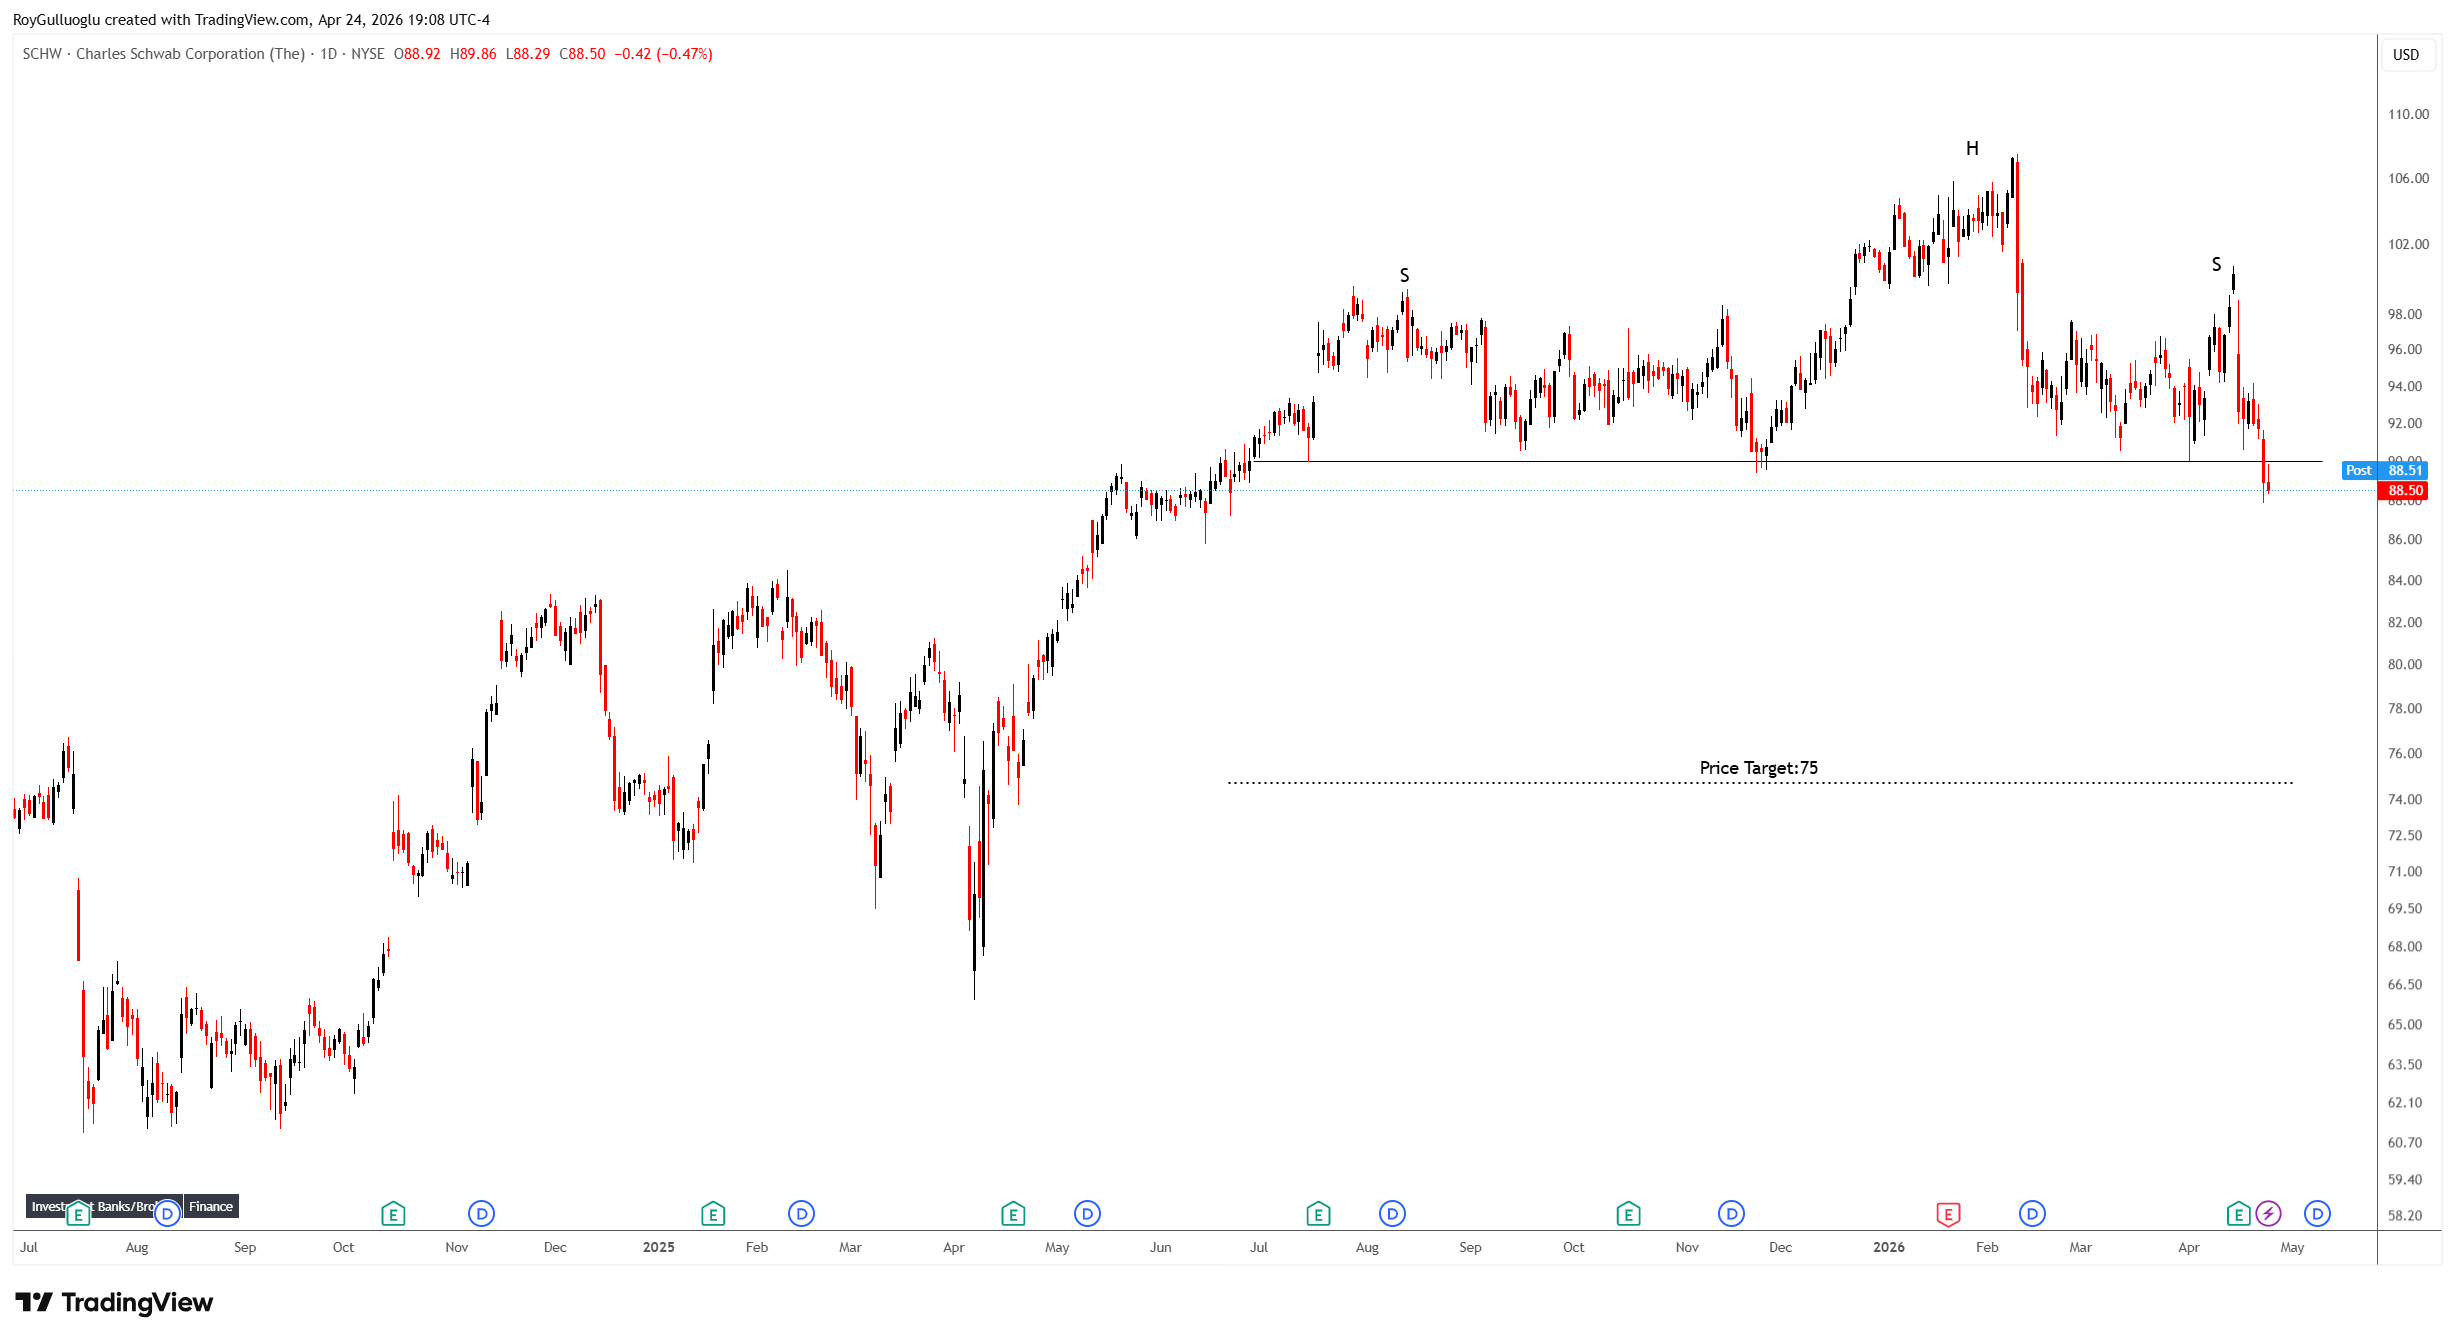
The above daily chart formed an approximately 6-month-long H&S top chart pattern as a bearish reversal after an uptrend.
The horizontal boundary at 90 levels acts as a support within this pattern.
A daily close below 87.3 levels would validate the breakdown from the 6-month-long H&S top chart pattern.
Based on this chart pattern, the potential price target is 75 levels.
Shopify Inc.-(SHOP/NASDAQ)-Long Idea
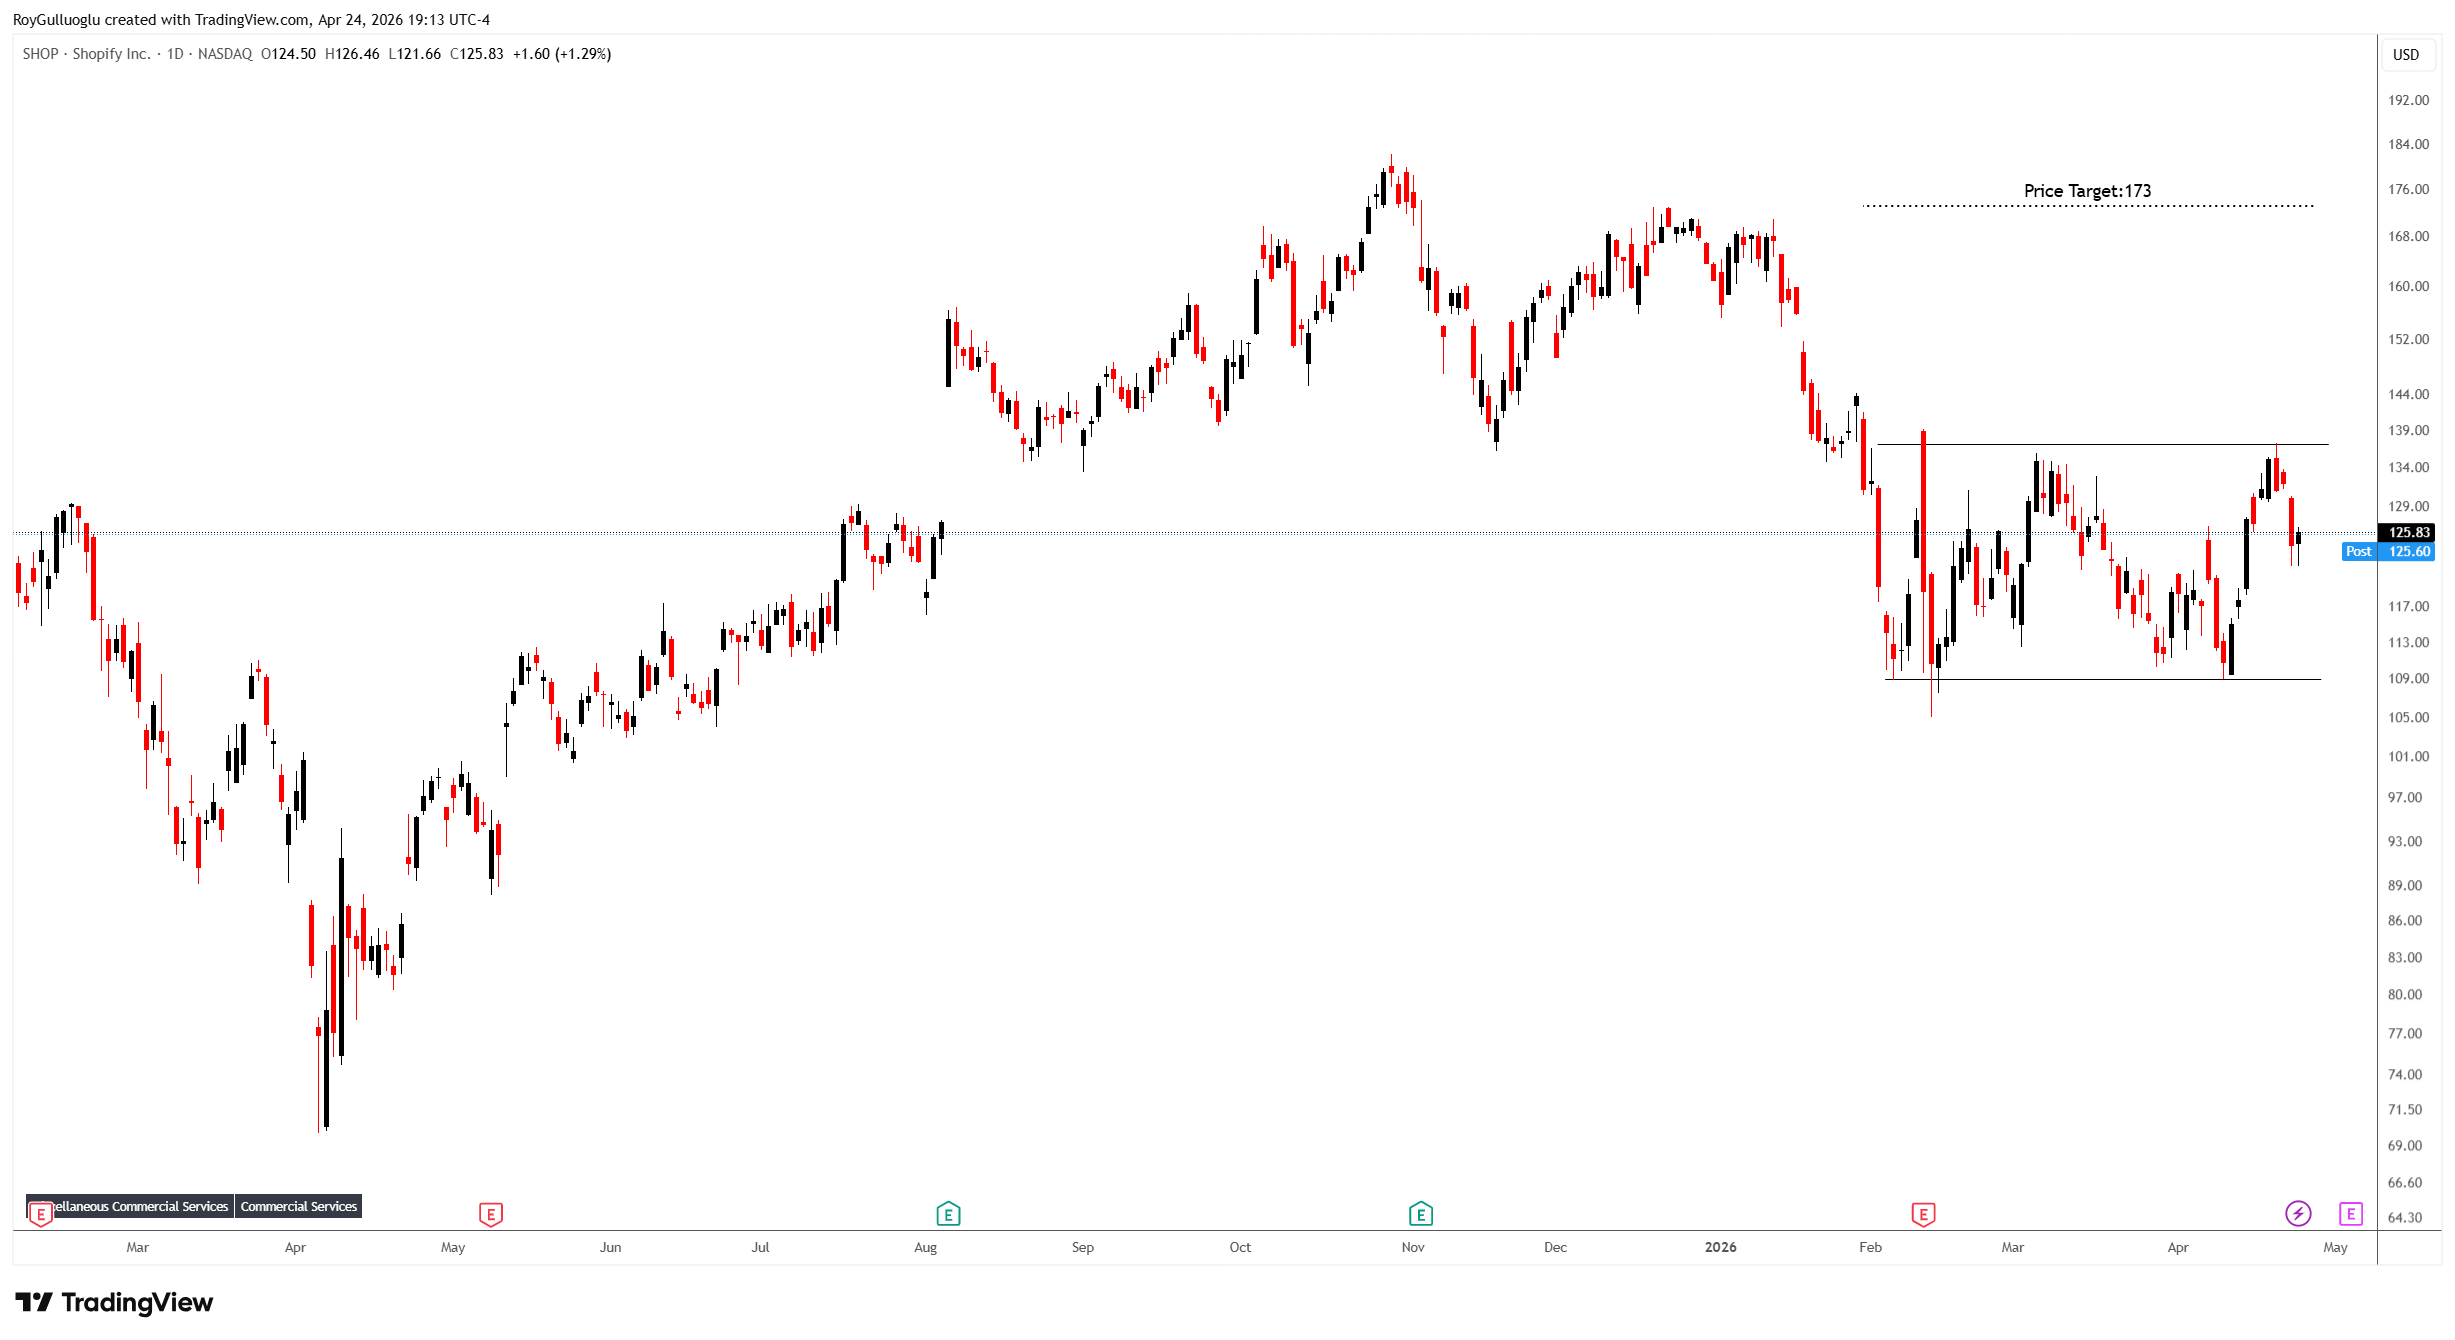
Shopify Inc., a commerce technology company, provides tools to start, scale, market, and run a business of various sizes in Canada, the United States, Europe, the Middle East, Africa, the Asia Pacific, and Latin America.
The above daily chart formed an approximately 2-month-long rectangle chart pattern as a bullish reversal after a downtrend.
The horizontal boundary at 137.12 levels acts as a resistance within this pattern.
A daily close above 141.2 levels would validate the breakout from the 2-month-long rectangle chart pattern.
Based on this chart pattern, the potential price target is 173 levels.