


New setups
Datadog, Inc-(DDOG/NASDAQ)-Long Idea
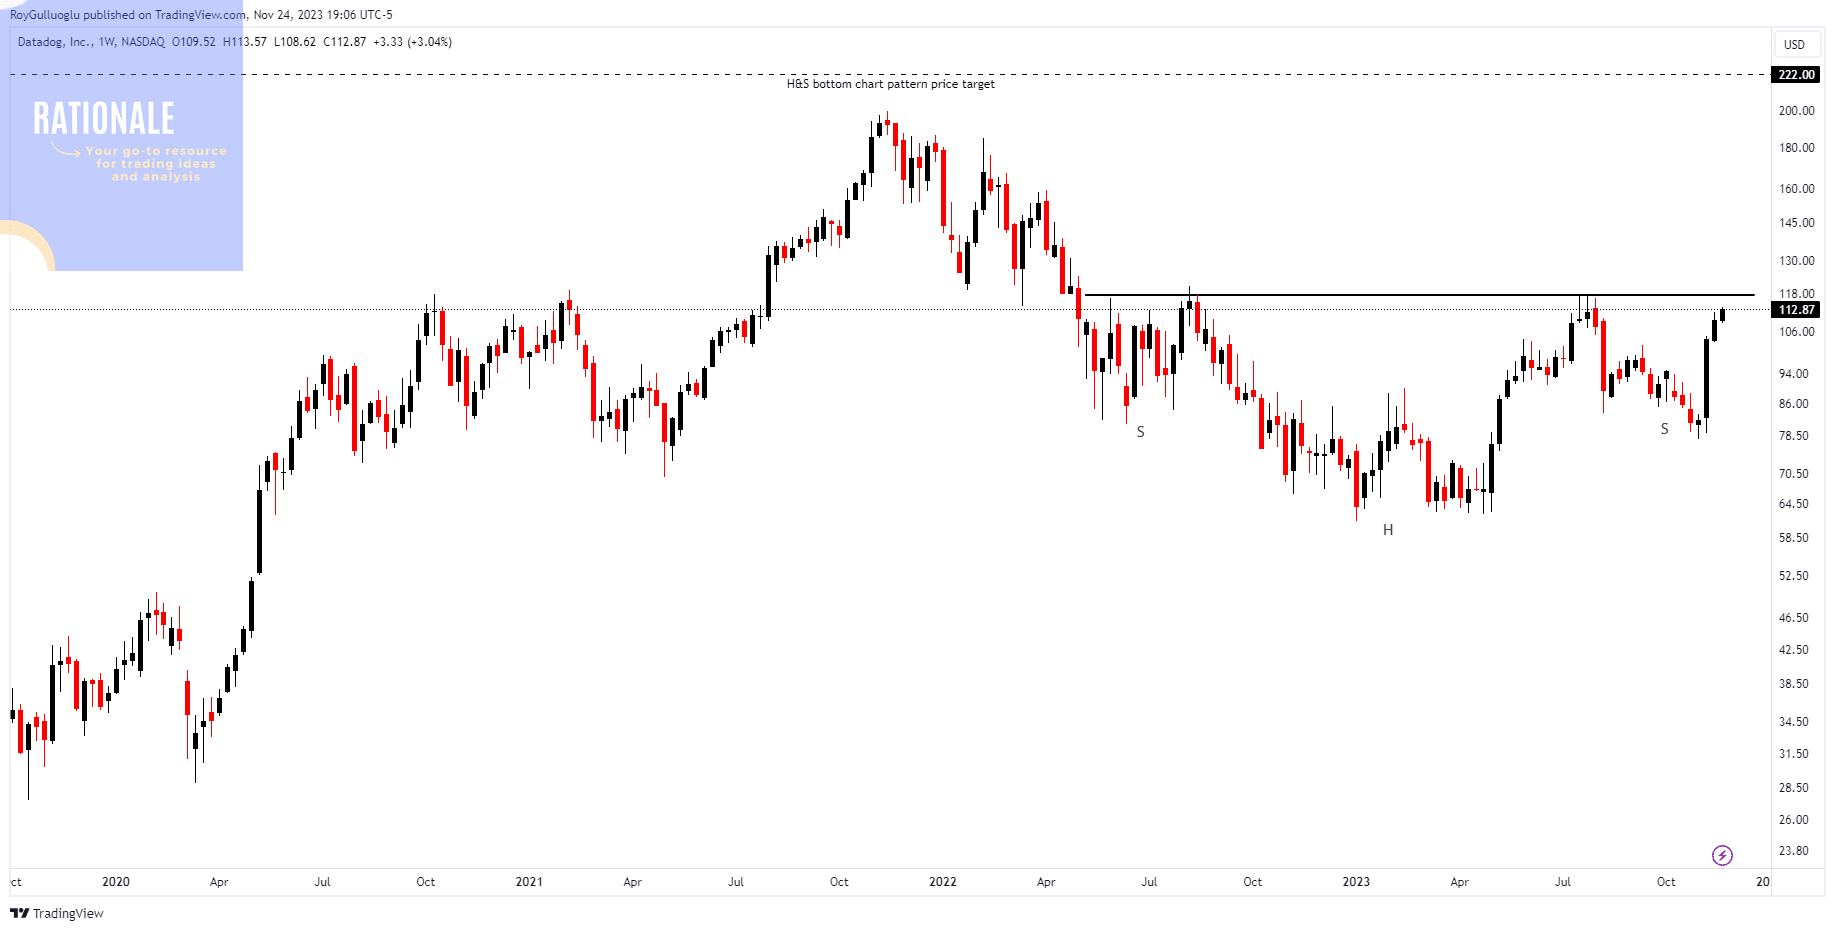
Datadog is a monitoring and analytics tool designed for cloud-scale applications, offering monitoring capabilities for servers, databases, tools, and services through its SaaS-based data analytics platform.
The above weekly chart formed an approximately 20-month-long H&S bottom chart pattern as a bullish reversal after a downtrend.
Within this pattern, the horizontal boundary at 117.5 levels acts as a resistance.
A daily close above 121 levels would validate the breakout from the 20-month-long H&S bottom chart pattern.
Based on this chart pattern, the potential price target is 222 levels.
DDOG, classified under the "technology" sector, falls under the “Large Cap - Growth” stock category.
The AI narrative also supports the DDOG. Datadog's platform enhances AI by providing scalable computational power, efficient storage, and collaborative environments.
Multiple quarters of EPS, and revenue acceleration YoY in Quarterly Earnings is another strength of the stock.
Consolidation on the right side of the base is much preferable. Seeing a price tightness before a potential breakout would be much more convincing.
Alamos Gold, Inc-(AGI/NYSE)-Long Idea
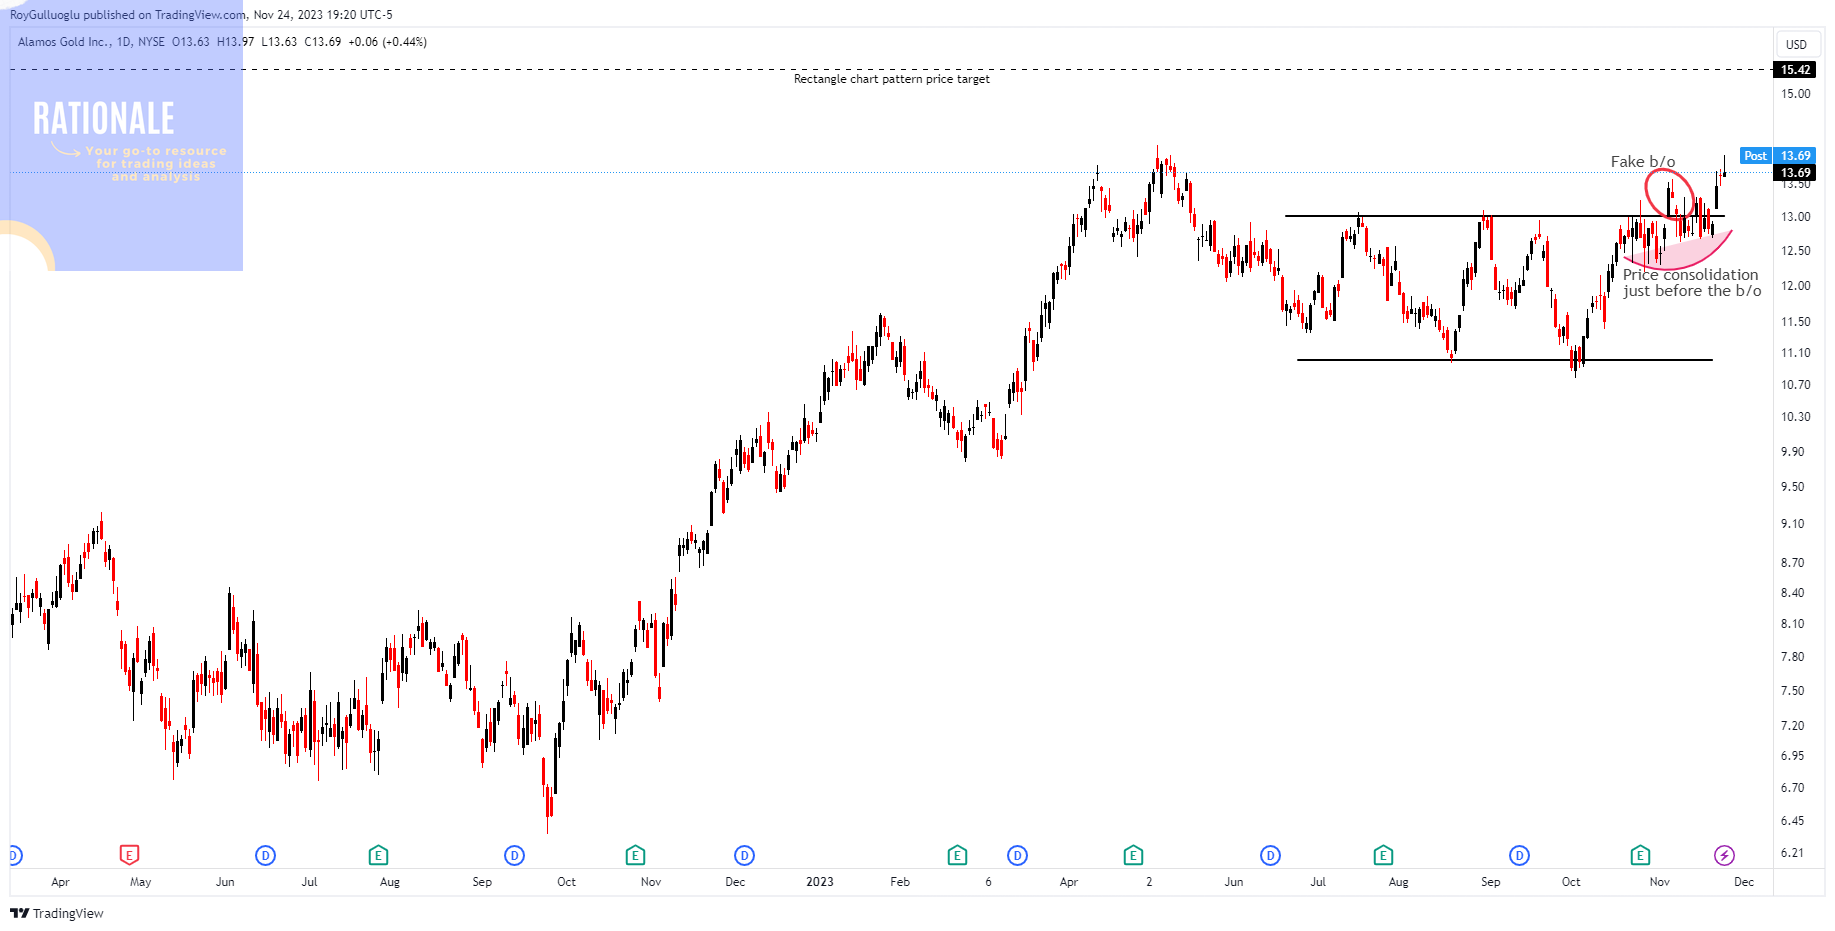
Alamos Gold is a Canadian-based intermediate gold producer. The company is involved in the exploration, development, and extraction of gold from various mining projects. Alamos Gold operates in North America and has several gold mines, including the Young-Davidson Mine in Canada and the Mulatos Mine in Mexico.
The above daily chart formed an approximately 3-month-long rectangle chart pattern.
Within this pattern, the horizontal boundary at 13 levels acts as a resistance.
A daily close above 13.4 levels validated the breakout from the 3-month-long rectangle chart pattern.
Based on this chart pattern, the potential price target is 15.42 levels.
AGI, classified under the "basic materials" sector, falls under the “Mid Cap - Value” stock category.
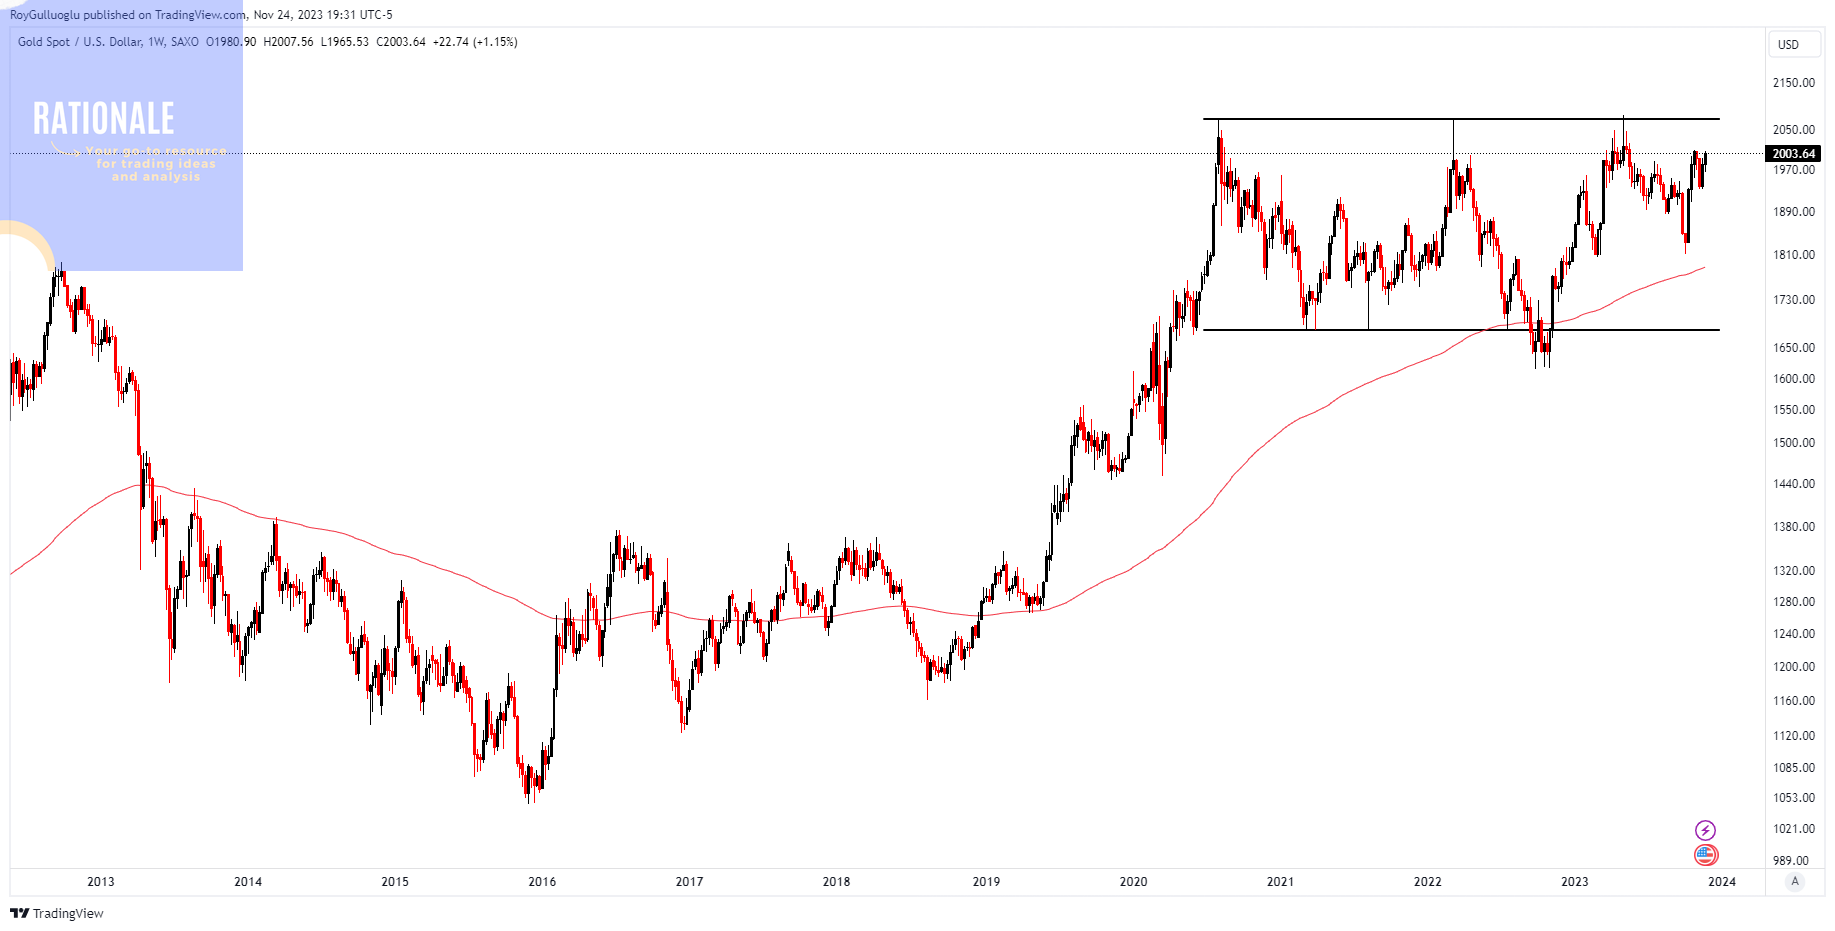
The 20-day correlation coefficient of the AGI with gold historically is above 0.70 levels. Currently, it is coming back to those levels from the `0` correlation. If you would like to employ the AGI long idea as a high beta long play on gold, you can also check the below weekly graph where a 40-month-long rectangle chart pattern is established.

Valero Energy Corporation-(VLO/NYSE)-Long Idea
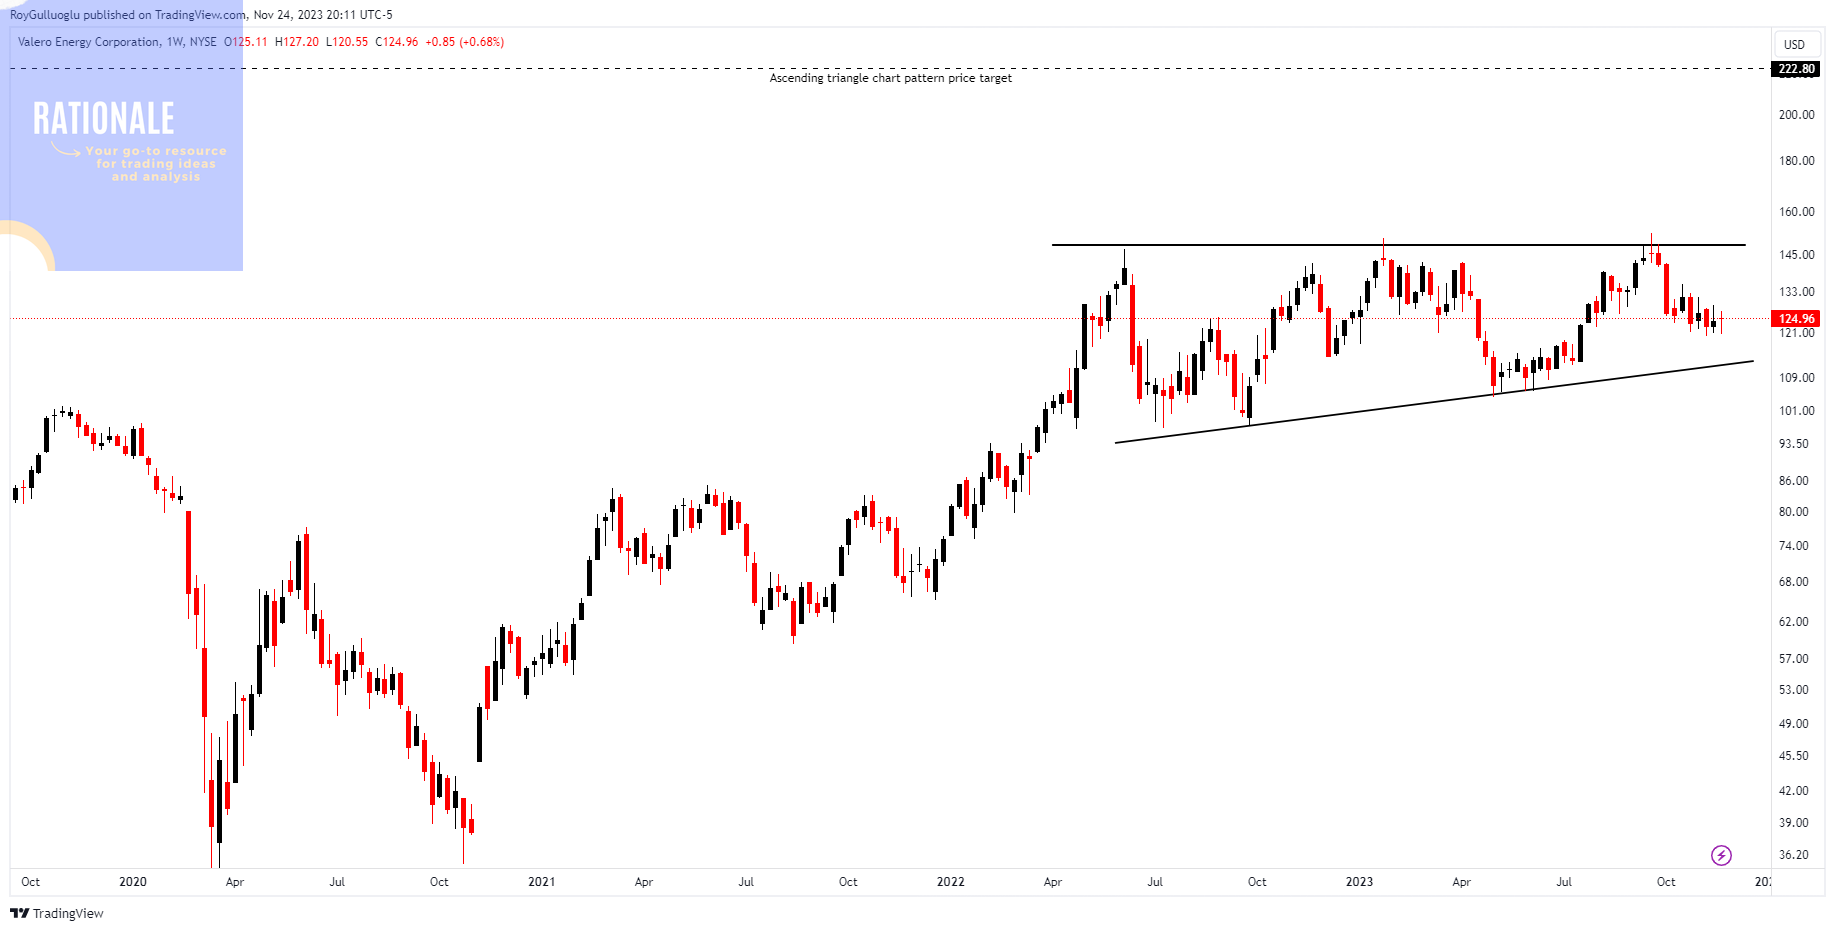
Valero Energy Corporation is an American multinational energy company primarily engaged in the refining and marketing of petroleum products.
The above weekly chart formed an approximately 19-month-long ascending triangle chart pattern as a bullish continuation after an uptrend.
Within this pattern, the horizontal boundary at 148 levels acts as strong resistance.
A daily close above 152.4 levels would validate the breakout from the 19-month-long ascending triangle chart pattern.
Based on this chart pattern, the potential price target is 222.8 levels.
VLO, classified under the "energy" sector, falls under the “Large Cap - Income” stock category.
When analyzing an oil production company like VLO, checking its relationship with the `crack spread` rather than the `oil` itself would be insightful. Crack spread is a financial indicator that represents the difference between the prices of crude oil and the refined products derived from it, such as gasoline and diesel. It is a key metric for companies in the refining industry, like Valero Energy Corporation.
Especially from the profitability perspective, as the difference between the raw material and the refined product increases, we would expect the company to make more profit. Please check the below graph of VLO where you can compare the stock price and the crack spread future contract(ARE1!-tradeable in NYMEX) in a weekly chart.
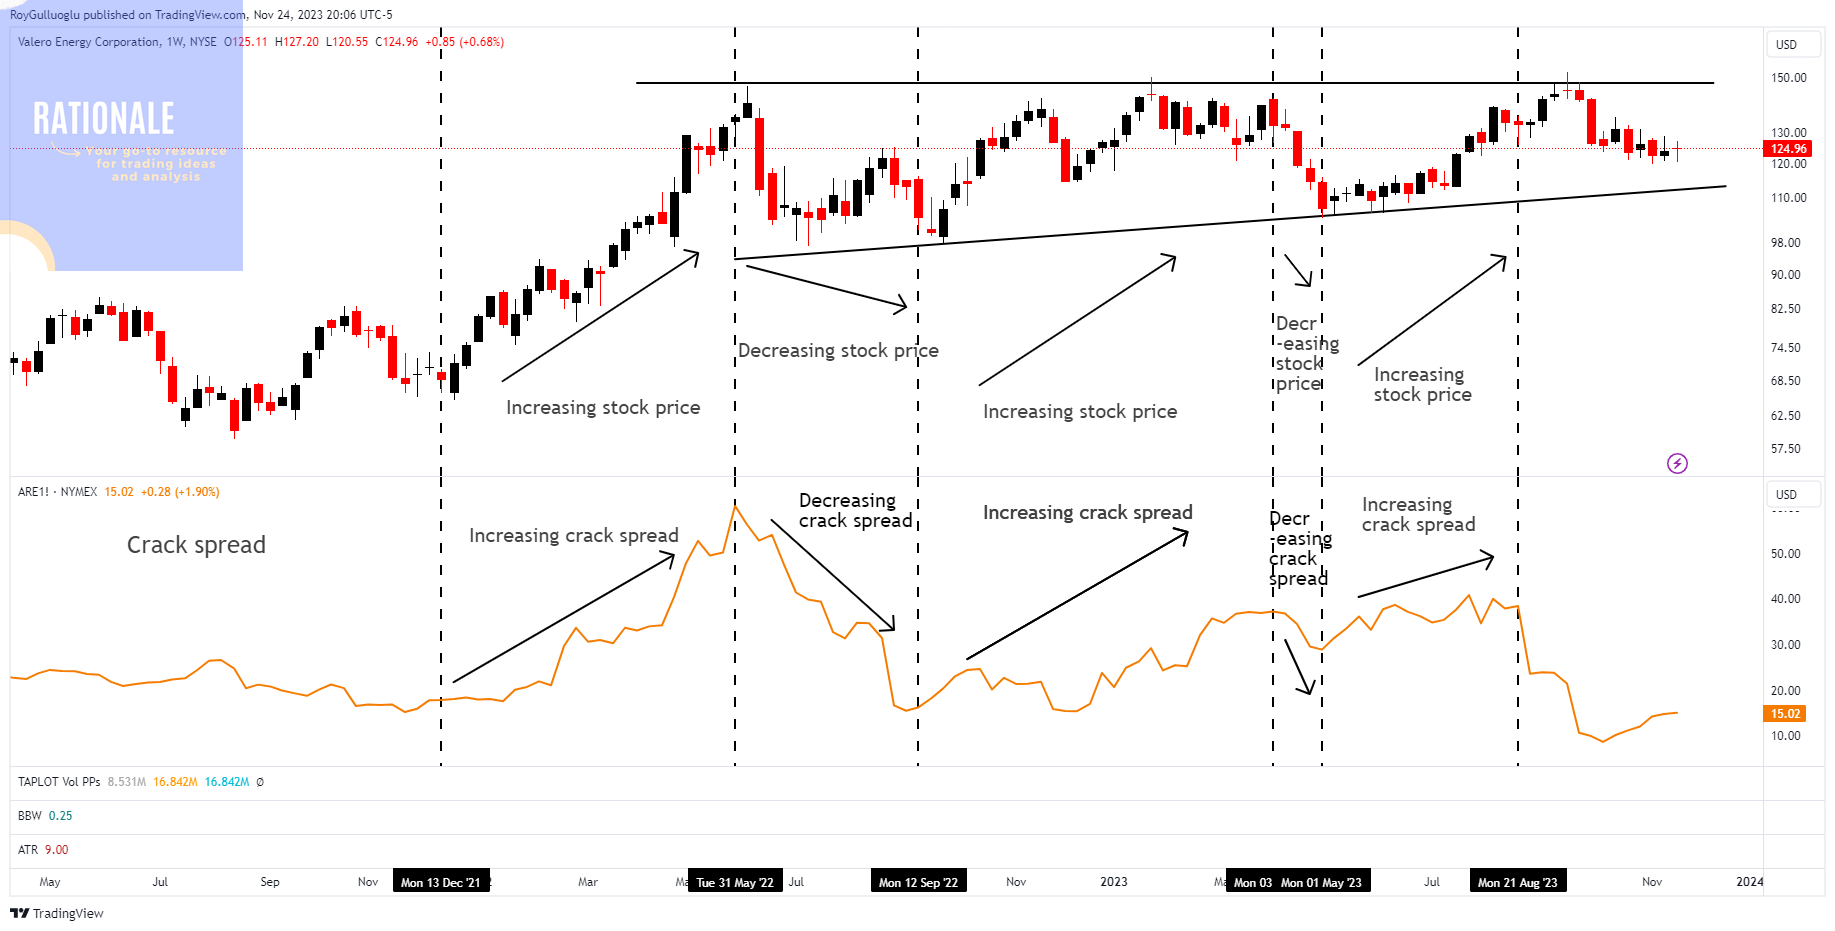
For sure, the crack spread should not be the only metric on your decision but it gives a perspective to evaluate.
Exxon Mobil Corporation-(XOM/NYSE)-Long/Short Idea
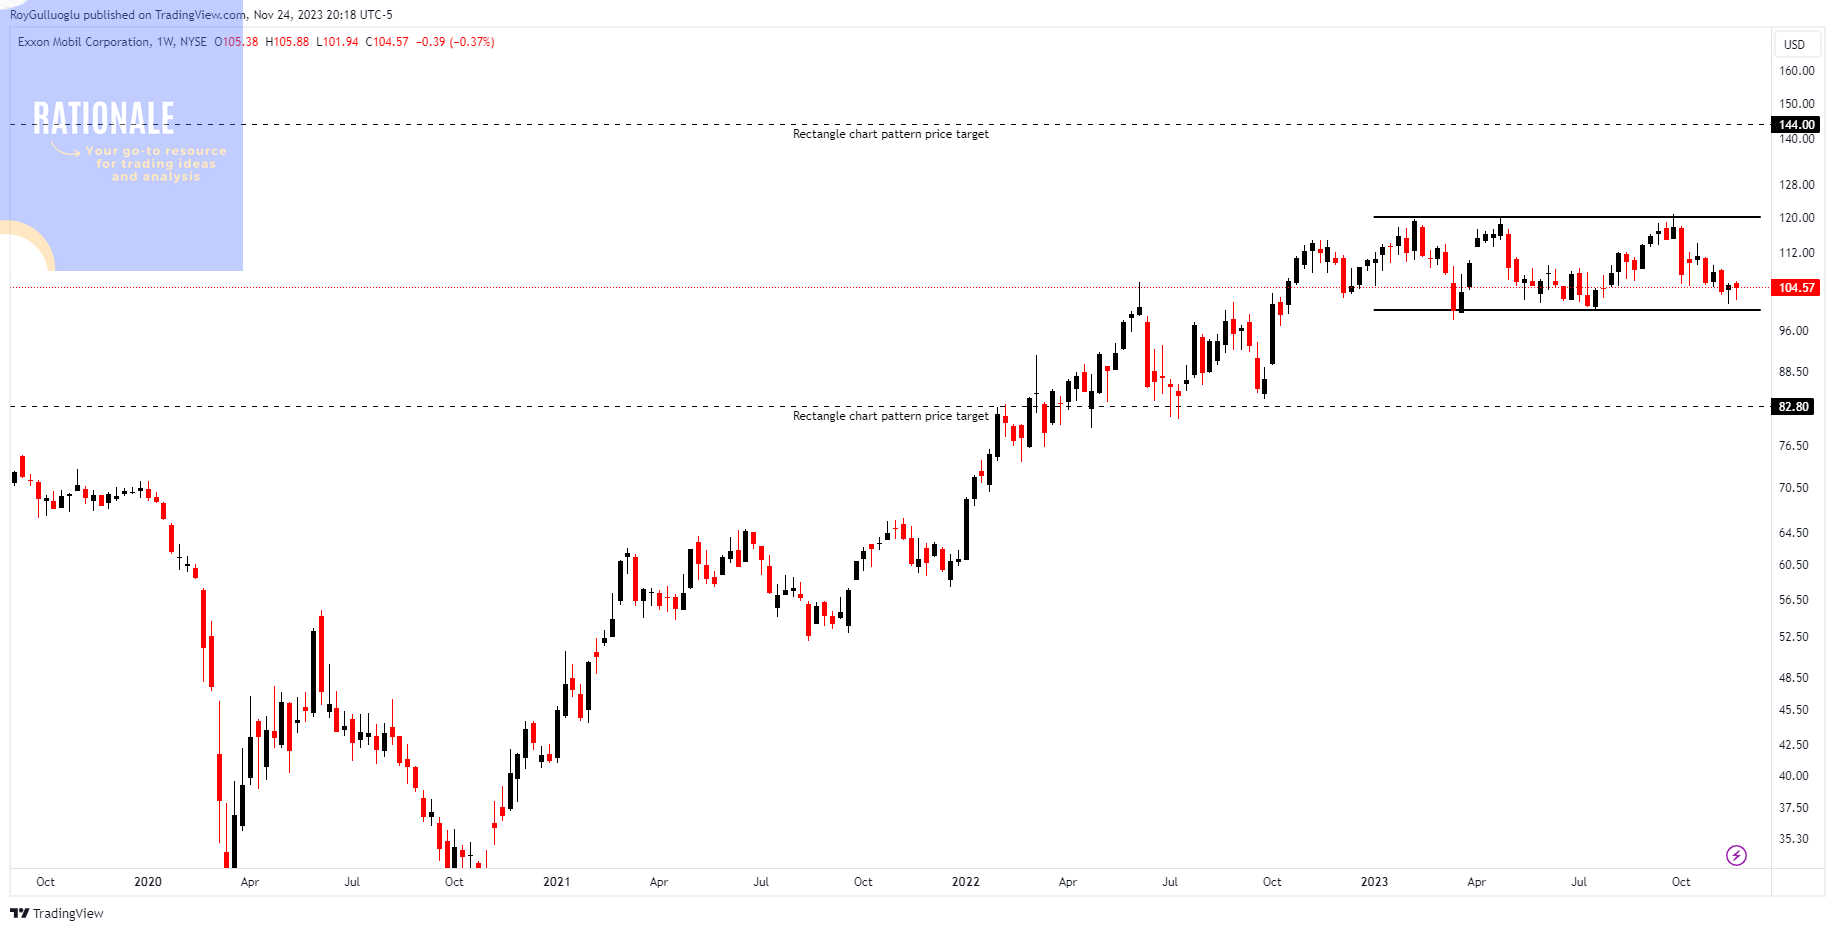
ExxonMobil Corporation is one of the largest publicly traded multinational oil and gas companies in the world.
The above daily chart formed an approximately 1.5-month-long rectangle chart pattern.
Within this pattern, the horizontal boundary at 120 levels acts as strong resistance and 100 levels acts as a support.
A daily close above 123.6 levels would validate the breakout and a daily close below 97 levels would validate the breakdown from the 1.5-month-long rectangle chart pattern.
XOM, classified under the "energy" sector, falls under the “Large Cap - Income” stock category.
EQT Corporation-(EQT/NYSE)-Long Idea
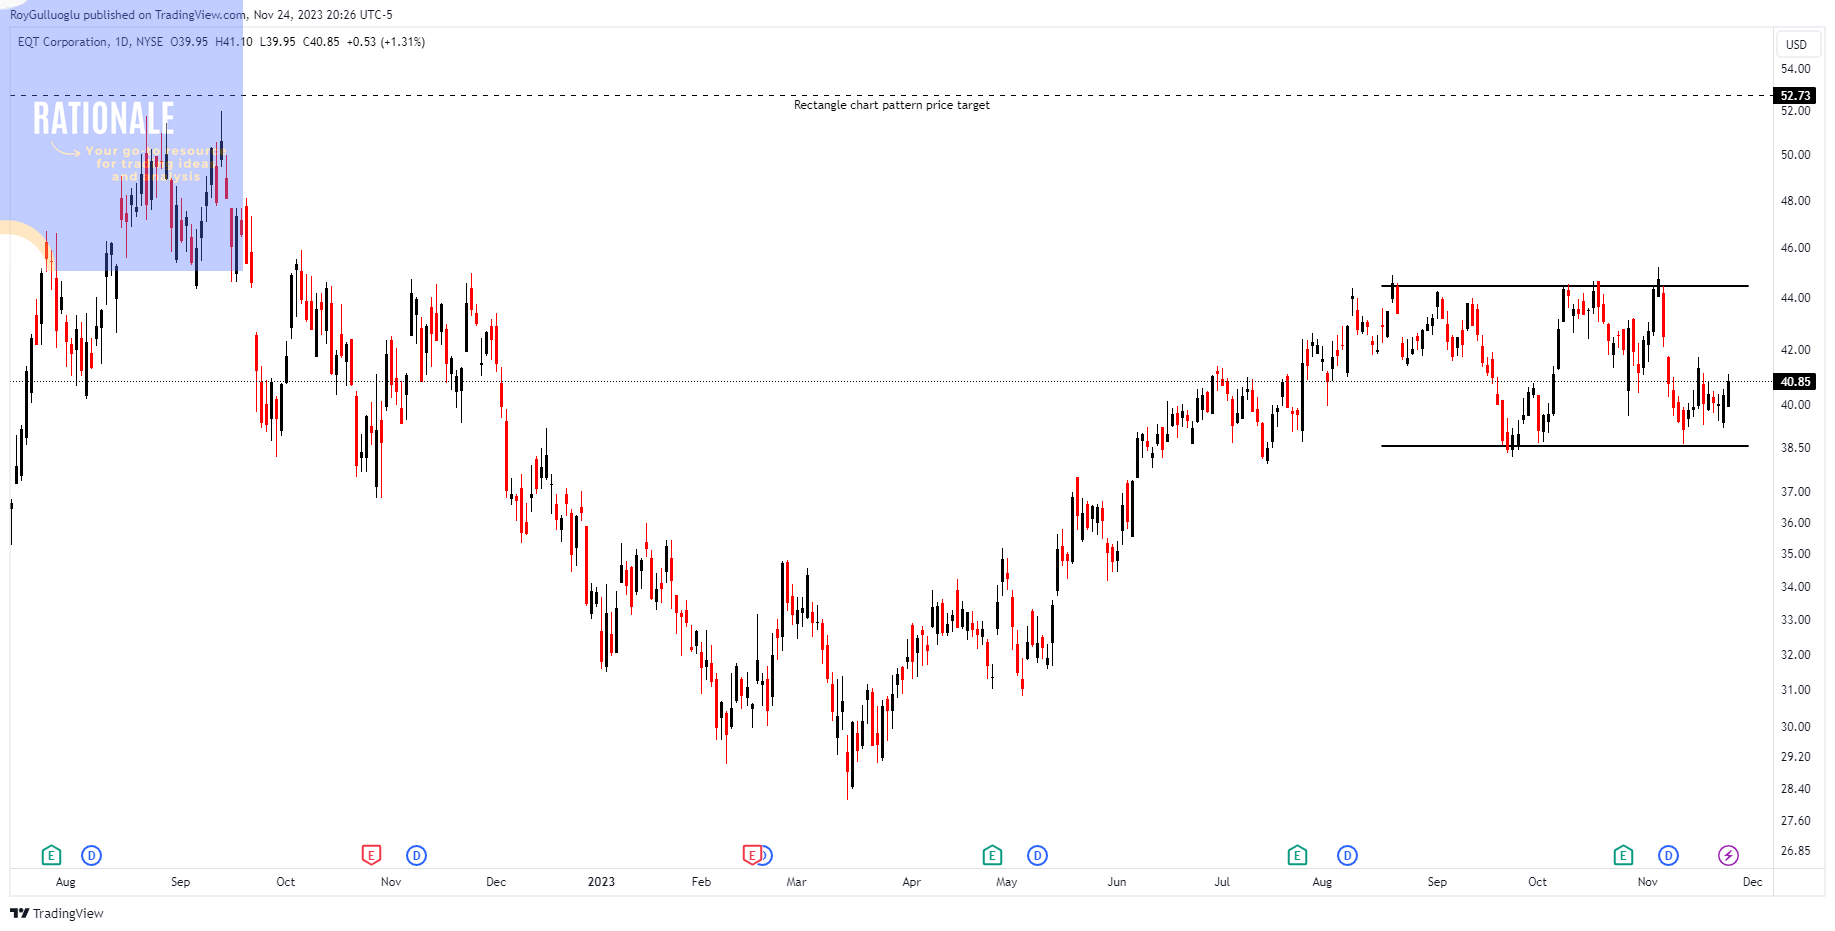
EQT Corporation is a company primarily involved in the exploration and production of natural gas, as well as the development and operation of natural gas-related assets.
The above weekly chart formed an approximately 2-month-long rectangle chart pattern as a bullish continuation after an uptrend.
Within this pattern, the horizontal boundary at 44.4 levels acts as a resistance.
A daily close above 45.73 levels would validate the breakout from the 2-month-long rectangle chart pattern.
Based on this chart pattern, the potential price target is 52.7 levels.
EQT, classified under the "energy" sector, falls under the “Large Cap - Income” stock category.
The AI narrative also supports the DDOG. Datadog's platform enhances AI by providing scalable computational power, efficient storage, and collaborative environments.
Multiple quarters of EPS, and revenue acceleration YoY in Quarterly Earnings is another strength of the stock.
I would prefer to see more consolidation on the right side of the base, before getting into the trade. Seeing a price tightness before a potential breakout would be much more convincing.
CDW Corporation-(CDW/NASDAQ) - Long Idea
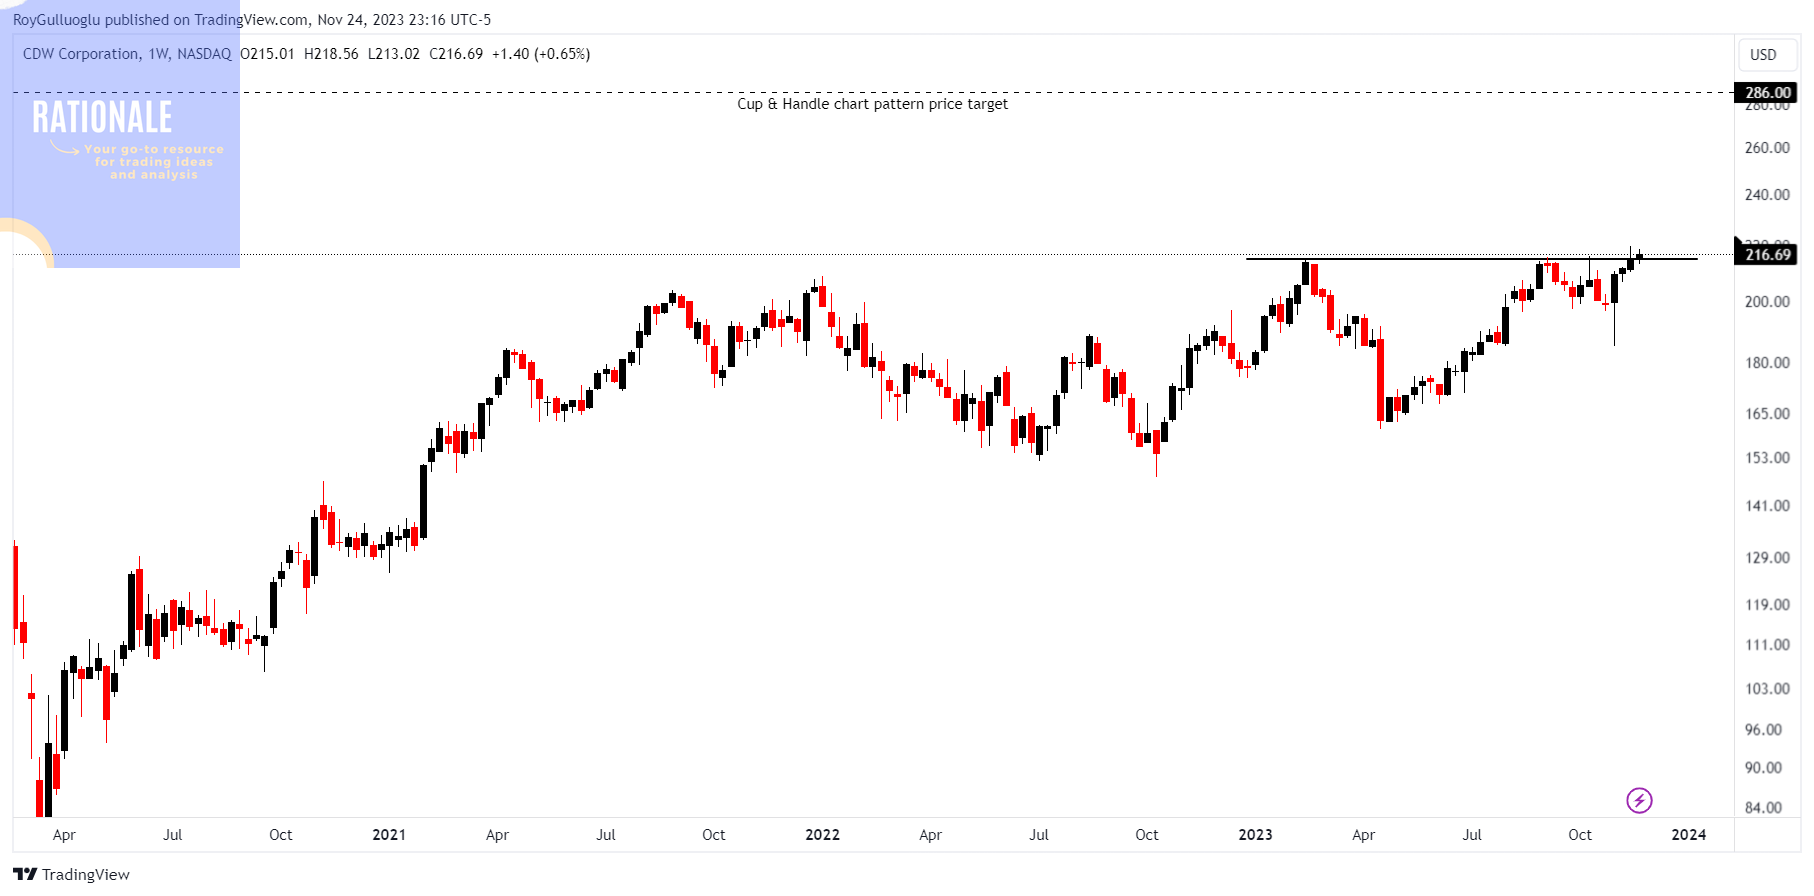
CDW Corp offers information technology solutions to clients in the United States, Canada, and the United Kingdom, spanning small, medium, and large businesses, as well as government, education, and healthcare sectors.
The above weekly chart formed an approximately 10-month-long Cup & Handle chart pattern as a bullish continuation after an uptrend.
Within this pattern, the horizontal boundary at 215 levels acts as a resistance.
A daily close above 221.45 levels would validate the breakout from the 10-month-long Cup & Handle chart pattern.
Based on this chart pattern, the potential price target is 286 levels.
CDW, classified under the "technology" sector, falls under the “Large Cap - Growth” stock category.
Illinois Tool Works Inc.-(ITW/NYSE) - Long Idea
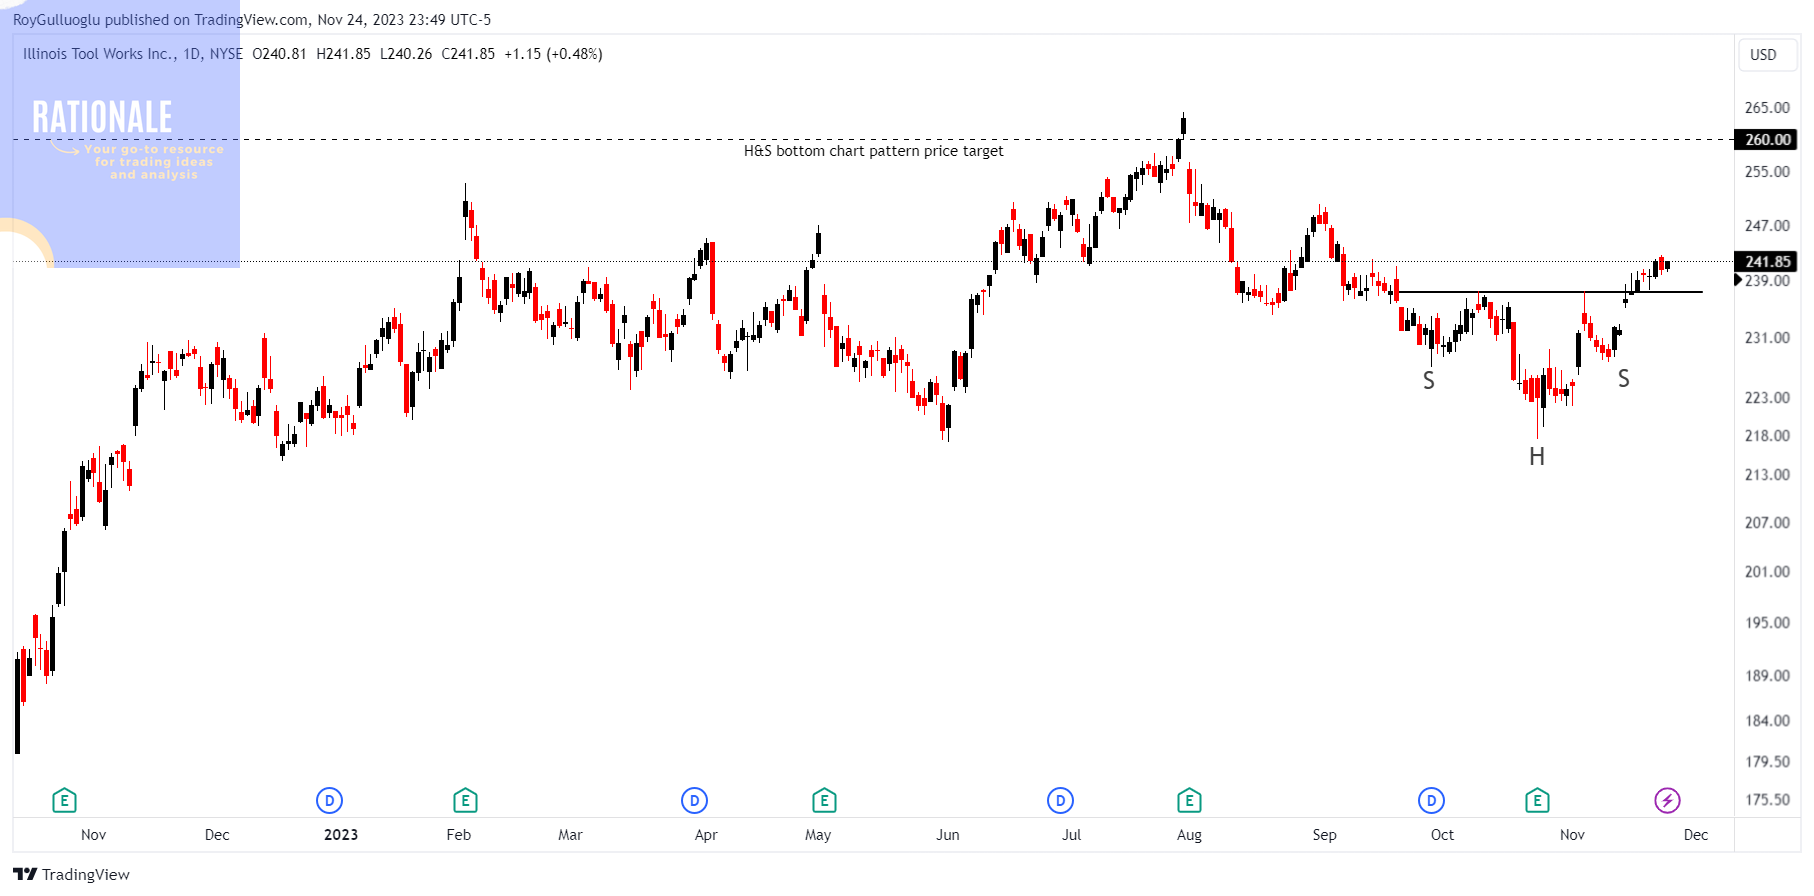
The company's business is organized into multiple segments, each focused on specific industrial products and equipment. ITW's diverse range of products includes engineered fasteners and components, equipment and consumables for the construction industry, automotive components, specialty products, and more.
The above daily chart formed an approximately 1.5-month-long H&S bottom chart pattern as a bullish reversal after a downtrend.
Within this pattern, the horizontal boundary at 237.4 levels acts as a resistance.
A daily close above 244.5 levels would validate the breakout from the 1.5-month-long H&S bottom chart pattern.
Based on this chart pattern, the potential price target is 260 levels.
ITW, classified under the "industrials" sector, falls under the “Large Cap - Value” stock category.
MSCI Inc.-(MSCI/NYSE) - Long Idea
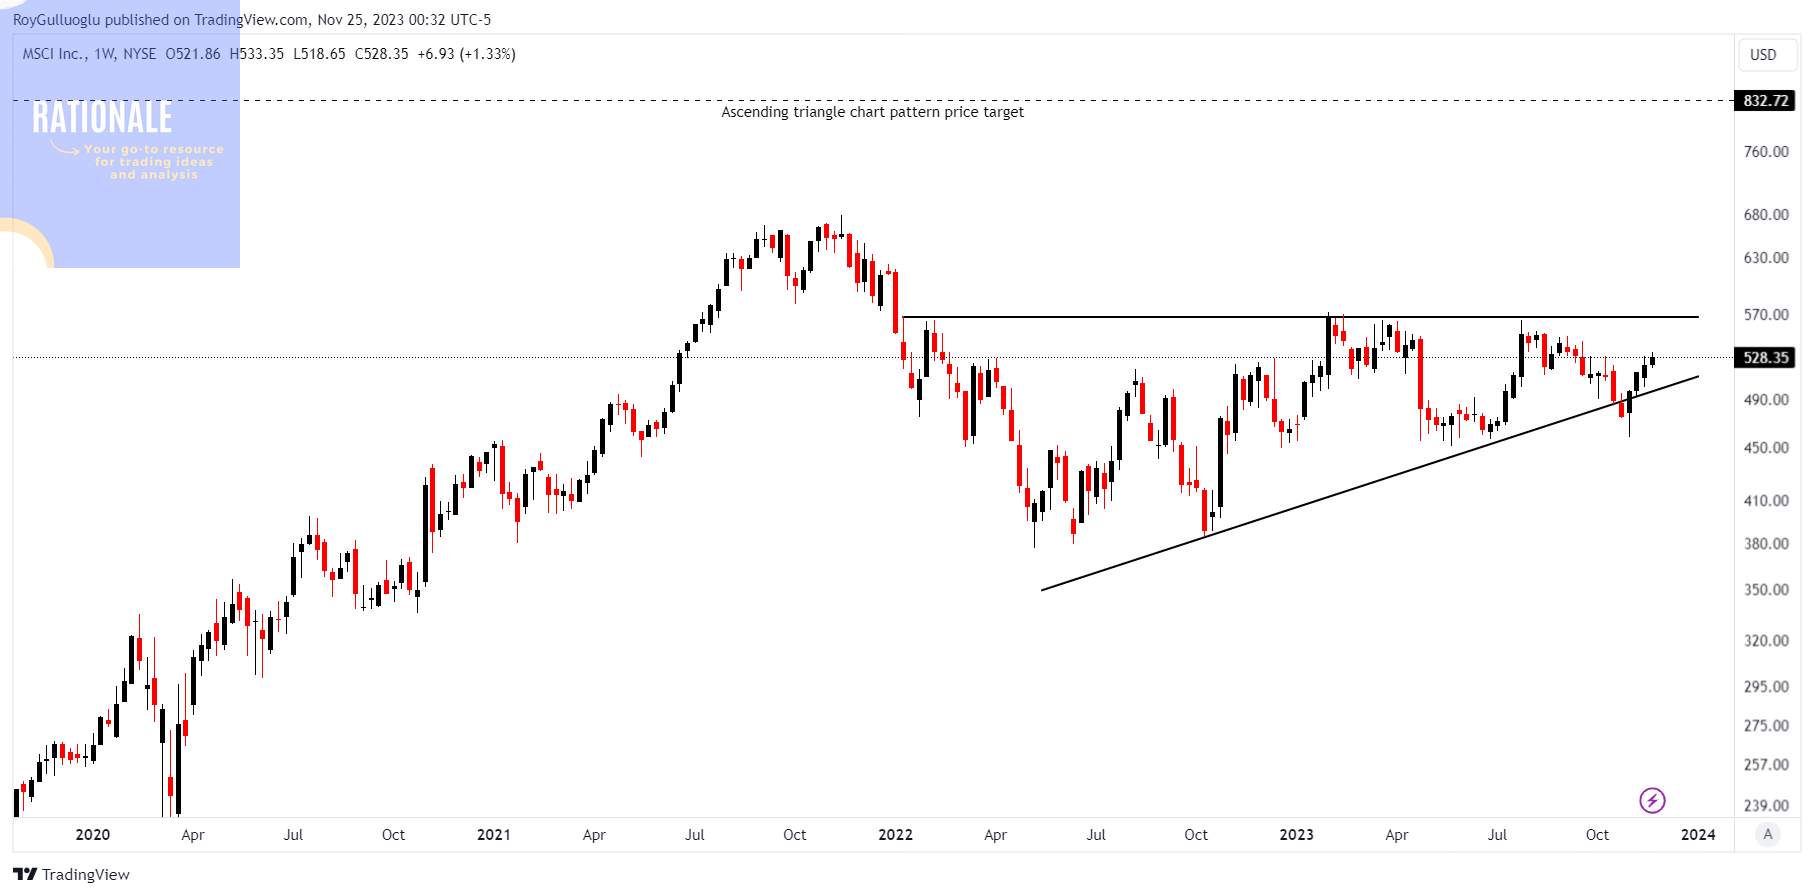
MSCI Inc functions as an independent provider of research-driven tools and insights tailored for institutional investors. The company delivers content, applications, and services designed to meet the specific requirements of institutional investors at various stages of their investment processes.
The above weekly chart formed an approximately 24-month-long ascending triangle chart pattern as a bullish reversal after a downtrend.
Within this pattern, the horizontal boundary at 566.88 levels acts as a resistance.
A daily close above 583.8 levels would validate the breakout from the 24-month-long ascending triangle chart pattern.
Based on this chart pattern, the potential price target is 832.72 levels.
Follow-ups
Broadridge Financial Solutions Inc-(BR/NYSE) - Long Idea
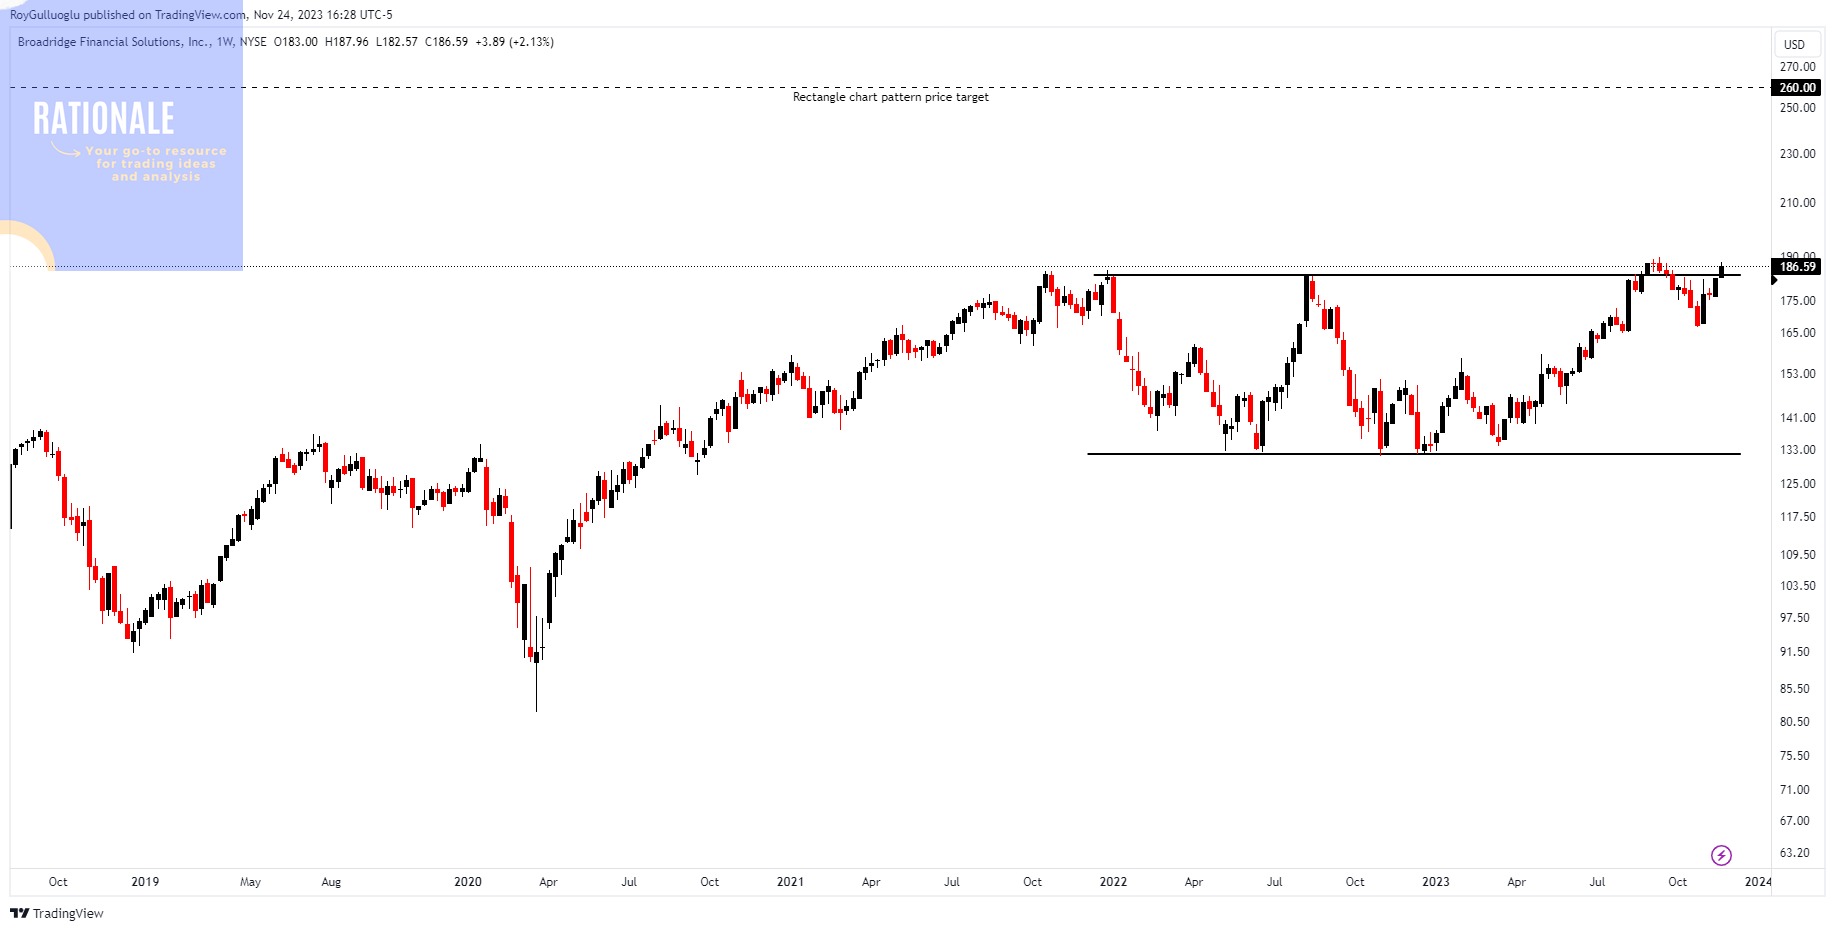
You can click the BR ticker above to access the first report explaining the RATIONALE behind the trade idea.
SAFRAN-(SAF/EURONEXT) - Long Idea
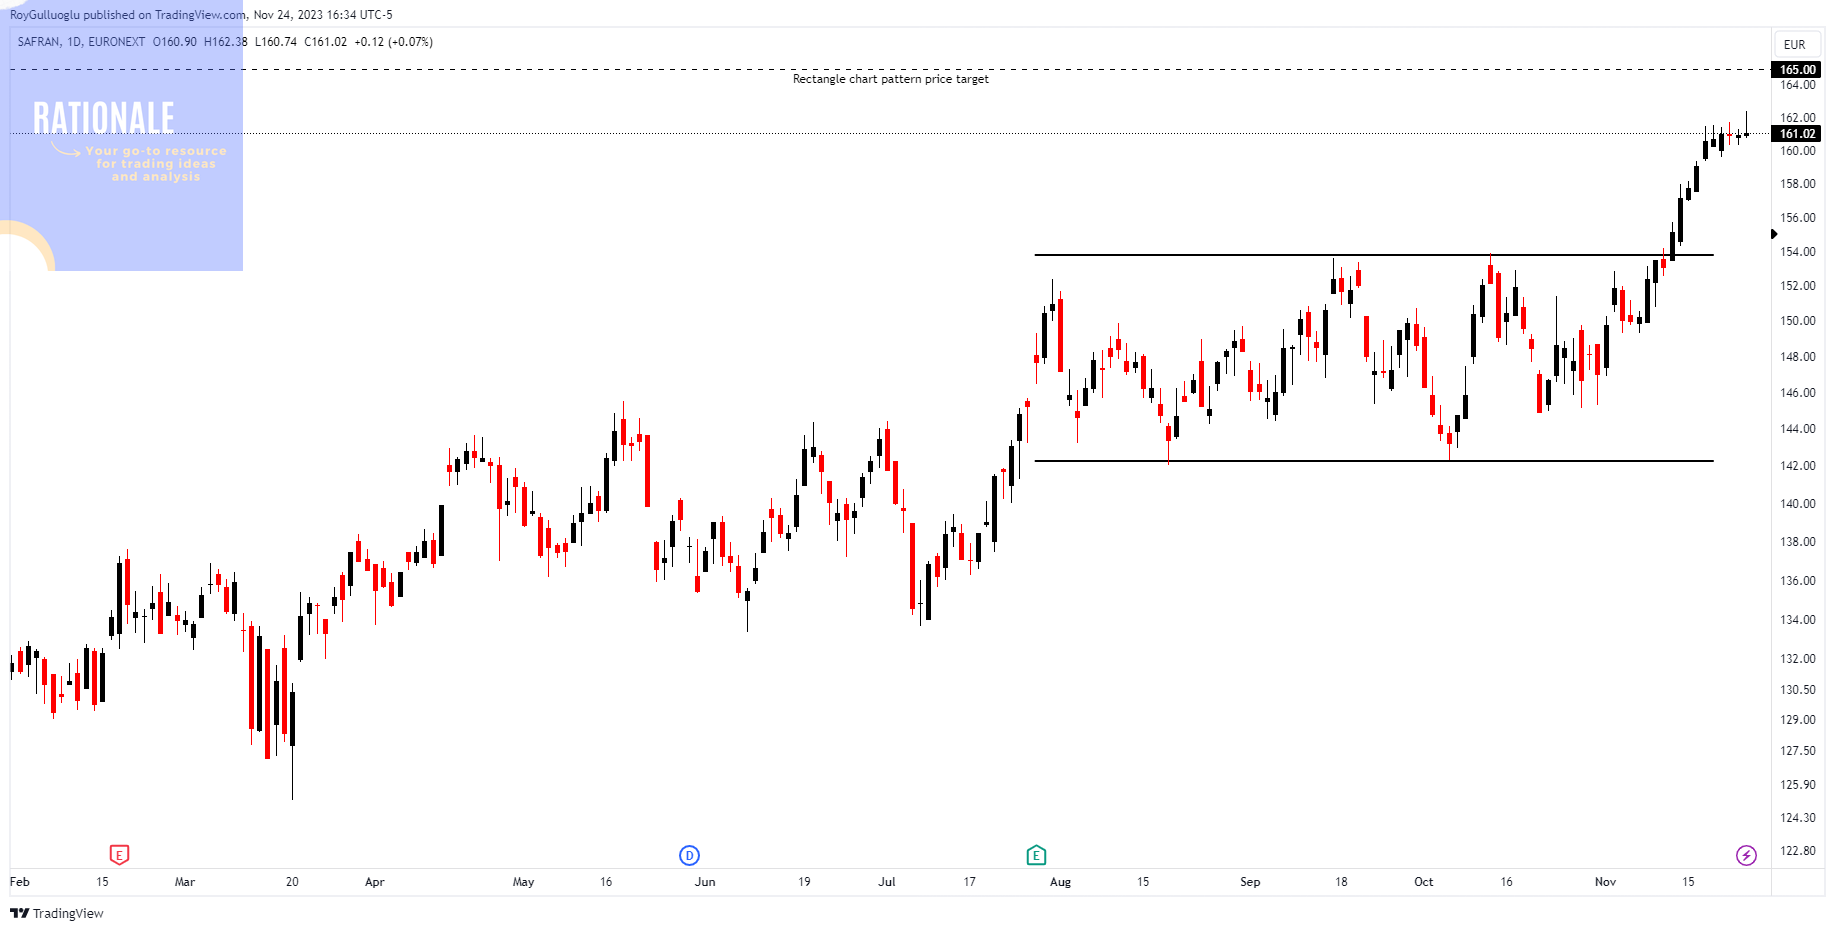
You can click the SAF ticker above to access the first report explaining the RATIONALE behind the trade idea.
Microsoft Corp-(MSFT/NASDAQ) - Long Idea
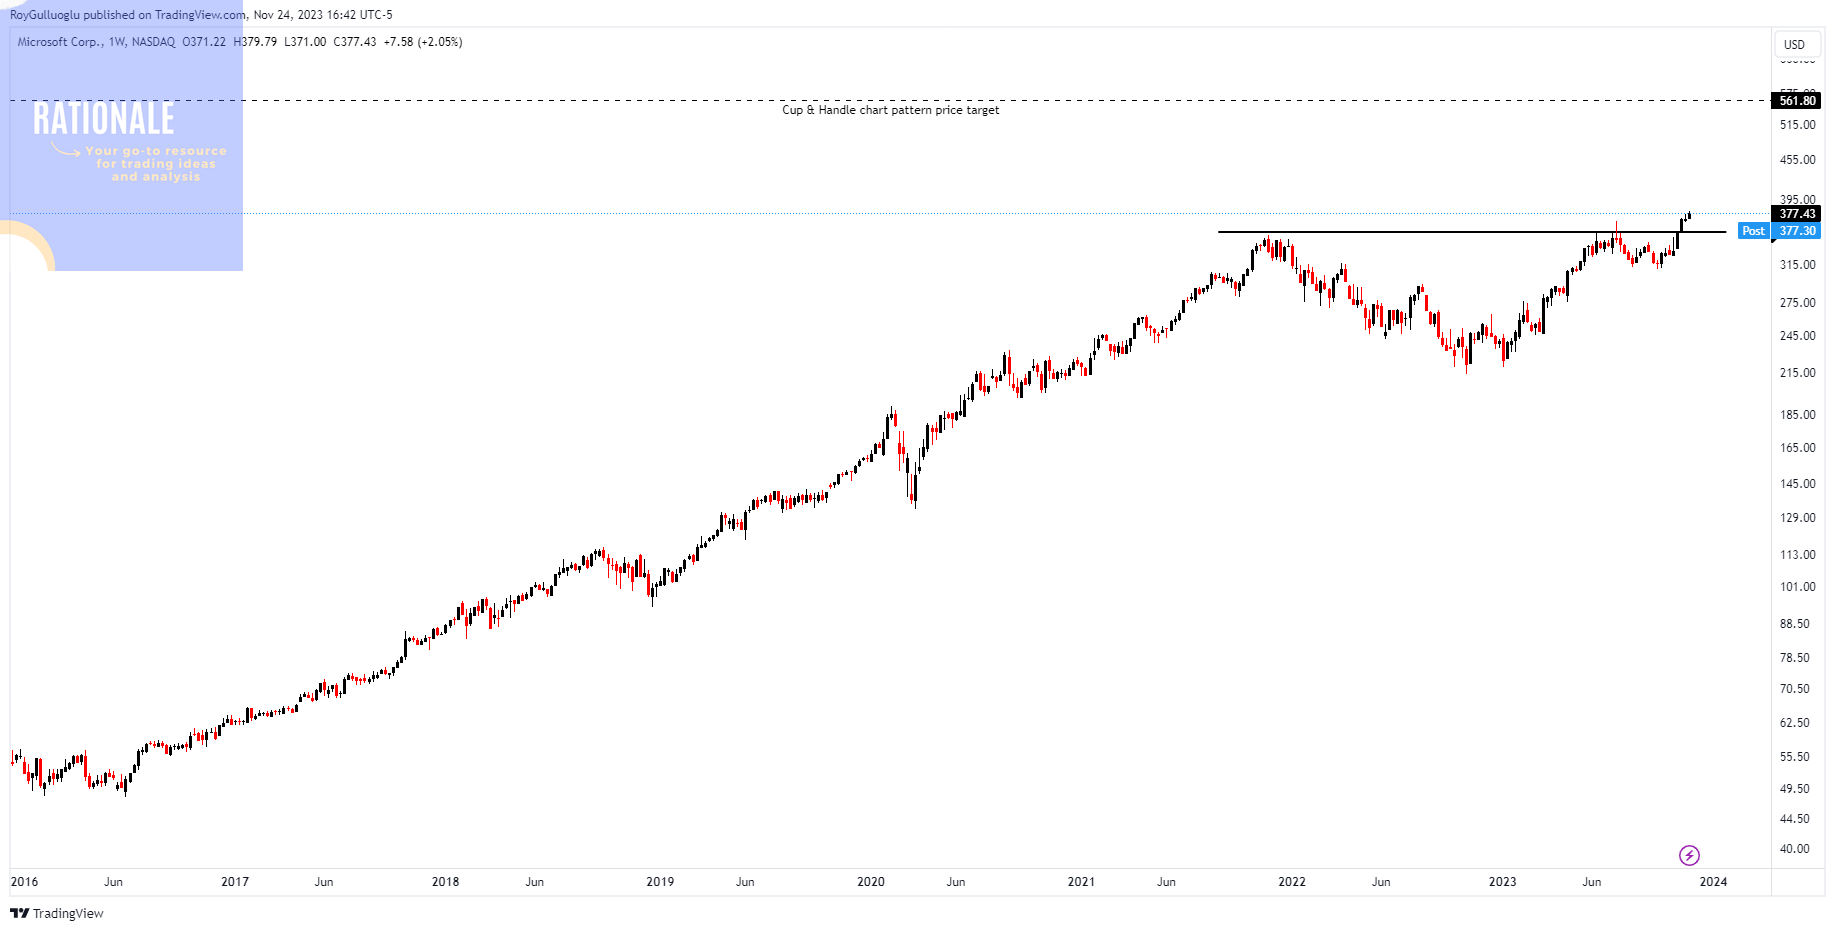
You can click the MSFT ticker above to access the first report explaining the RATIONALE behind the trade idea.
Walt Disney Company (The)-(DIS/NYS) - Long Idea
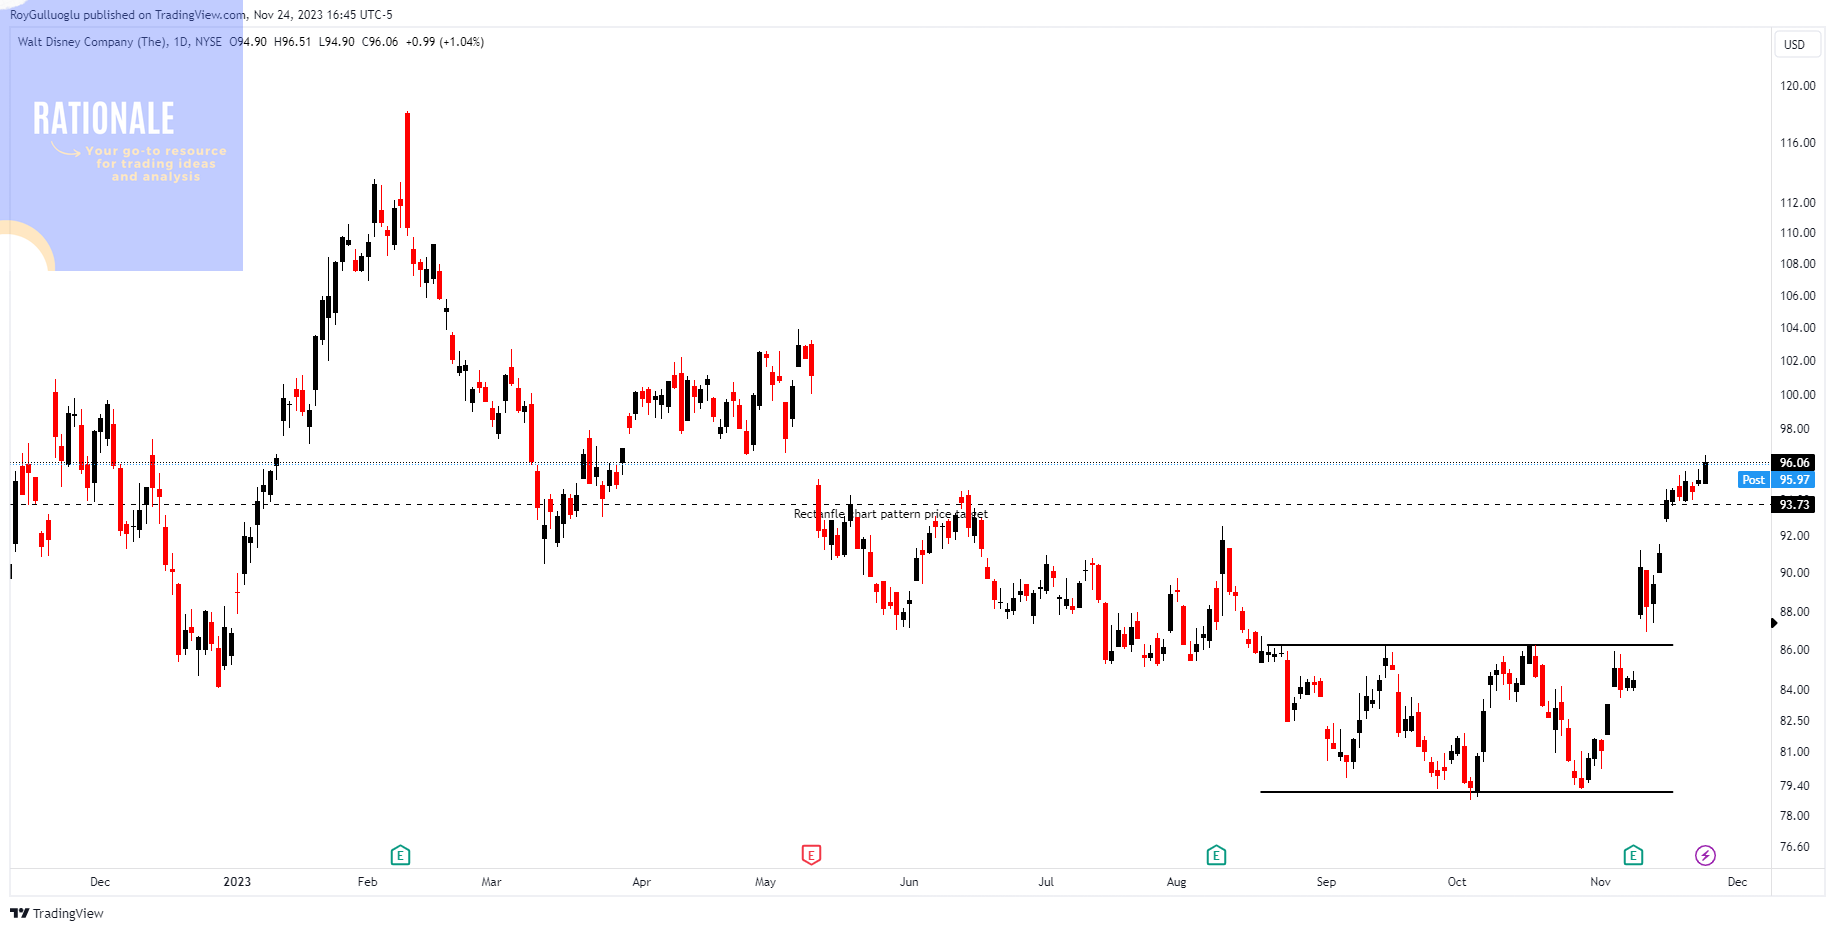
You can click the DIS ticker above to access the first report explaining the RATIONALE behind the trade idea.
The rectangle price target is reached.
Jbs s.a.-(JBSS3/BOVESPA)-Long Idea
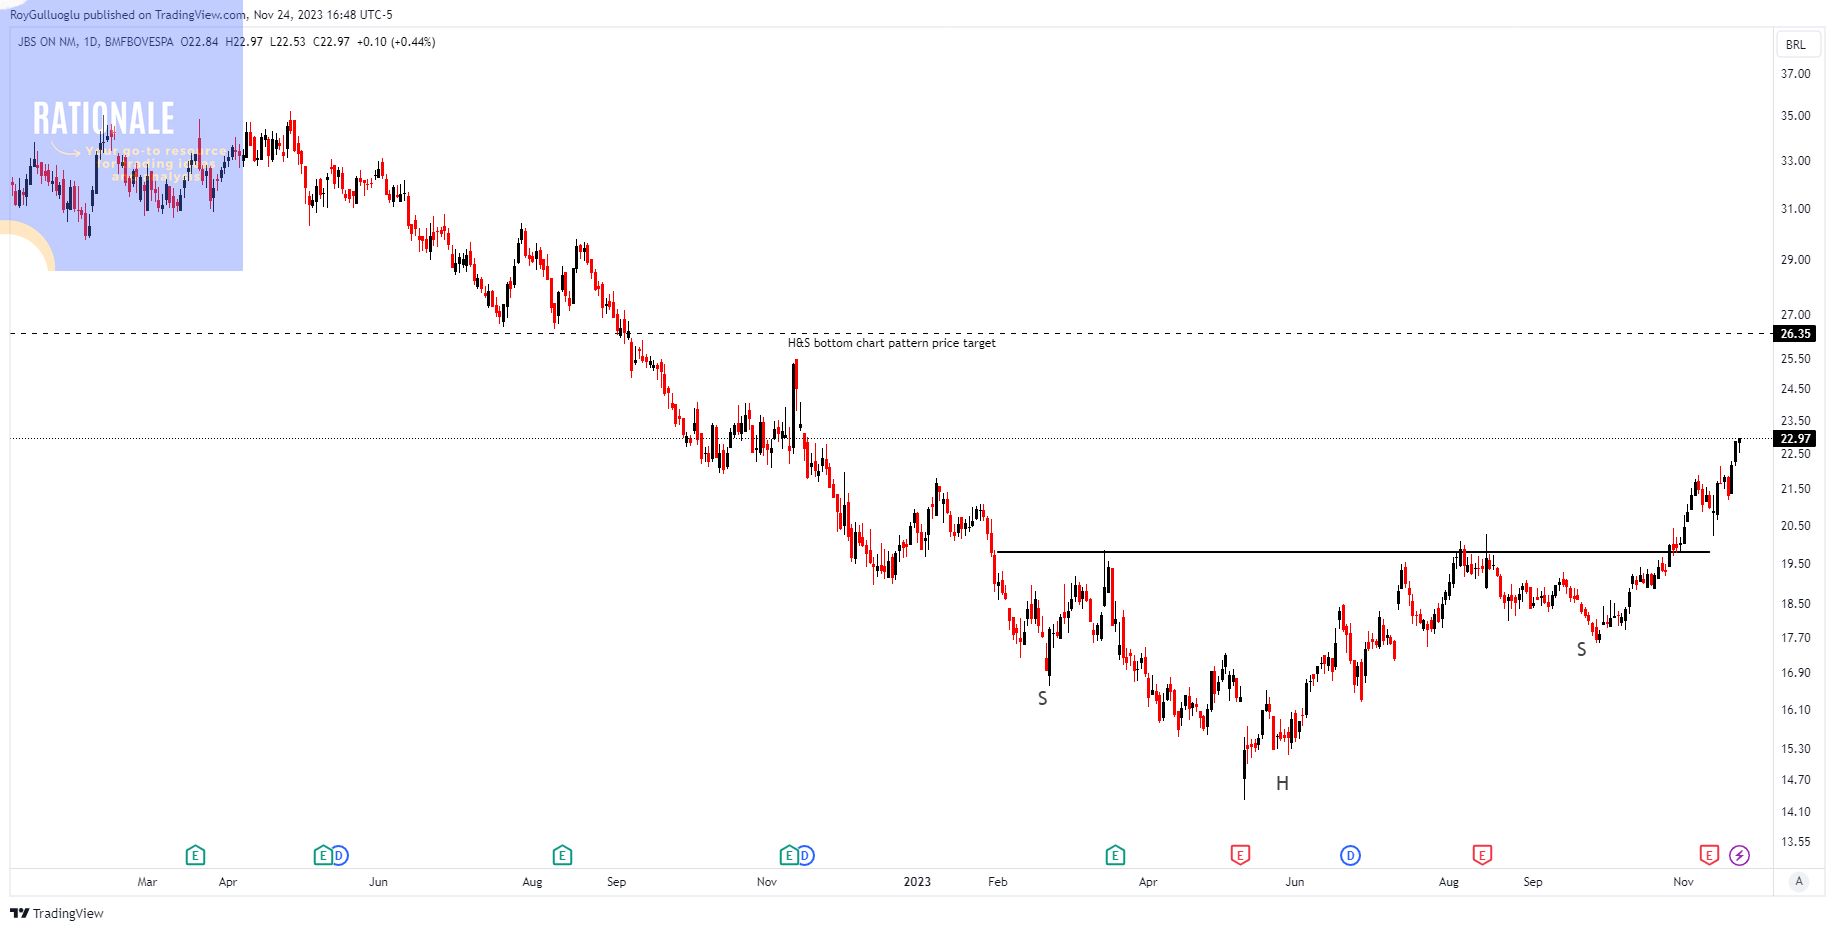
You can click the JBSS3 ticker above to access the first report explaining the RATIONALE behind the trade idea.
Alkami Technology Inc-(ALKT/NYSE)-Long Idea
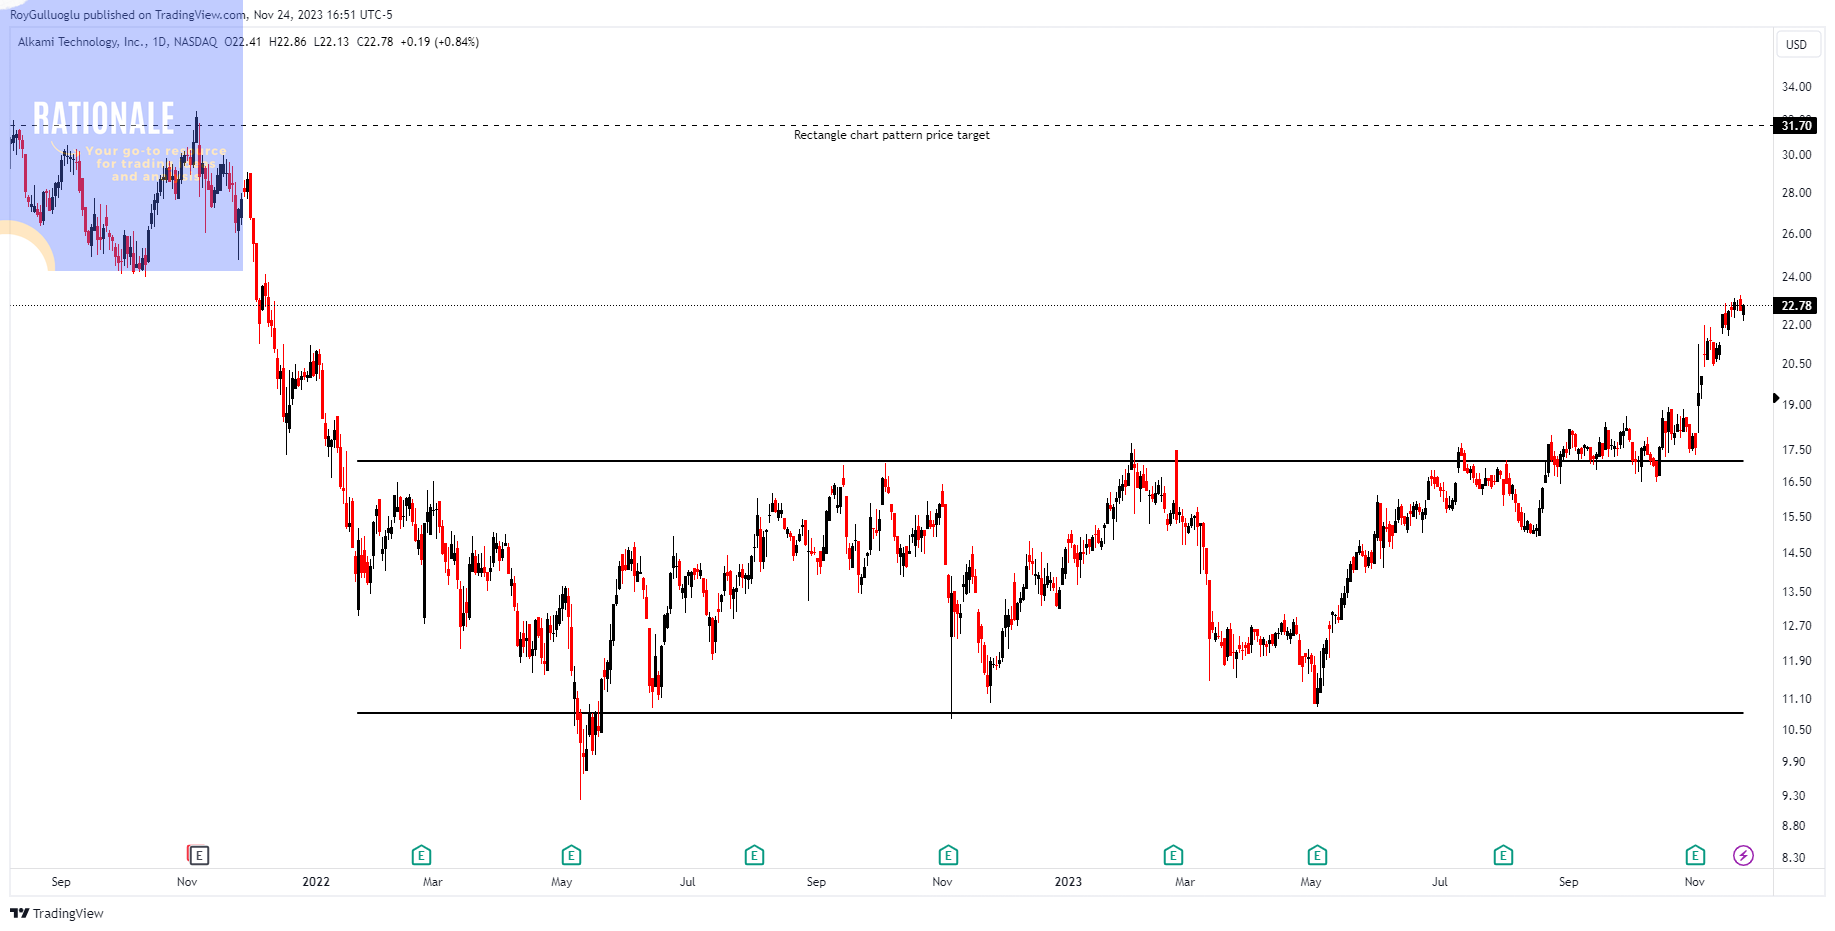
You can click the ALKT ticker above to access the first report explaining the RATIONALE behind the trade idea.
Adobe Inc-(ADBE/NASDAQ)-Long Idea
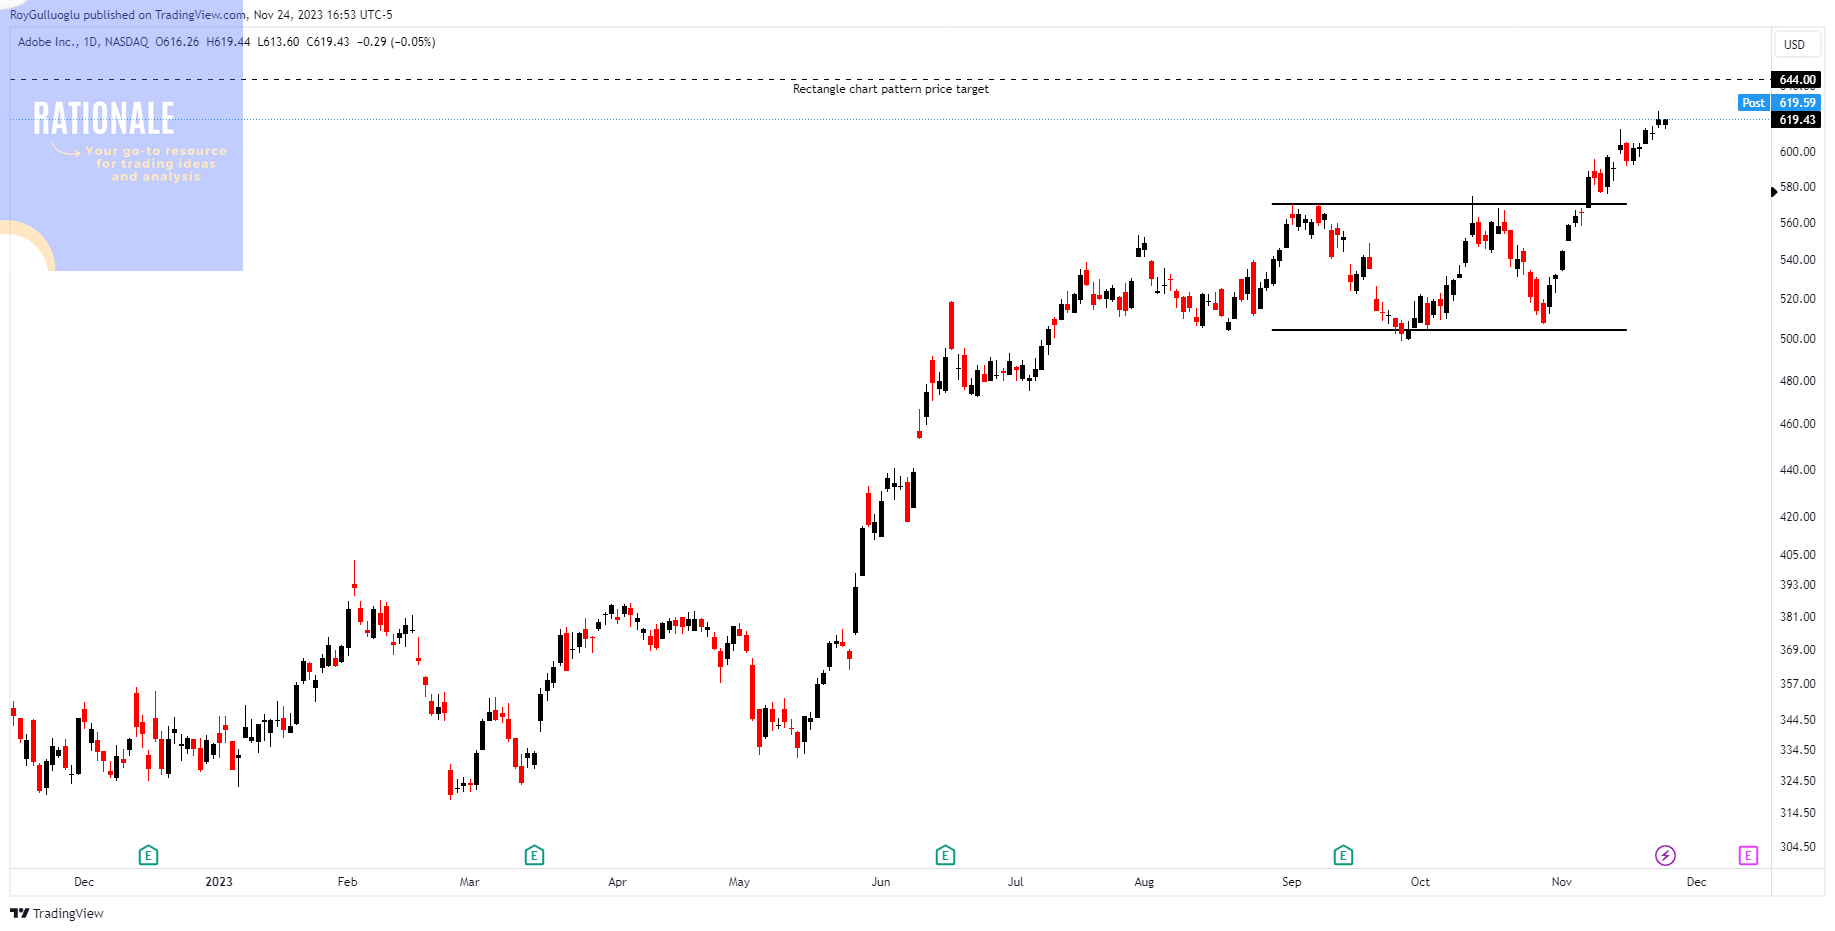
You can click the ADBE ticker above to access the first report explaining the RATIONALE behind the trade idea.
EnLink Midstream-(ENLC/NYSE)-Long Idea
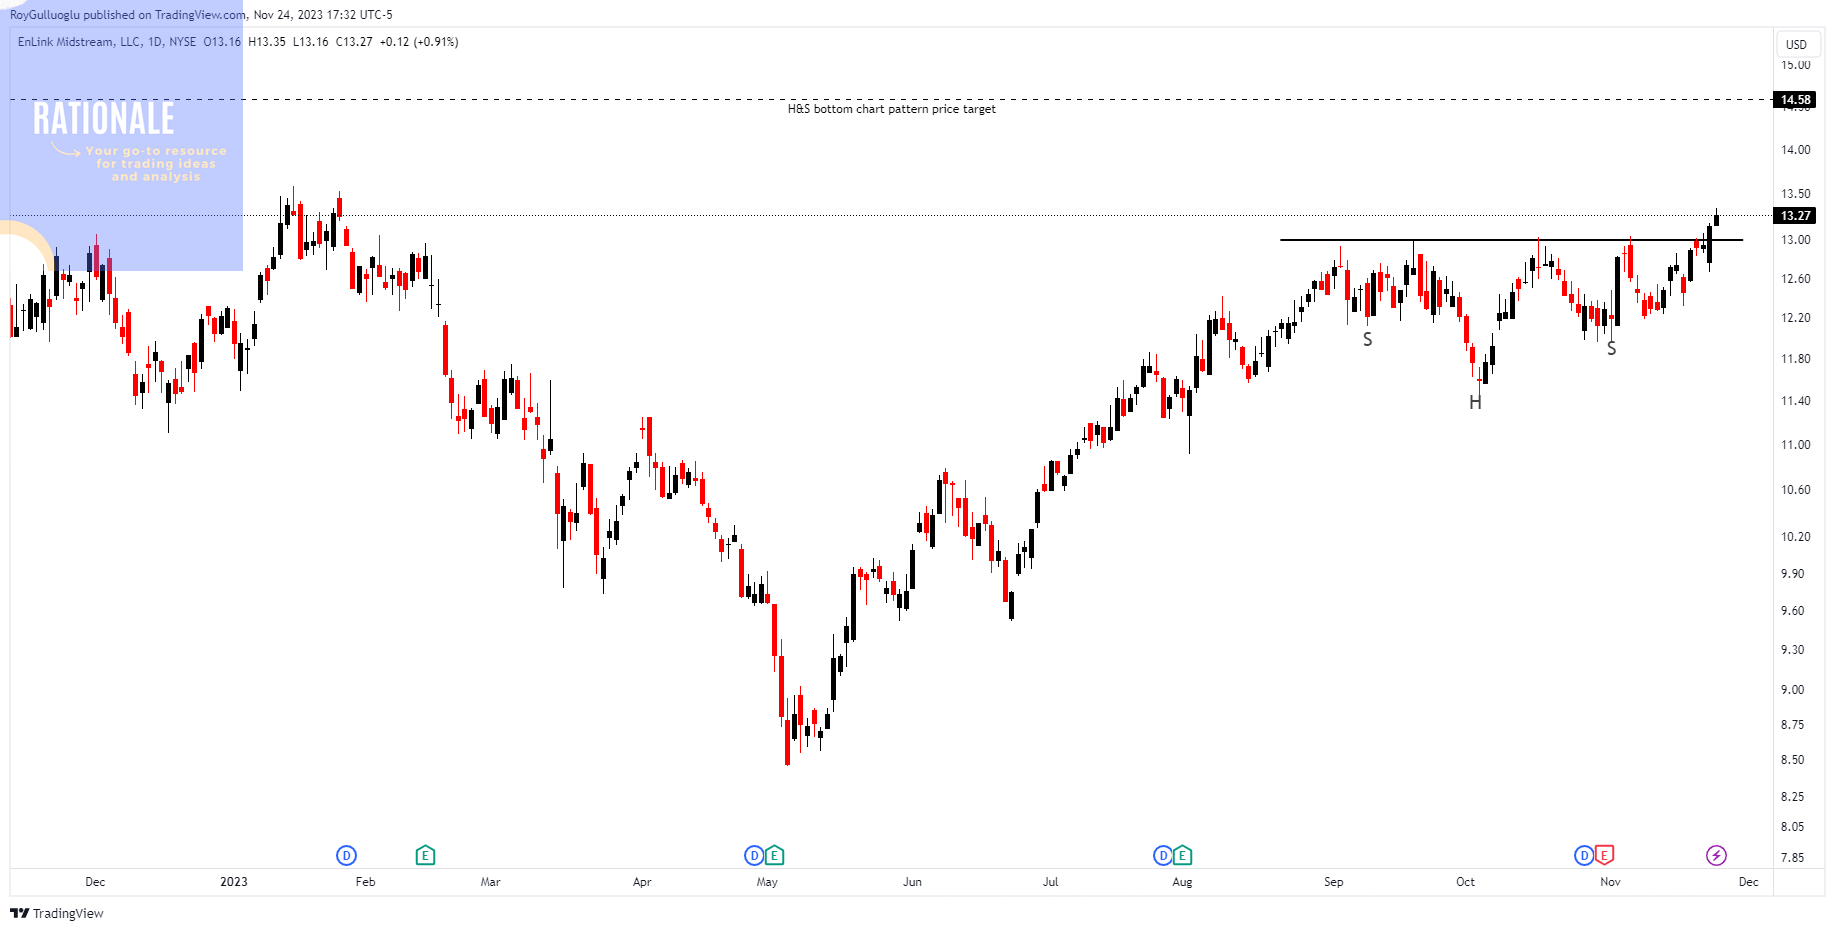
You can click the ENLC ticker above to access the first report explaining the RATIONALE behind the trade idea.
Palo Alto Networks, Inc-(PANW/NASDAQ)-Long Idea
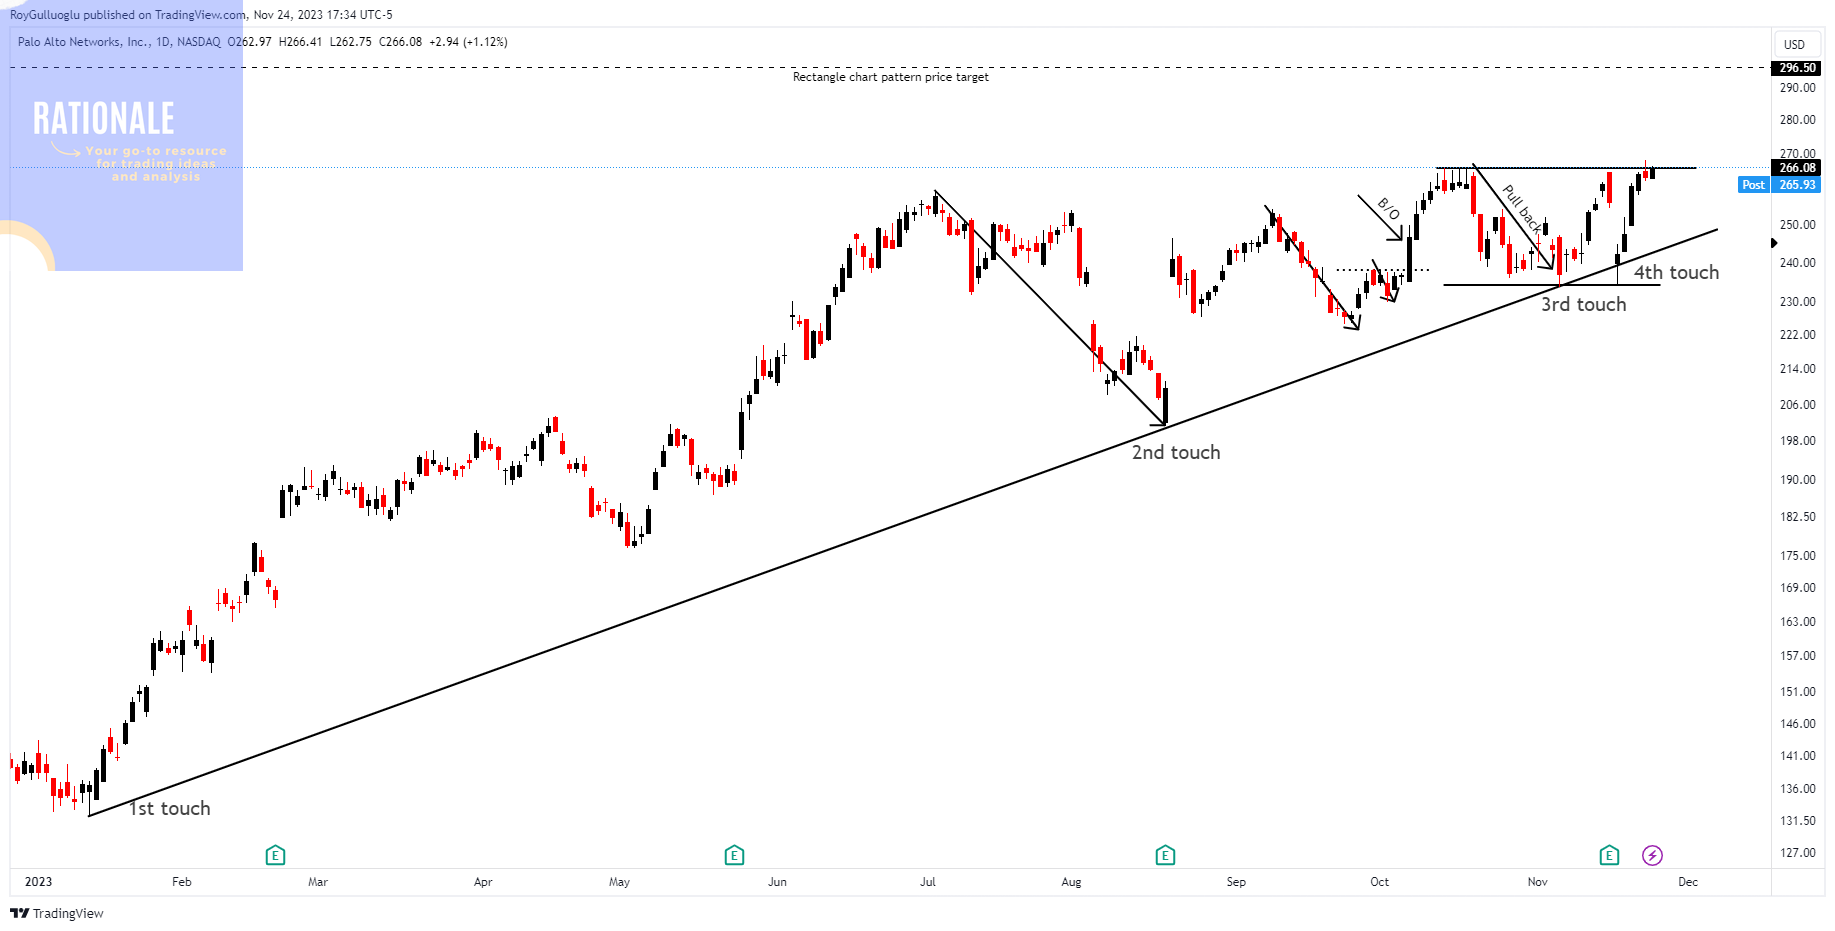
You can click the PANW ticker above to access the first report explaining the RATIONALE behind the trade idea.
Meta Platforms-(META/NASDAQ)-Long Idea
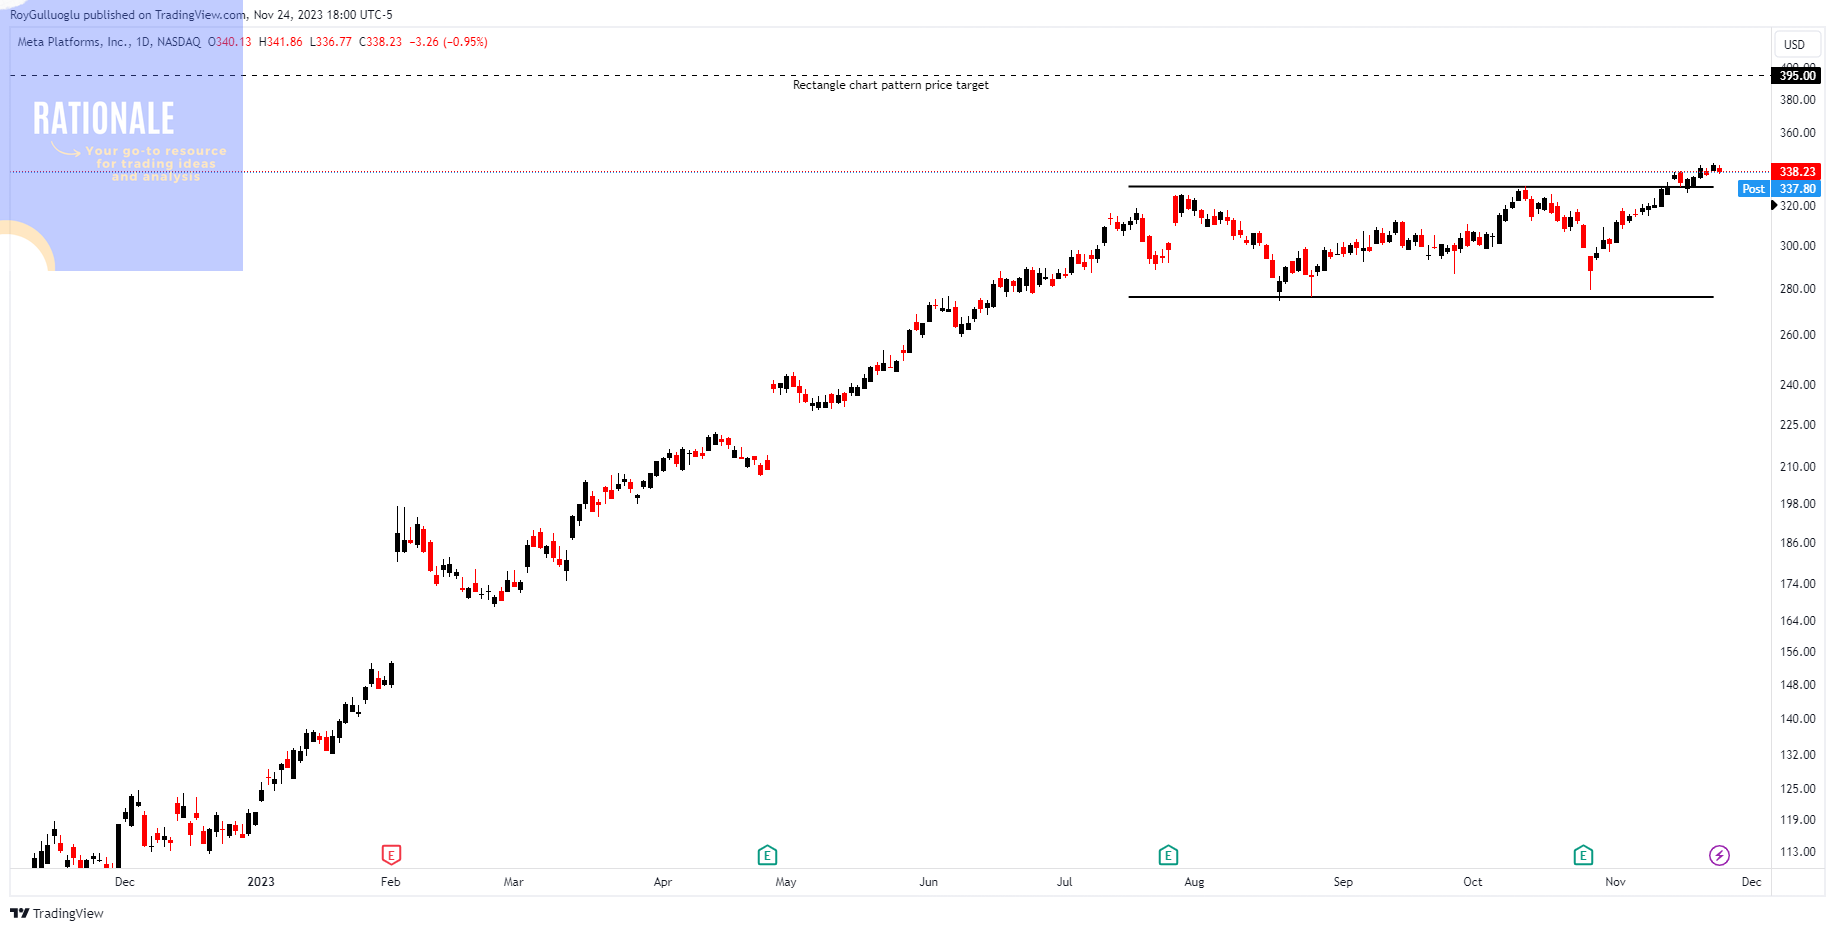
You can click the META ticker above to access the first report explaining the RATIONALE behind the trade idea.