


New setups
TICKERS: TILE(NASDAQ), EOLS(NASDAQ), NEE(NYSE), MGNI(NASDAQ), NEU(NYSE), SAHOL(BIST)
Interface, Inc.-(TILE/NASDAQ)-Long Idea
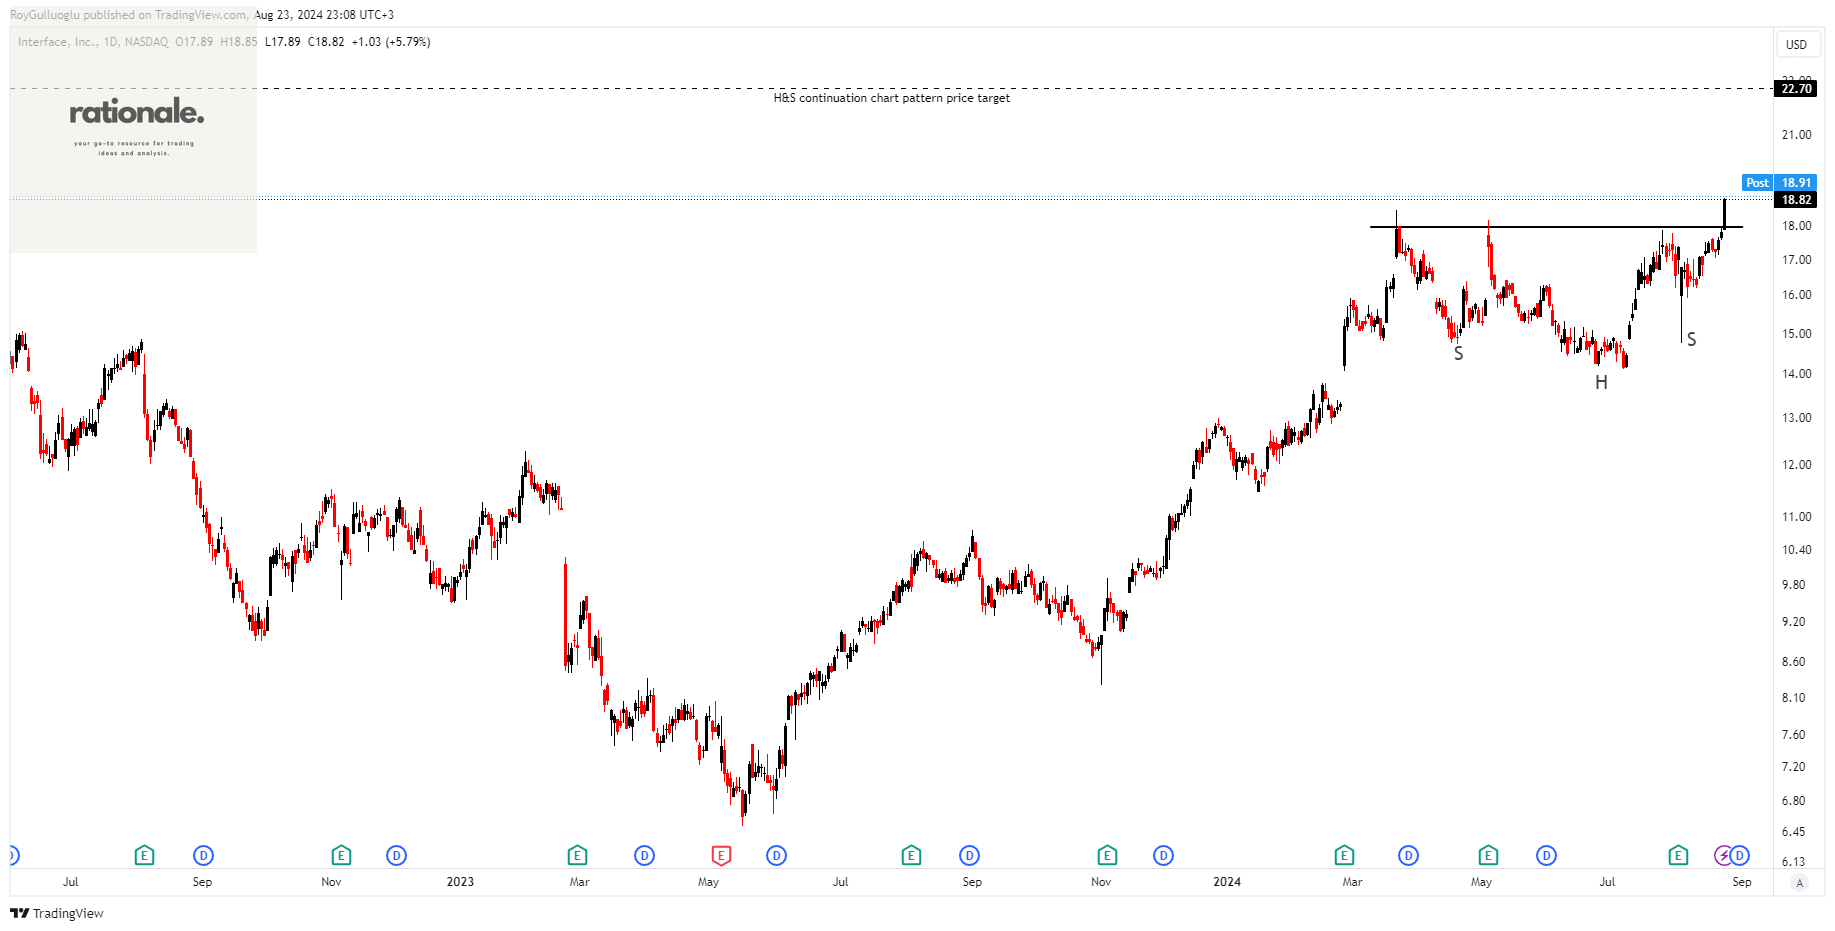
Interface, Inc. is a global company that designs, manufactures, and sells modular carpet products. Its operations are divided into two segments: the Americas (AMS) and Europe, Africa, Asia, and Australia (EAAA).
The above daily chart formed an approximately 4-month-long H&S continuation chart pattern as a bullish continuation after an uptrend.
The horizontal boundary at 17.95 levels acted as a resistance within this pattern.
A daily close above 18.49 levels validated the breakout from the 4-month-long H&S continuation chart pattern.
Based on this chart pattern, the potential price target is 22.7 levels.
TILE, classified under the "industrials" sector, falls under the “Small Cap - Value” stock category.
Evolus, Inc.-(EOLS/NASDAQ)-Long Idea
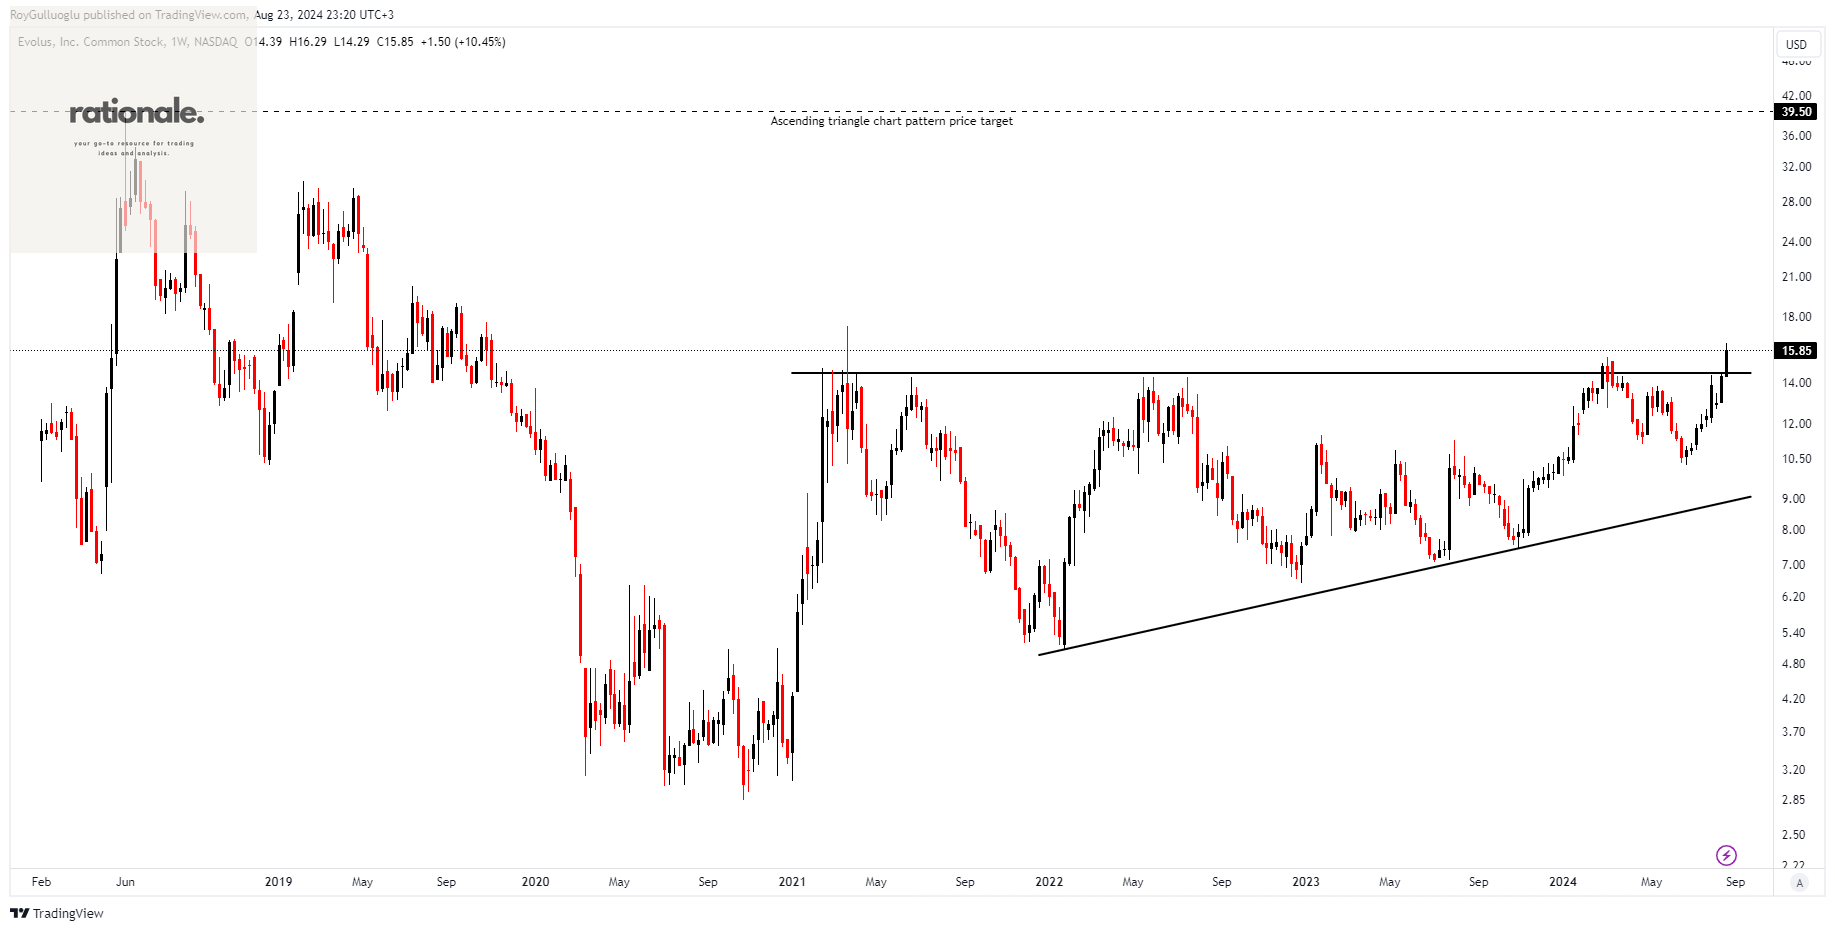
Evolus, Inc. is a performance beauty company specializing in providing products for the cash-pay aesthetic market across the United States, Canada, and Europe.
The above weekly chart formed an approximately 45-month-long ascending triangle chart pattern as a bullish continuation after an uptrend.
The horizontal boundary at 14.5 levels acted as a resistance within this pattern.
A daily close above 14.94 levels validated the breakout from the 45-month-long ascending triangle chart pattern.
Based on this chart pattern, the potential price target is 39.5 levels.
EOLS, classified under the "healthcare" sector, falls under the “Small Cap - Value” stock category.
NextEra Energy, Inc.-(NEE/NYSE)-Long Idea
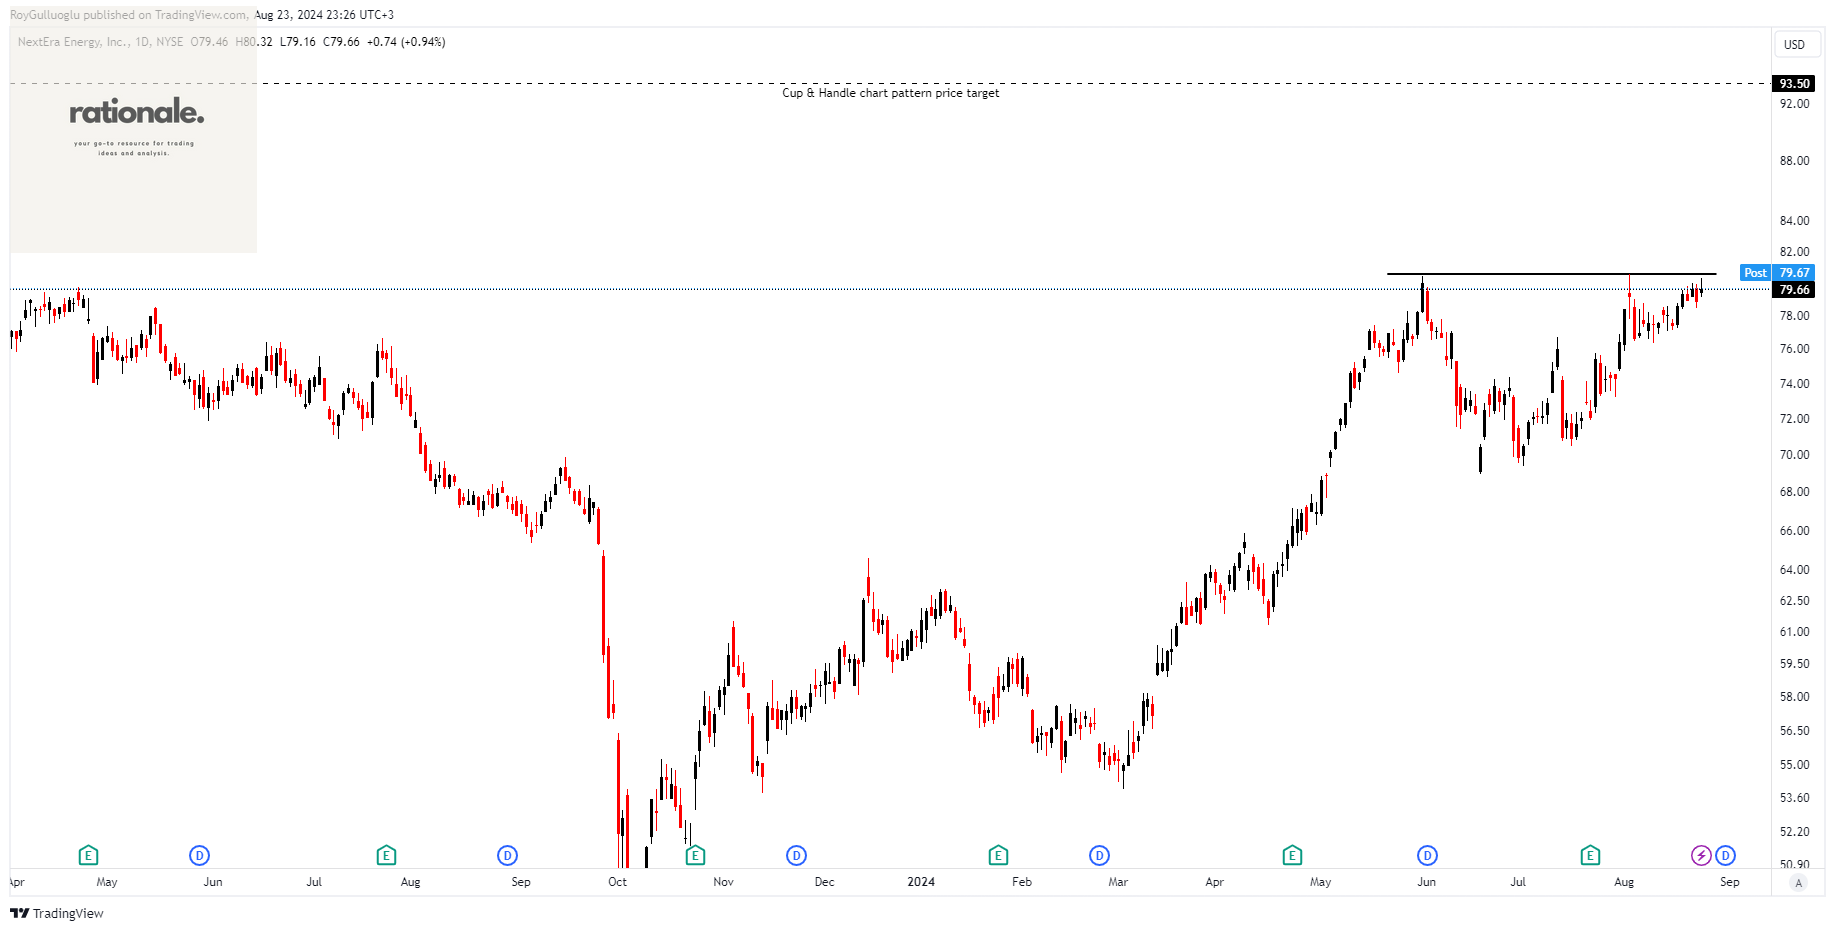
NextEra Energy, Inc., through its subsidiaries, generates, transmits, distributes, and sells electric power to retail and wholesale customers across North America.
The above daily chart formed an approximately 2-month-long cup & handle chart pattern as a bullish continuation after an uptrend.
The horizontal boundary at 80.6 levels acts as a resistance within this pattern.
A daily close above 83 levels would validate the breakout from the 2-month-long cup & handle chart pattern.
Based on this chart pattern, the potential price target is 93.5 levels.
NEE, classified under the "utilities" sector, falls under the “Large Cap - Income” stock category.
Magnite, Inc.-(MGNI/NASDAQ)-Long Idea
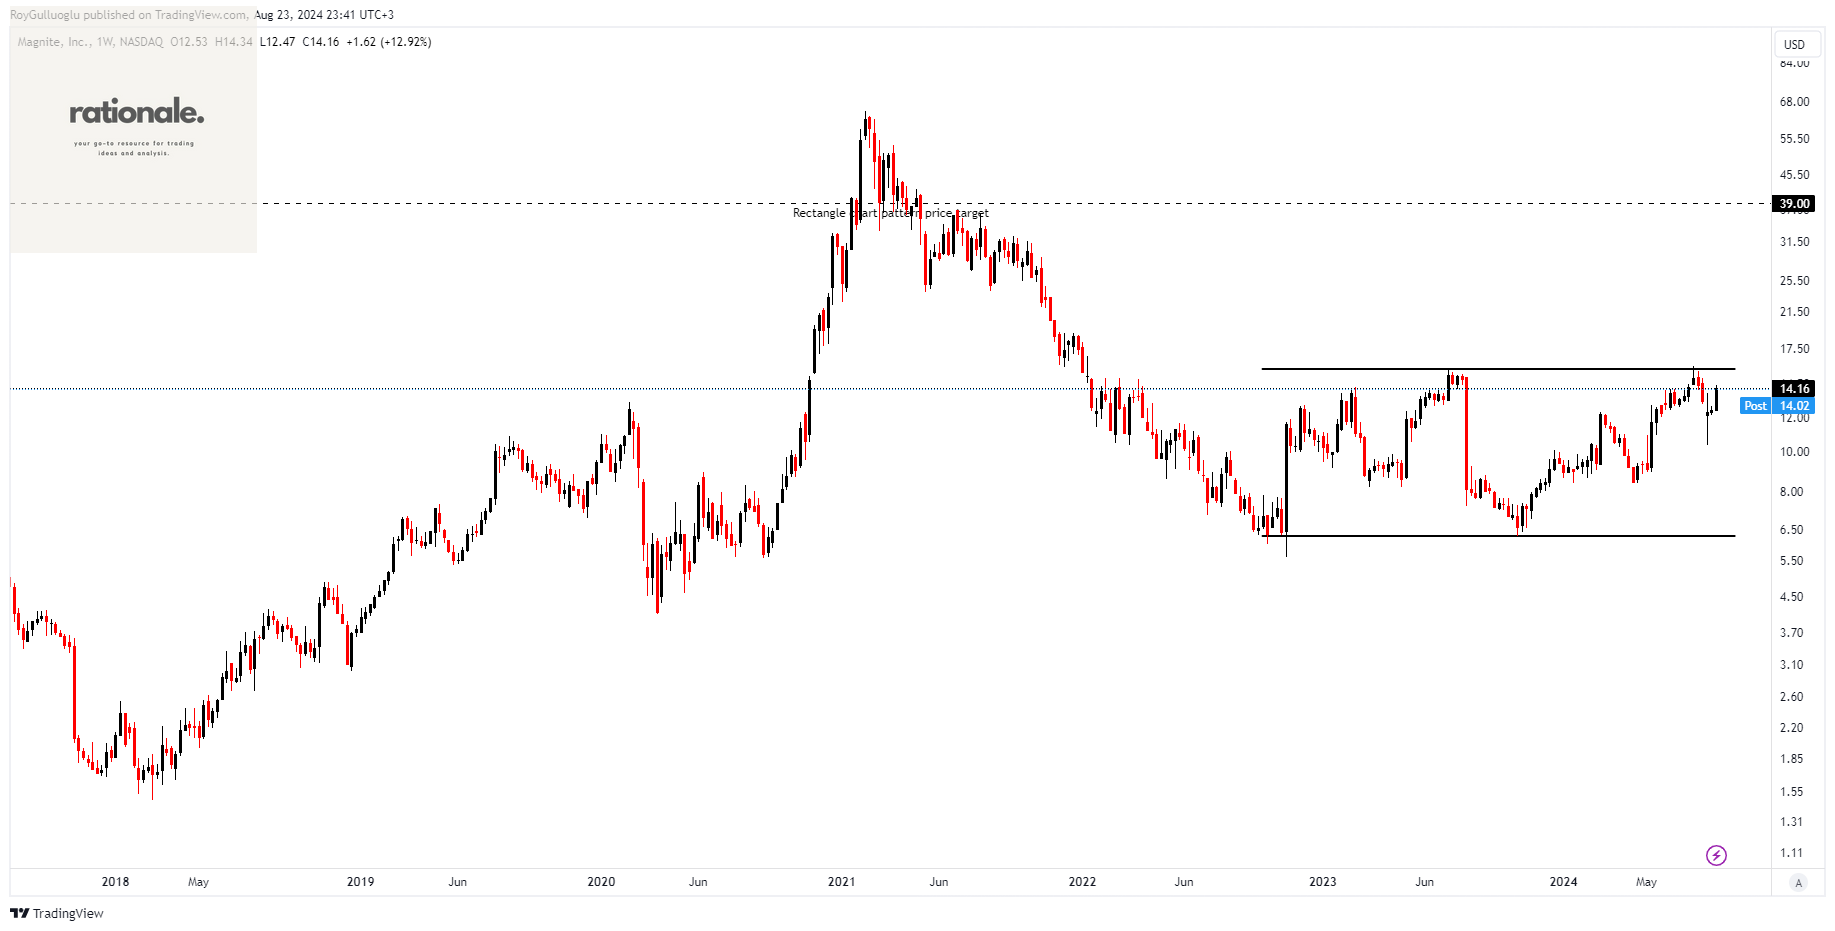
Magnite, Inc., along with its subsidiaries, operates an independent omni-channel sell-side advertising platform both in the United States and internationally.
The above weekly chart formed an approximately 22-month-long rectangle chart pattern as a bullish reversal after a downtrend.
The horizontal boundary at 15.66 levels acts as a resistance within this pattern.
A daily close above 16.13 levels would validate the breakout from the 22-month-long rectangle chart pattern.
Based on this chart pattern, the potential price target is 39 levels.
MGNI, classified under the "communication services" sector, falls under the “Small Cap - Growth” stock category.
NewMarket Corporation-(NEU/NYSE)-Long Idea
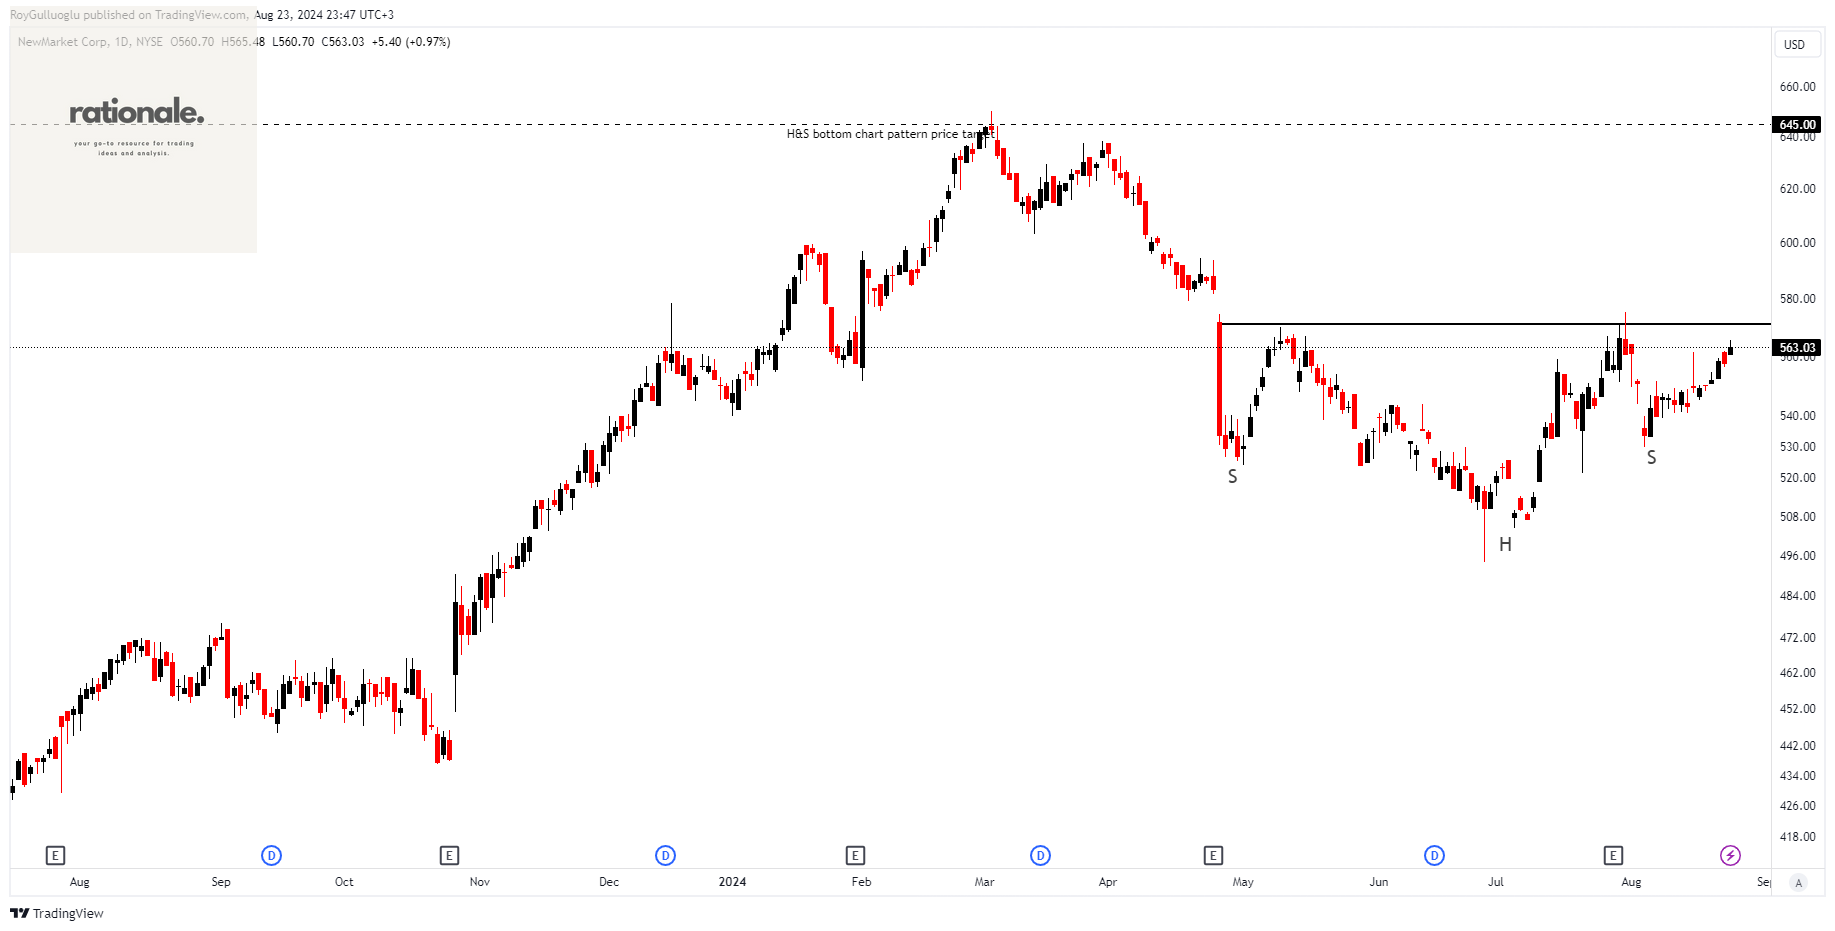
NewMarket Corporation, primarily through its subsidiaries, is engaged in the manufacturing and sale of petroleum additives.
The above weekly chart formed an approximately 3-month-long H&S bottom chart pattern as a bullish reversal after a downtrend.
The horizontal boundary at 571 levels acts as a resistance within this pattern.
A daily close above 588 levels would validate the breakout from the 3-month-long H&S bottom chart pattern.
Based on this chart pattern, the potential price target is 645 levels.
NEU, classified under the "healthcare" sector, falls under the “Small Cap - Value” stock category.
Haci Ömer Sabanci Holding A.S.-(SAHOL/BIST)-Short Idea
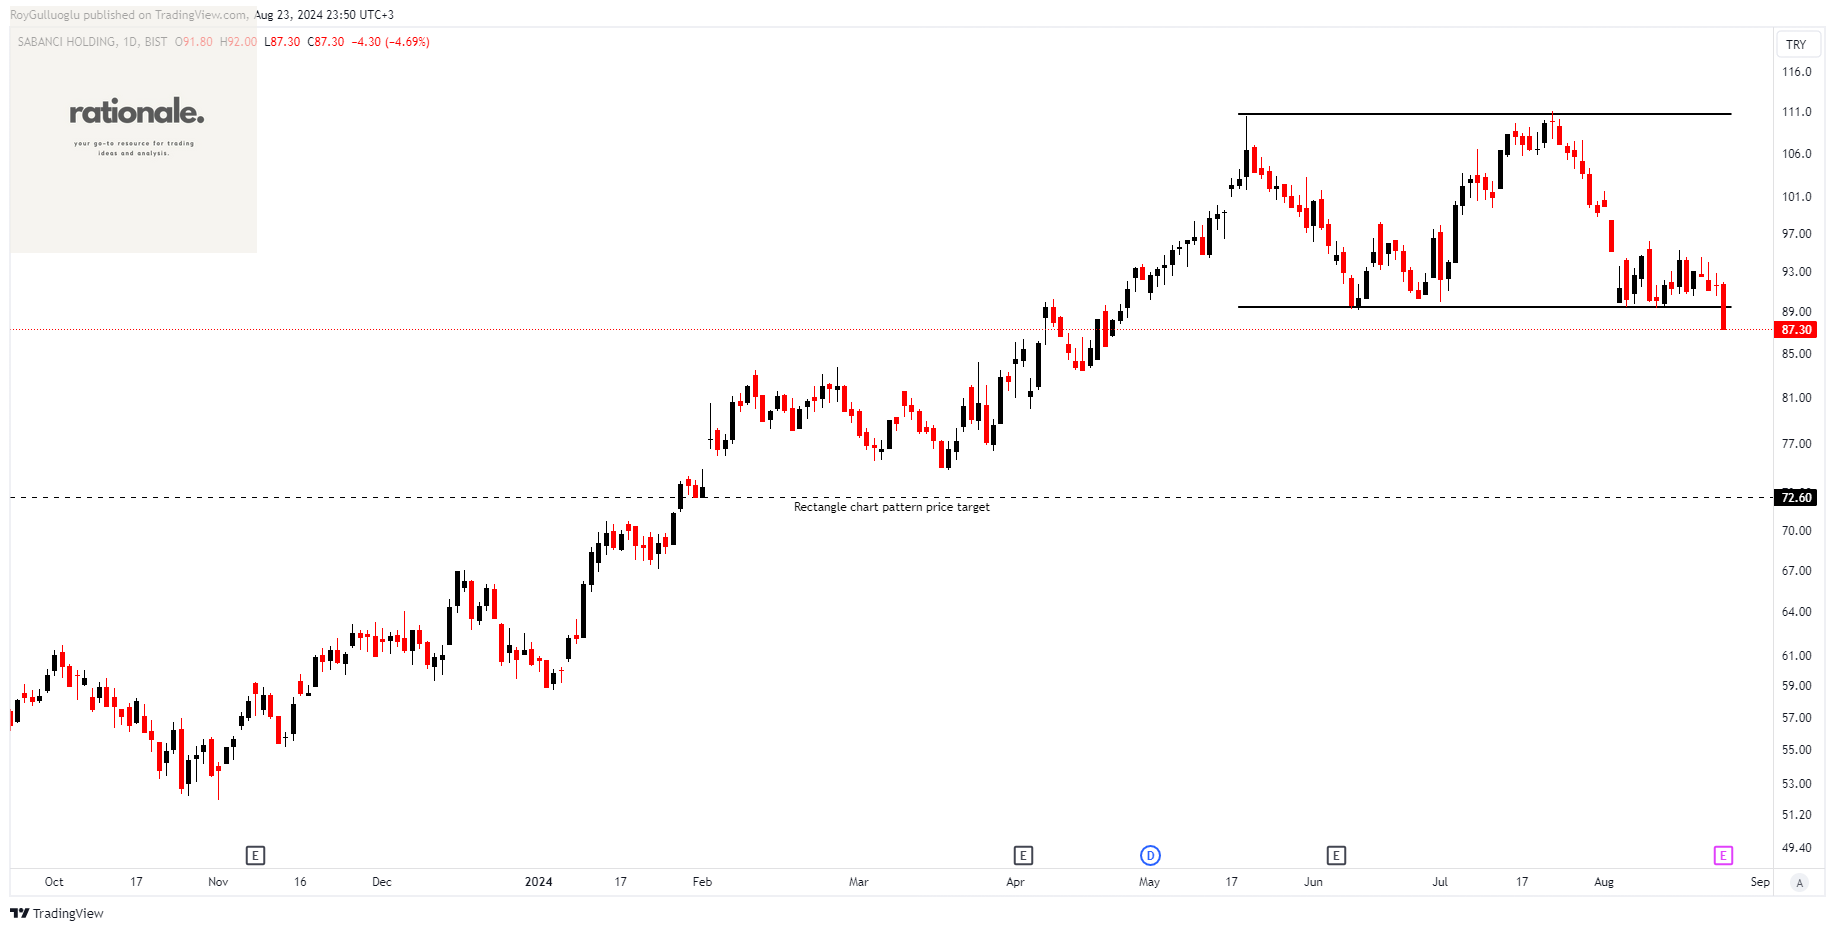
Haci Ömer Sabanci Holding A.S. operates globally across various sectors, including finance, manufacturing, and trading. The company is structured into several segments: Banking, Financial Services, Industry, Building Materials, Energy, Retail, and Other.
The above weekly chart formed an approximately 2-month-long rectangle chart pattern as a bearish reversal after an uptrend.
The horizontal boundary at 89.5 levels acted as a support within this pattern.
A daily close below 86.81 levels would validate the breakout from the 2-month-long rectangle chart pattern.
Based on this chart pattern, the potential price target is 72.6 levels.
SAHOL, classified under the "financial services" sector, falls under the “Mid Cap - Income” stock category.
Teşekkürler Roy