

Trade Ideas Equities
MU(NASDAQ), TW(NASDAQ), EEFT(NASDAQ), DRVN(NASDAQ), AXTA(NYSE), FNF(NYSE)

Micron Technology, Inc.-(MU/NASDAQ)-Short Idea
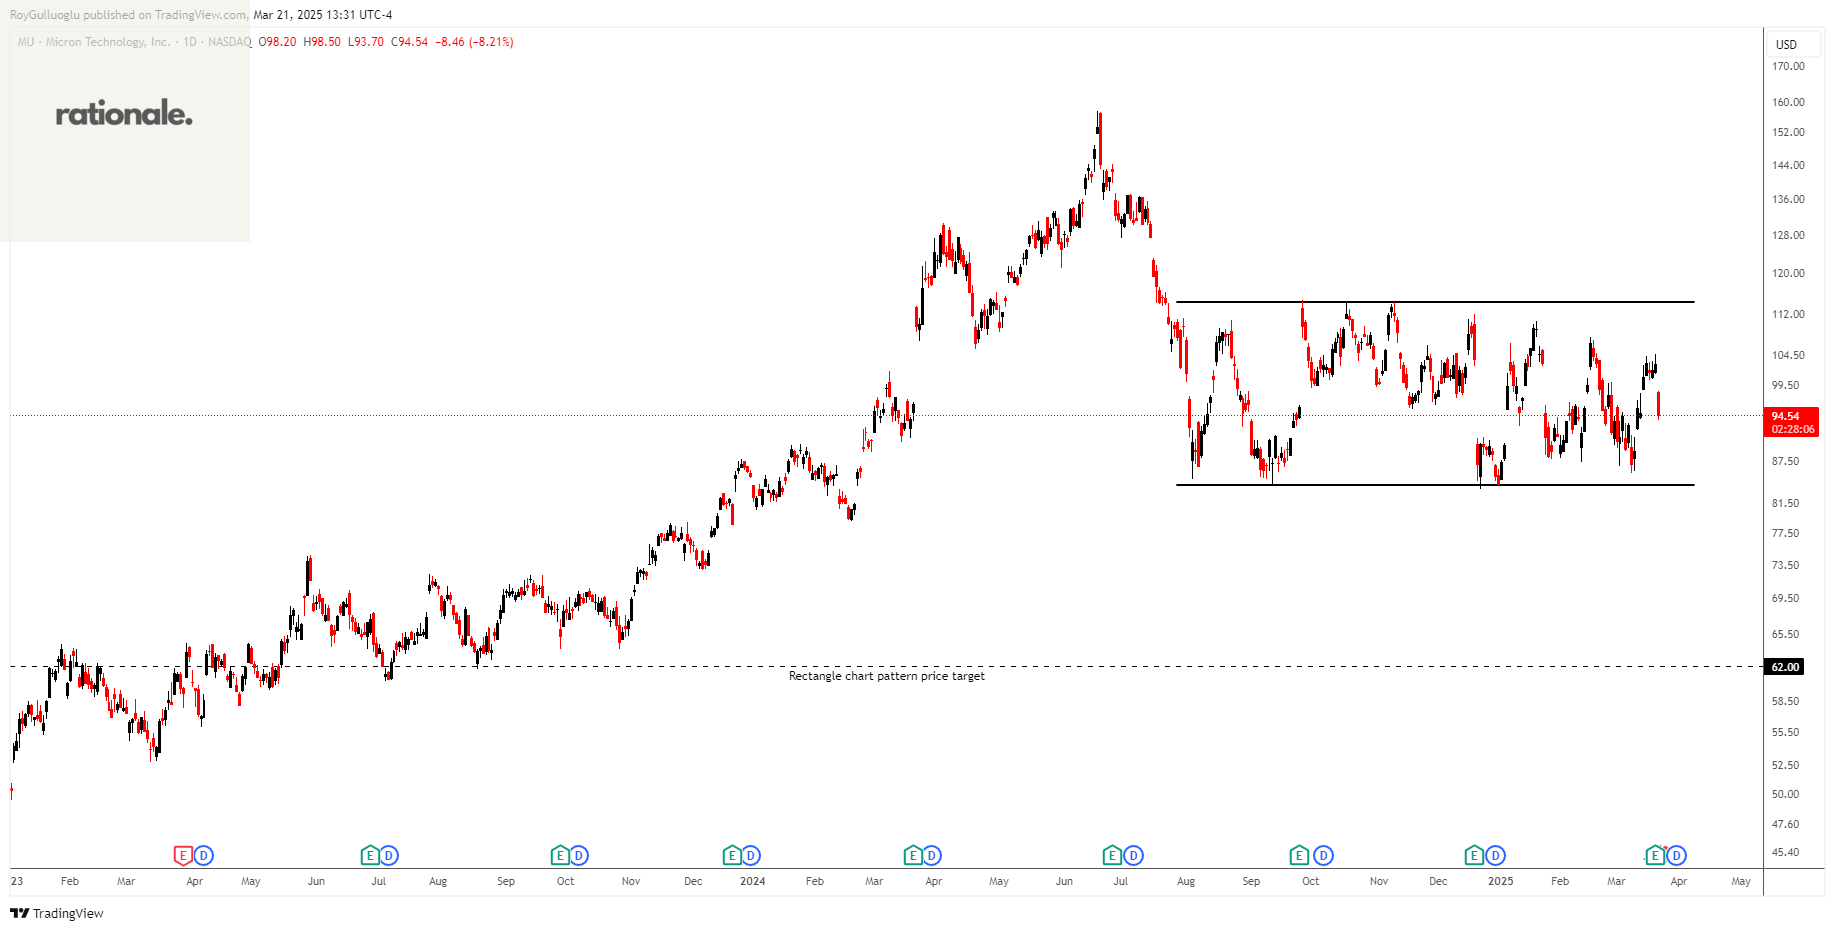
Micron Technology, Inc. designs, develops, manufactures, and sells memory and storage products in the United States, Taiwan, Mainland China, rest of the Asia Pacific, Hong Kong, Japan, Europe, and internationally.
The above weekly chart formed an approximately 5-month-long rectangle chart pattern as a bearish continuation after a downtrend.
The horizontal boundary at 84.04 levels acted as a support within this pattern.
A daily close below 81.52 levels would validate the breakdown from the 5-month-long rectangle chart pattern.
Based on this chart pattern, the potential price target is 62 levels.
MU, classified under the "technology" sector, falls under the “Large Cap - Growth” stock category.
Tradeweb Markets Inc.-(TW/NASDAQ)-Long Idea
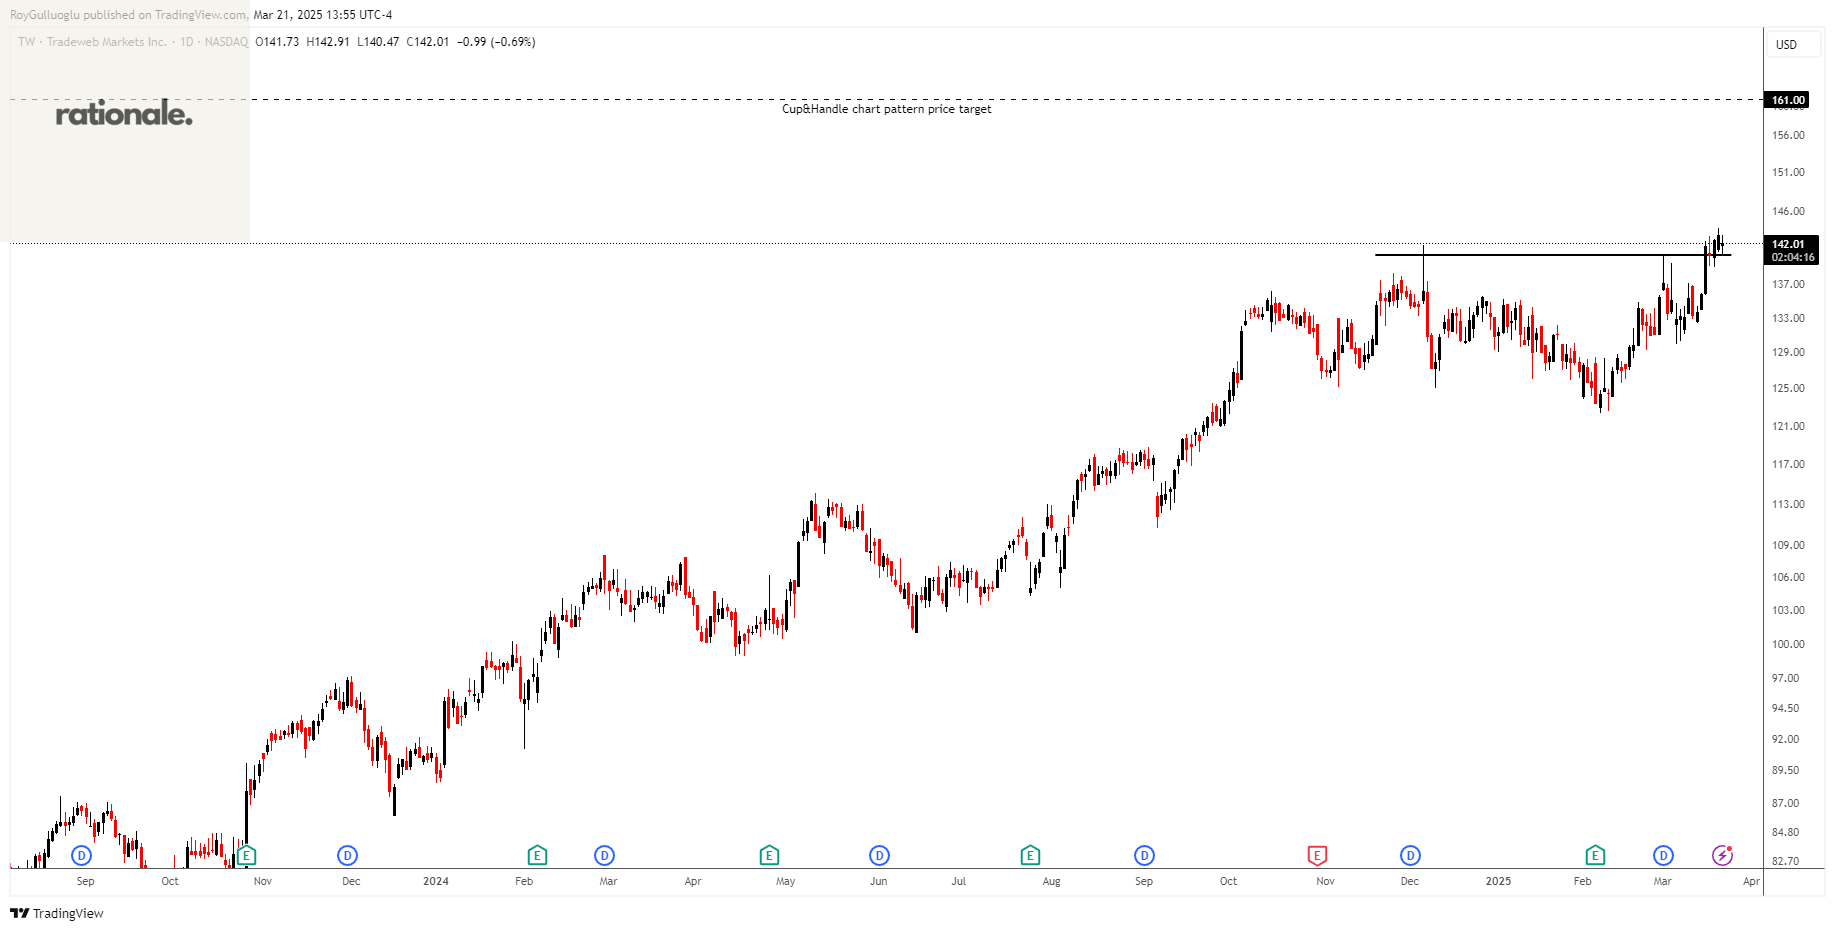
Tradeweb Markets Inc., together with its subsidiaries, builds and operates electronic marketplaces worldwide.
The above daily chart formed an approximately 2-month-long cup & handle chart pattern as a bullish continuation after an uptrend.
The horizontal boundary at 140.44 levels acts as a resistance within this pattern.
A daily close above 144.65 levels would validate the breakout from the 2-month-long cup & handle chart pattern.
Based on this chart pattern, the potential price target is 161 levels.
TW, classified under the "financial services" sector, falls under the “Large Cap - Income” stock category.
Euronet Worldwide, Inc.-(EEFT/NASDAQ)-Long Idea
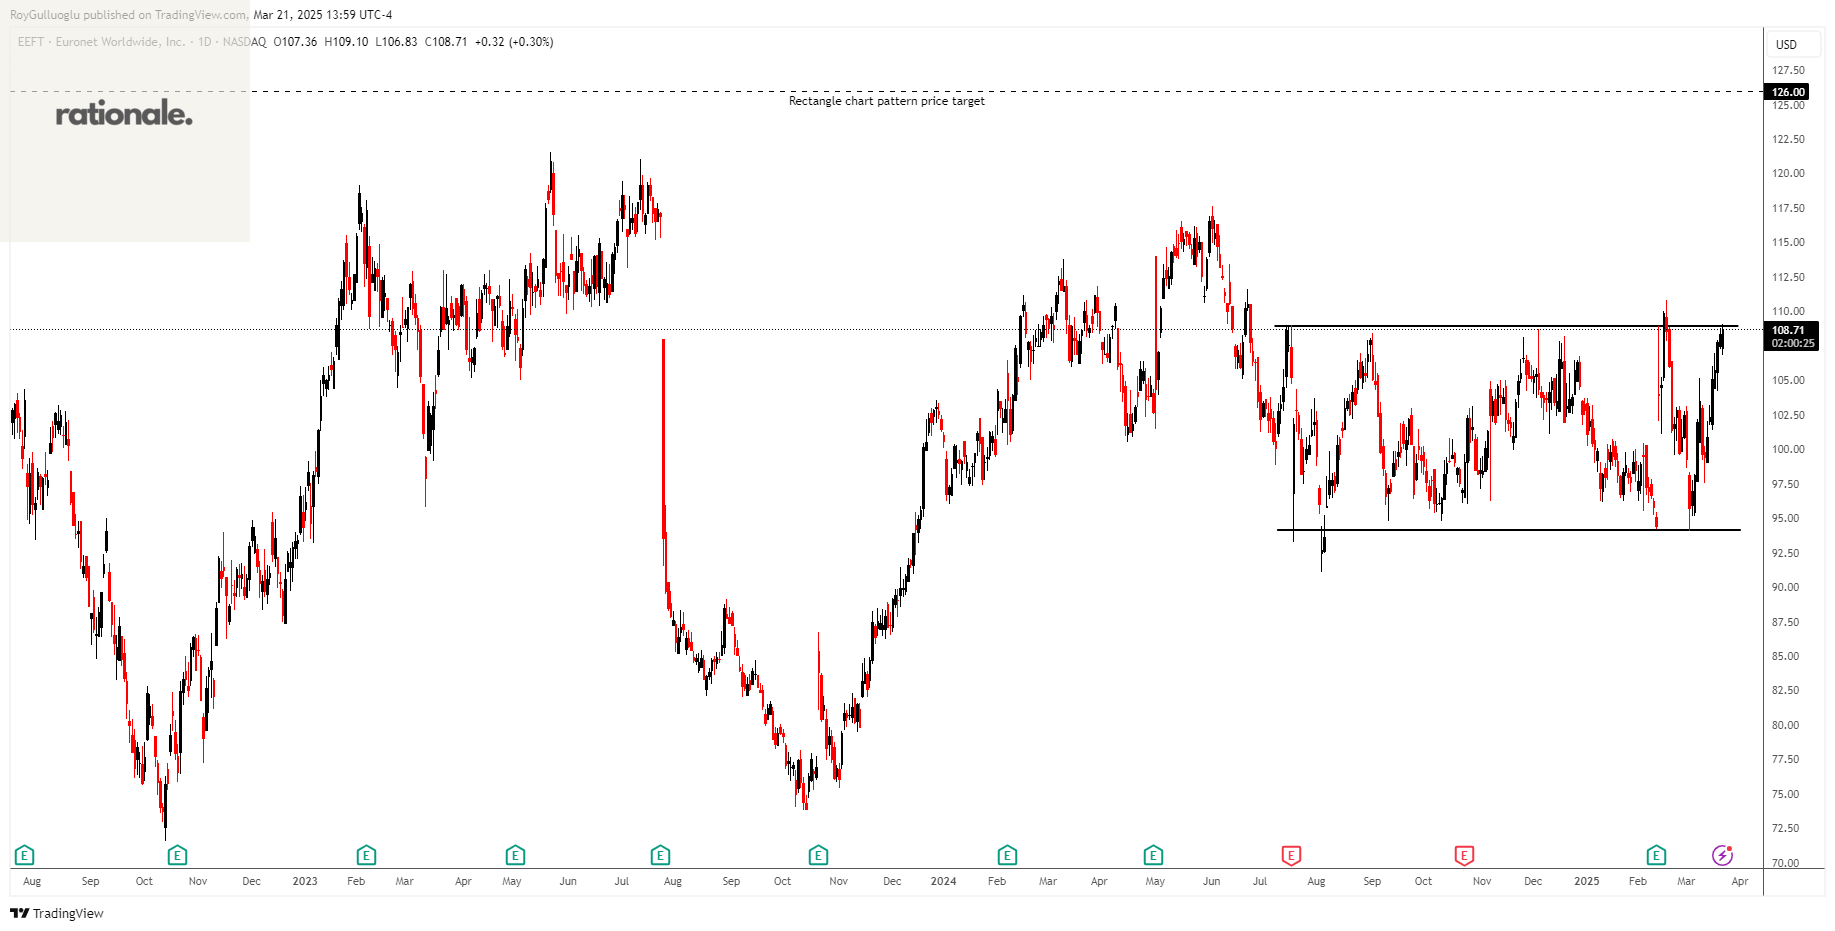
Euronet Worldwide, Inc. provides payment and transaction processing and distribution solutions to financial institutions, retailers, service providers, and individual consumers worldwide.
The above daily chart formed an approximately 6-month-long rectangle chart pattern as a bullish reversal after a downtrend.
The horizontal boundary at 108.9 levels acts as a support within this pattern.
A daily close below 112.167 levels would validate the breakdown from the 6-month-long rectangle chart pattern.
Based on this chart pattern, the potential price target is 126 levels.
EEFT, classified under the "consumer cyclical" sector, falls under the “Mid Cap - Growth” stock category.
Driven Brands Holdings Inc.-(DRVN/NASDAQ)-Long Idea
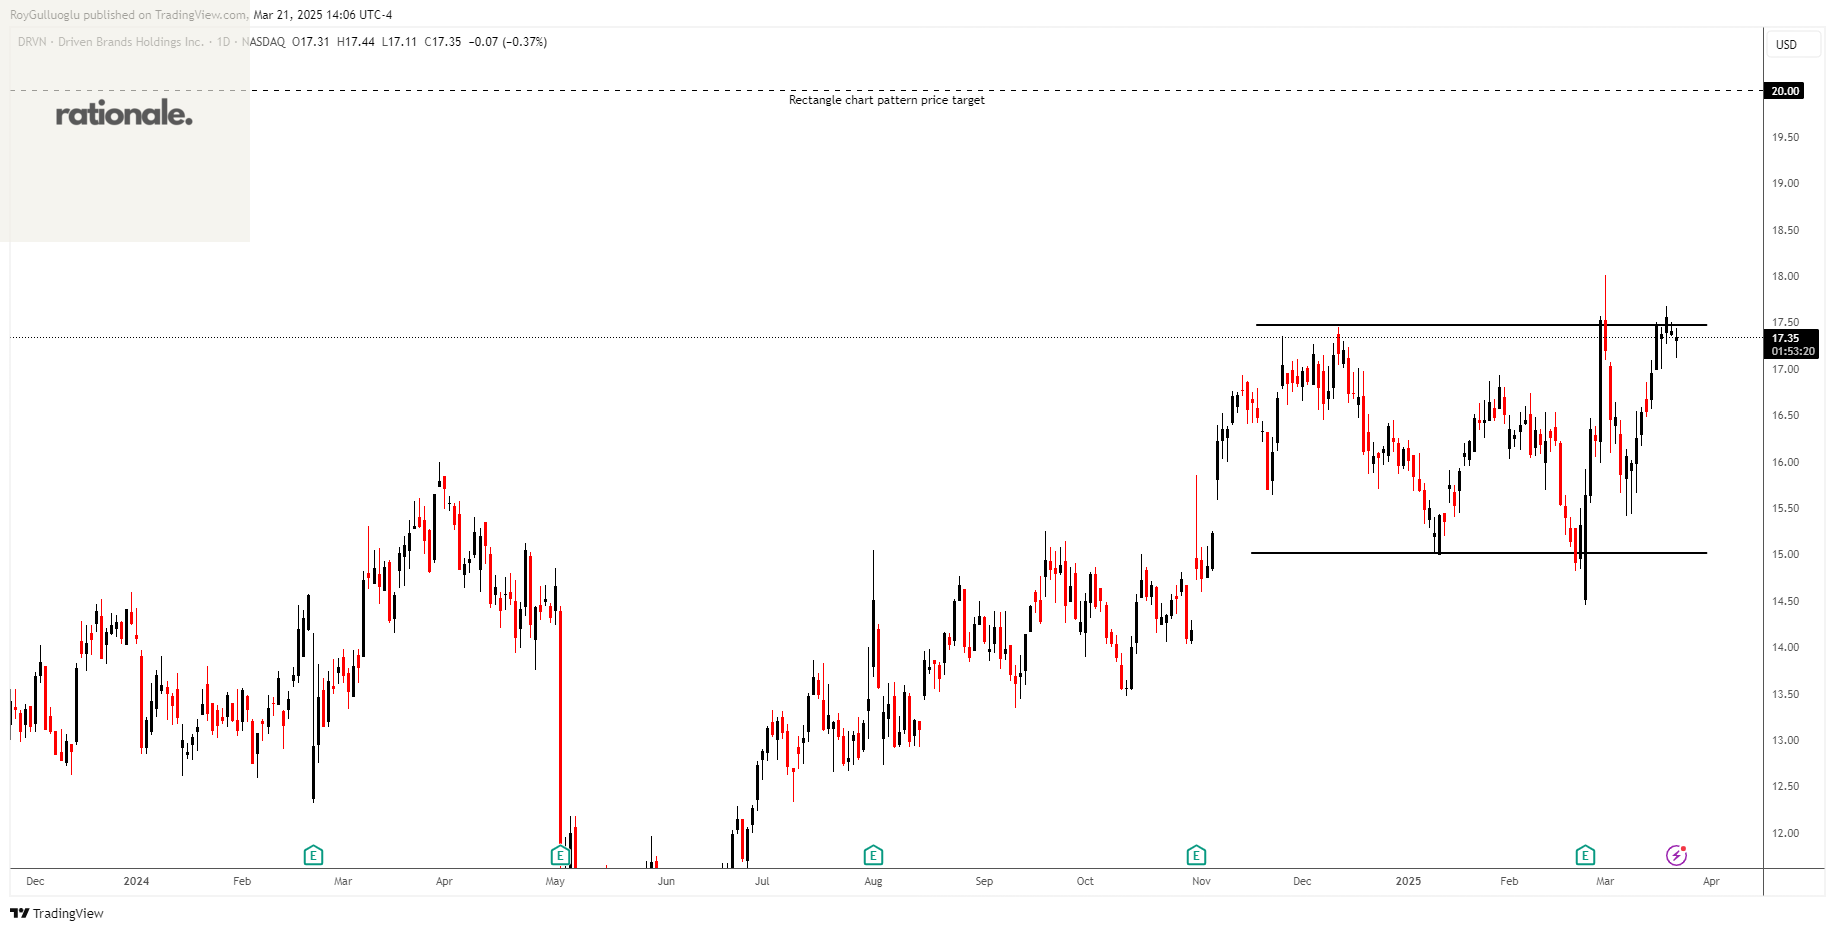
Driven Brands Holdings Inc., together with its subsidiaries, provides automotive services to retail and commercial customers in the United States, Canada, and internationally.
The above daily chart formed an approximately 3-month-long rectangle chart pattern as a bullish continuation after an uptrend.
The horizontal boundary at 17.47 levels acts as a resistance within this pattern.
A daily close above 17.99 levels would validate the breakout from the 3-month-long rectangle chart pattern.
Based on this chart pattern, the potential price target is 20 levels.
DRVN, classified under the "consumer cyclicals" sector, falls under the “Mid Cap - Growth” stock category.
Axalta Coating Systems Ltd.-(AXTA/NYSE)-Short Idea
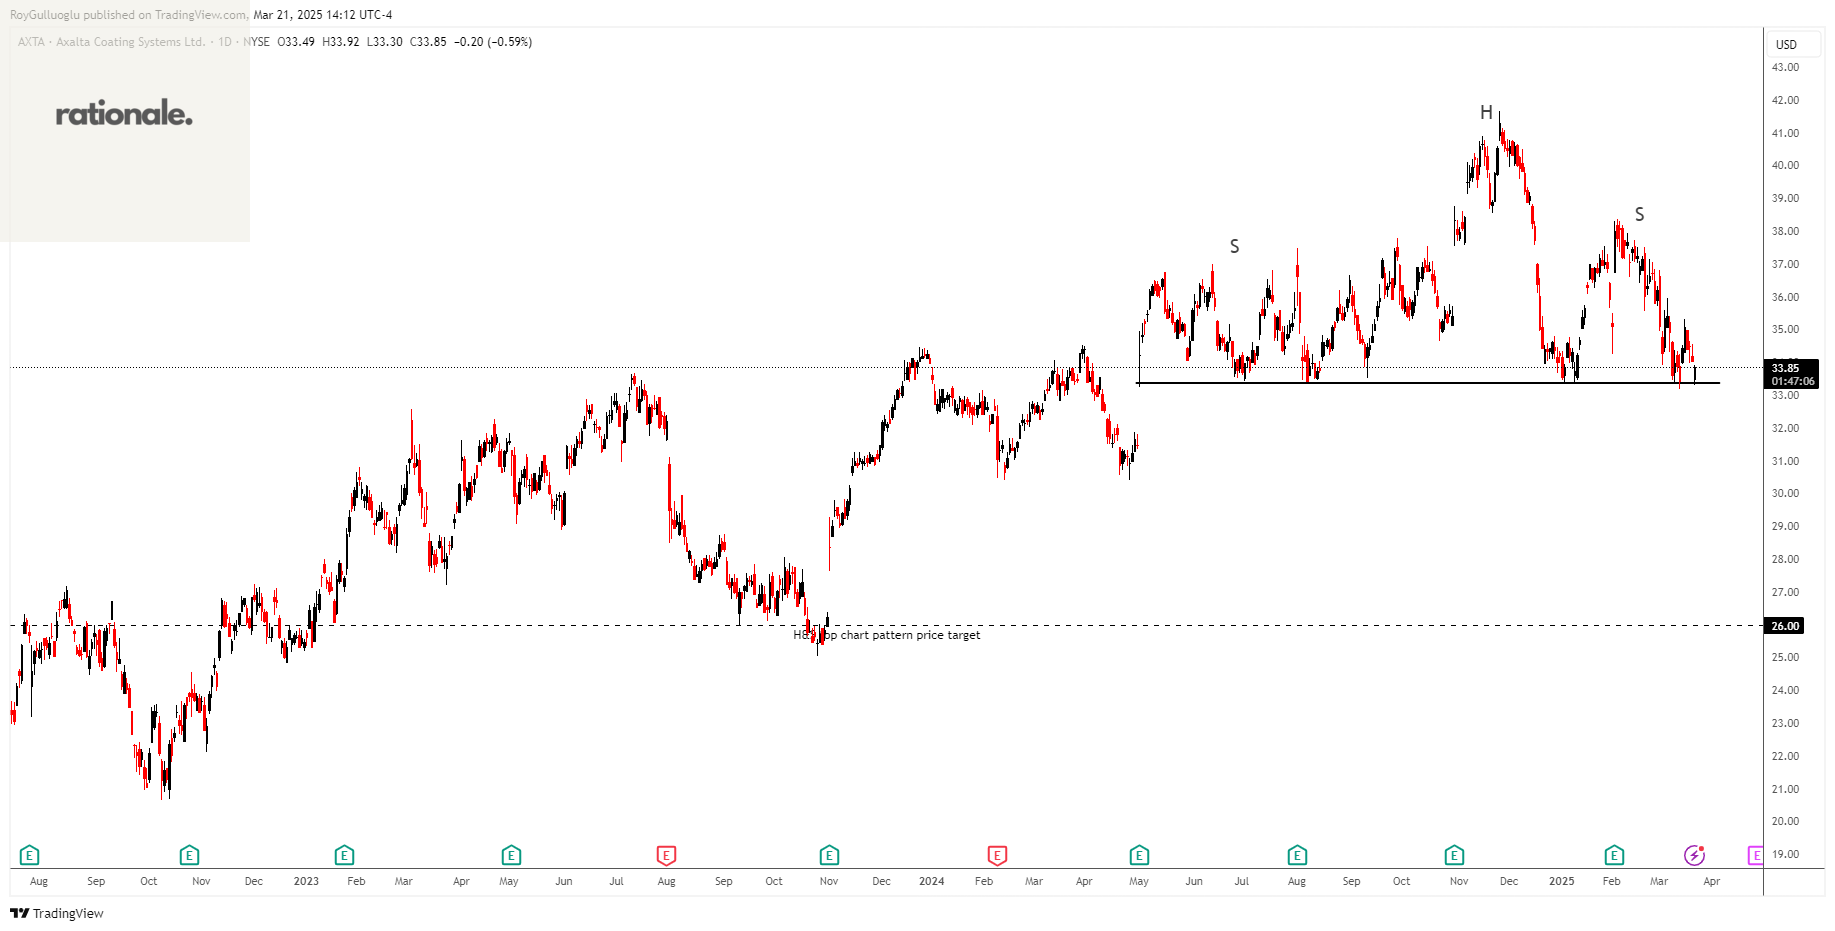
Axalta Coating Systems Ltd., through its subsidiaries, manufactures, markets, and distributes high-performance coatings systems in North America, Europe, the Middle East, Africa, the Asia Pacific, and Latin America.
The above weekly chart formed an approximately 7-month-long H&S top chart pattern as a bearish reversal after an uptrend.
The horizontal boundary at 33.36 levels acted as a support within this pattern.
A daily close below 32.36 levels would validate the breakdown from the 7-month-long H&S top chart pattern.
Based on this chart pattern, the potential price target is 26 levels.
AXTA, classified under the "basic materials" sector, falls under the “Mid Cap - Value” stock category.
Fidelity National Financial, Inc.-(FNF/NYSE)-Long Idea
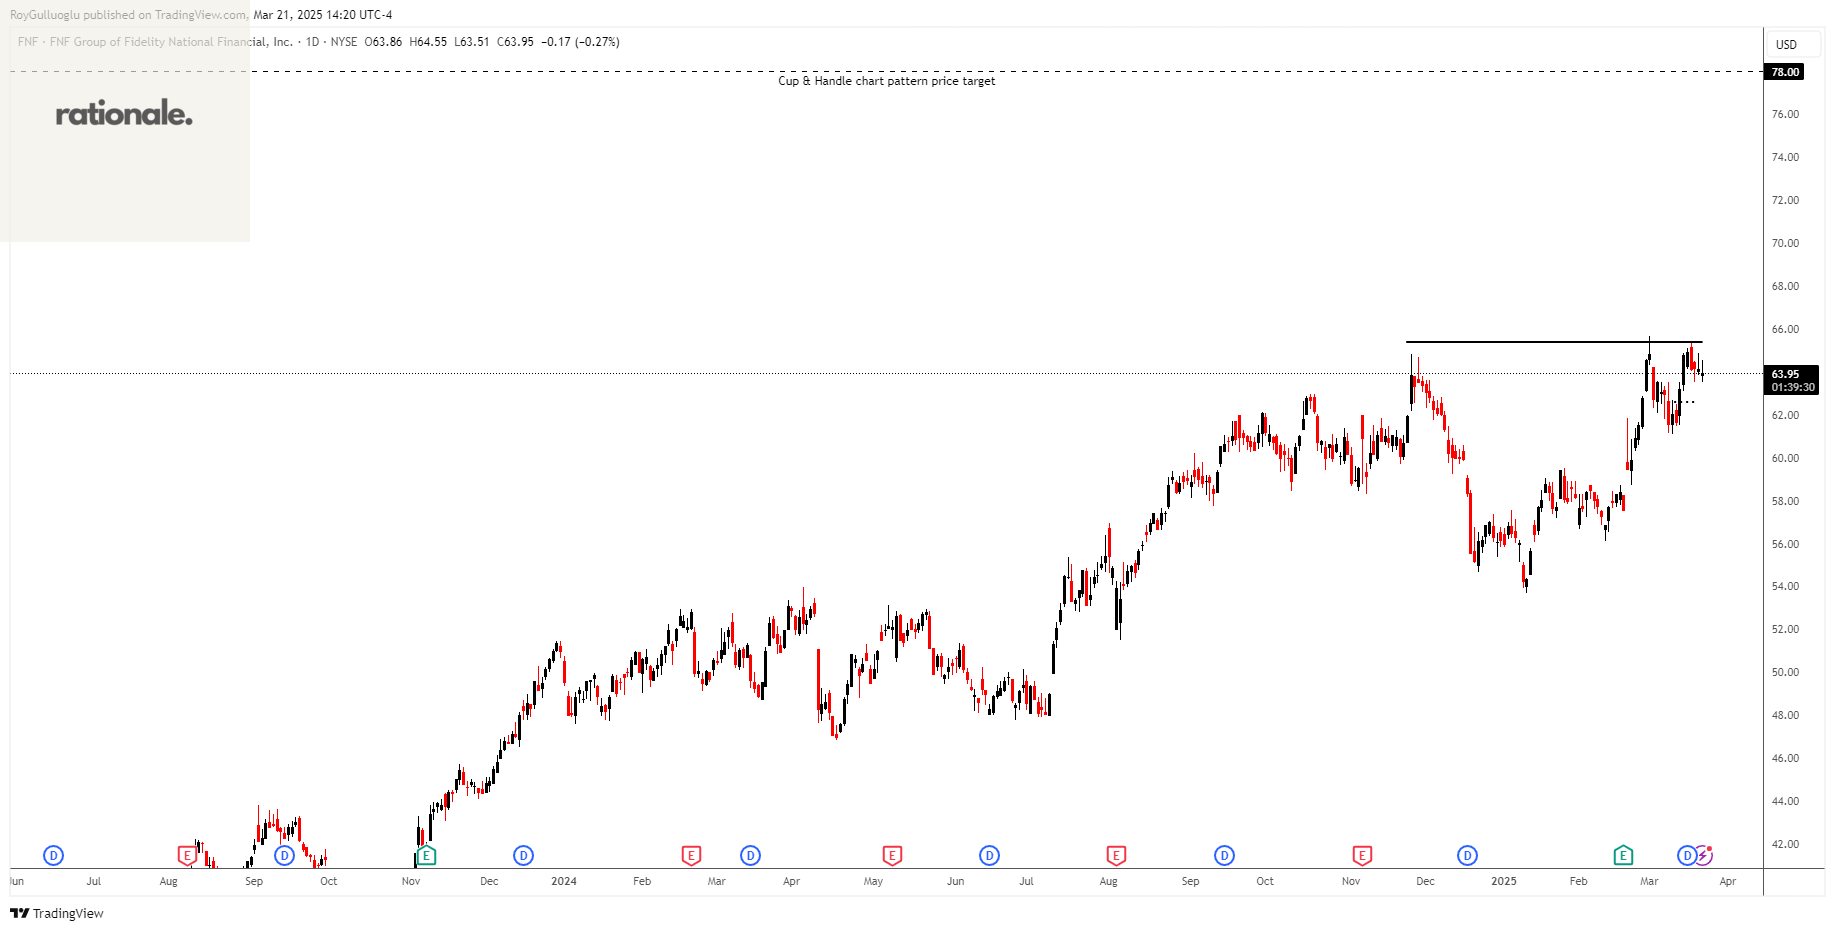
Fidelity National Financial, Inc., together with its subsidiaries, provides various insurance products in the United States.
The above daily chart formed an approximately 3-month-long cup & handle chart pattern as a bullish continuation after an uptrend.
The horizontal boundary at 65.37 levels acts as a resistance within this pattern.
A daily close above 67.33 levels would validate the breakout from the 3-month-long cup & handle chart pattern.
Based on this chart pattern, the potential price target is 78 levels.
FNF, classified under the "financial services" sector, falls under the “Large Cap - Income” stock category.