New setups
GBPCHF - Short Idea
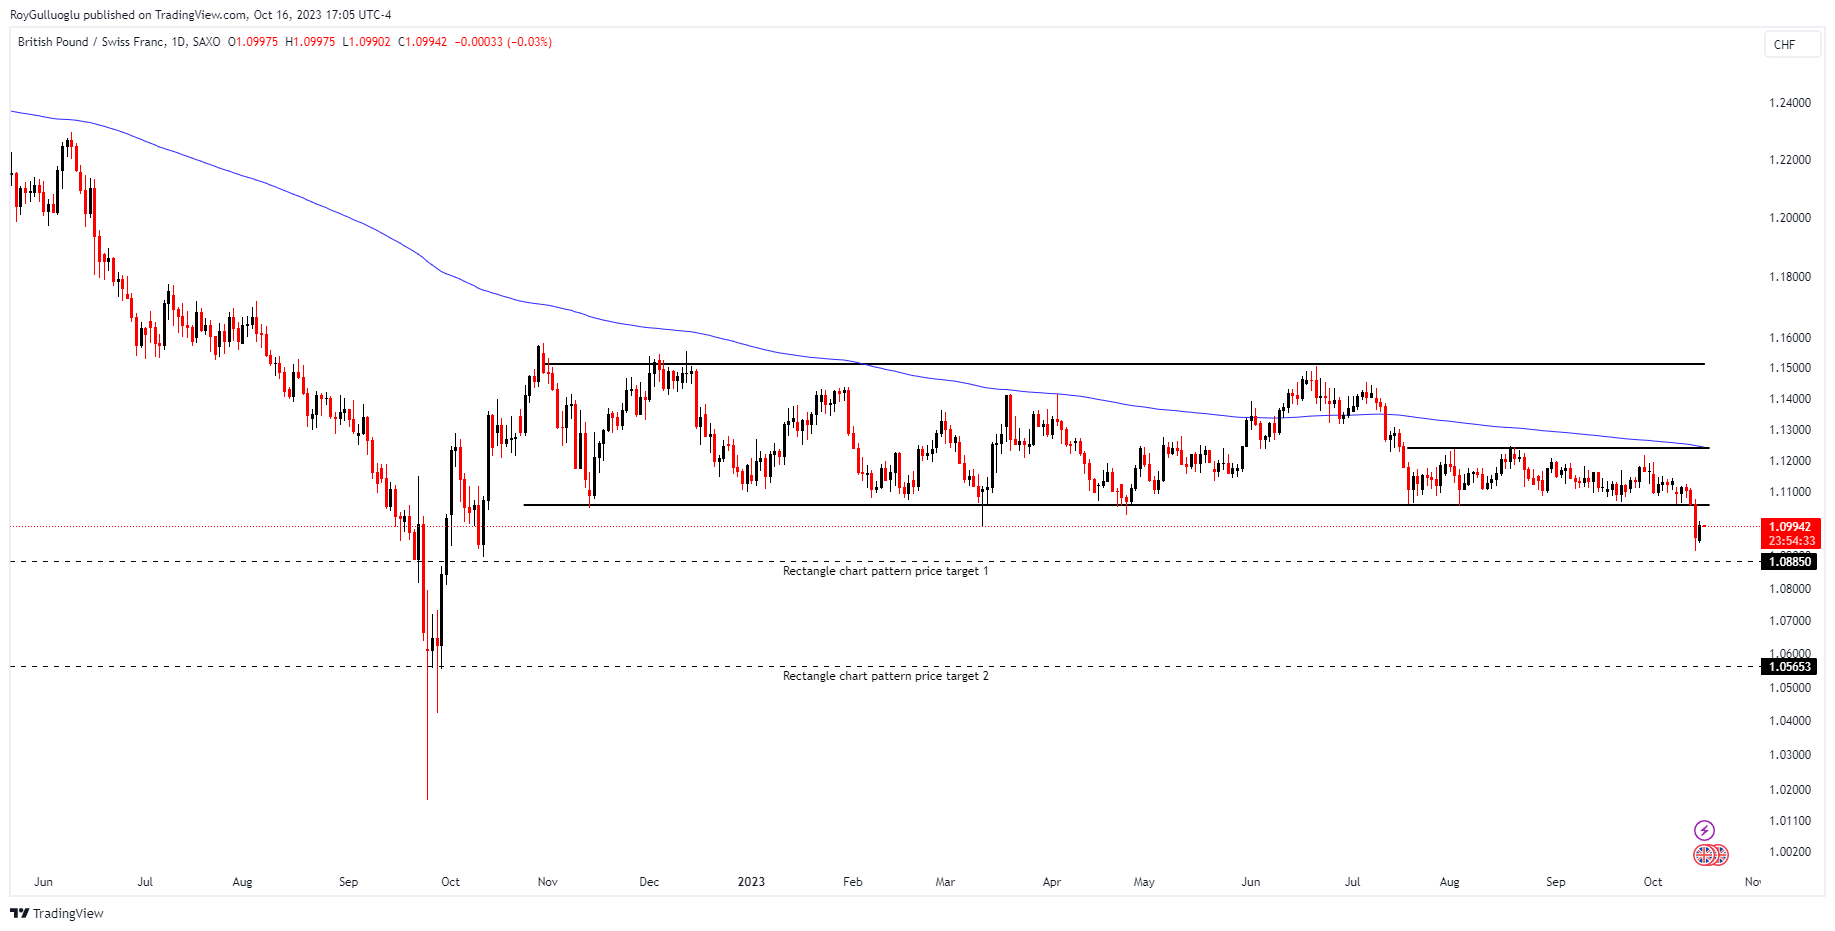
The above daily chart formed approximately 8-month-long and 2-month-long rectangle chart patterns, with support at 1.1059 levels.
A daily close last Friday was strong and the price started to pull back towards the support of the rectangle chart pattern. That might provide an opportunity to evaluate a short trade idea with a target of 1.0885 in the first phase.
Considering the longer rectangle chart pattern, this breakout could potentially result in 1.0565 levels.
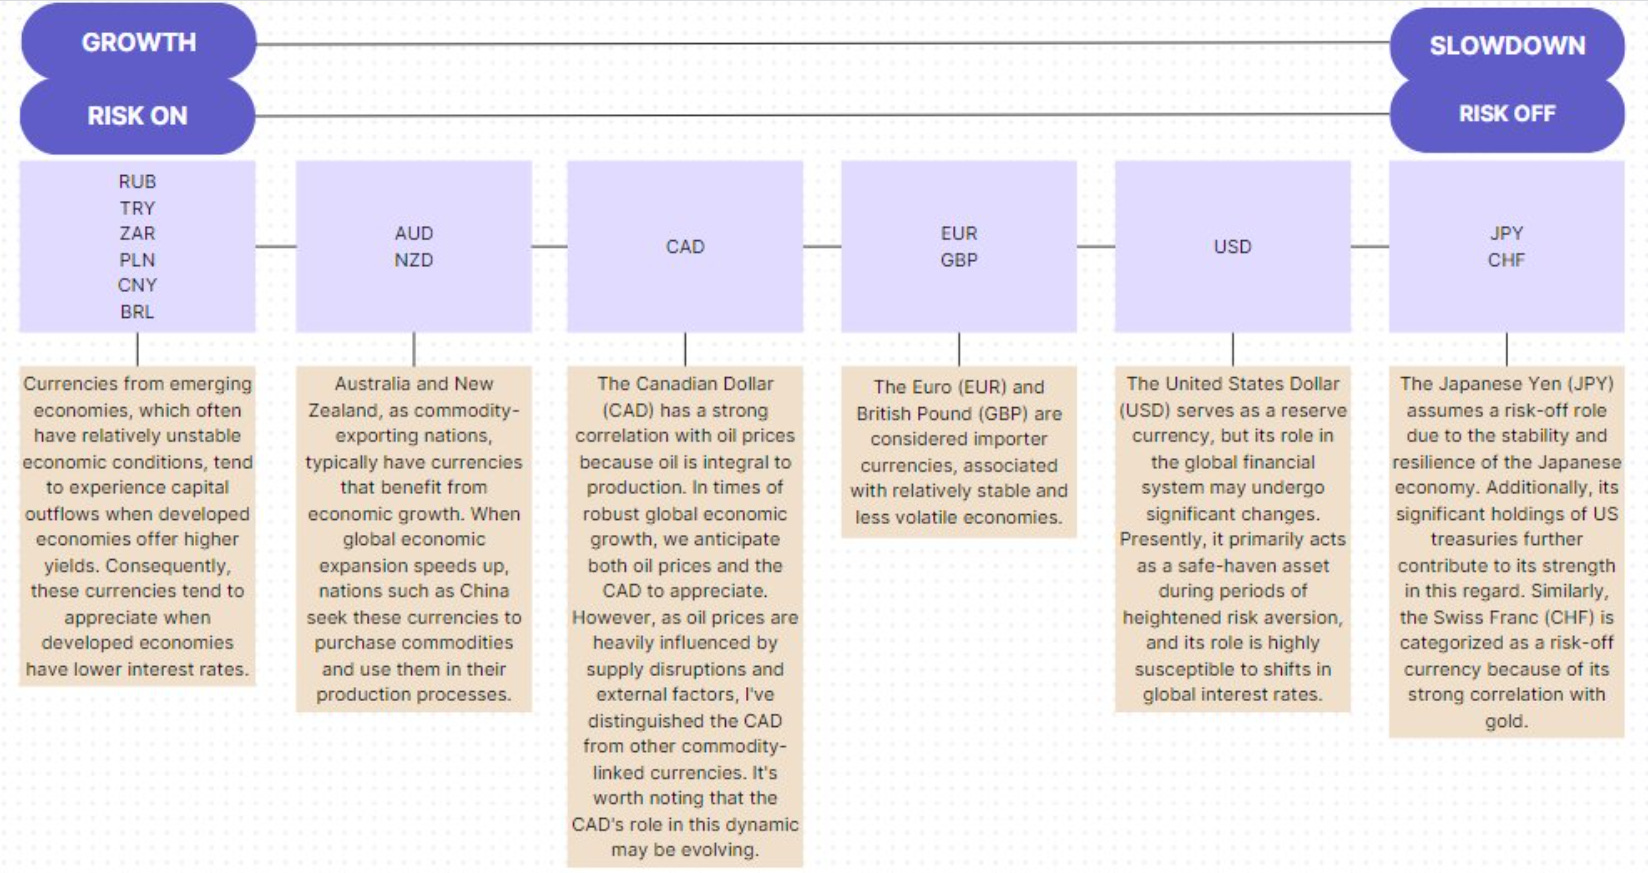
Shorting GBP against CHF aligns with the prevailing RISK-OFF mode, which is consistent with the current market conditions characterized by elevated geopolitical risks. To understand why this is a RISK-OFF trade idea, please refer to the provided scheme or the provided link.

MNDY - Short Idea
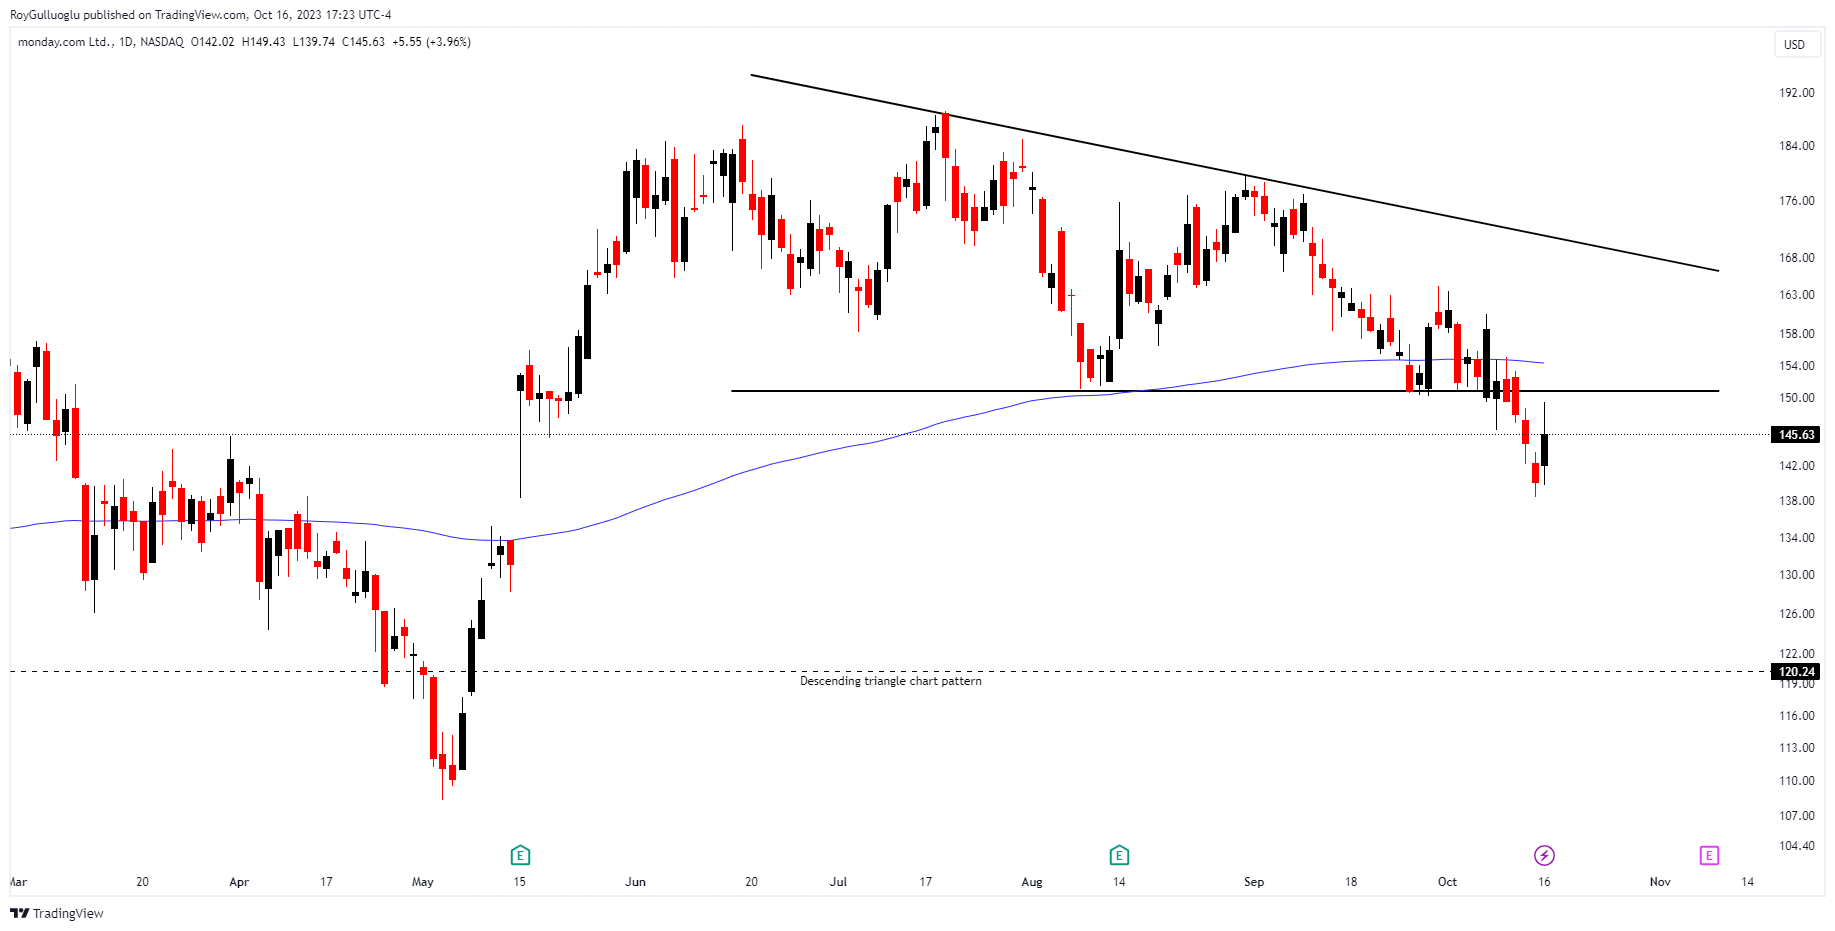
Monday.Com Ltd is an Israel-based software publisher. The Company provides an operational system monday.com Work OS which is an open platform that democratizes the power of software so organizations can easily build software applications and work management tools to fit their every need.
The above daily chart formed an approximately 2-month-long descending triangle chart pattern as a bearish reversal after an uptrend, with support at 150.79$ levels.
A daily close below 144.5$ level validated the breakout from the 2-month-long descending triangle chart pattern.
This breakout could potentially result in a chart pattern target of 120.24$ levels.
The price pulled back toward the support level of the given chart pattern which may provide an opportunity to evaluate a short trade idea.
MNDY, classified under the "information technology" sector, falls under the category of "Mid Cap - Growth" stock. Stocks in this category are typically expected to demonstrate stable performance, especially during periods often referred to as "pre-recession" economic conditions.
BR - Long Idea
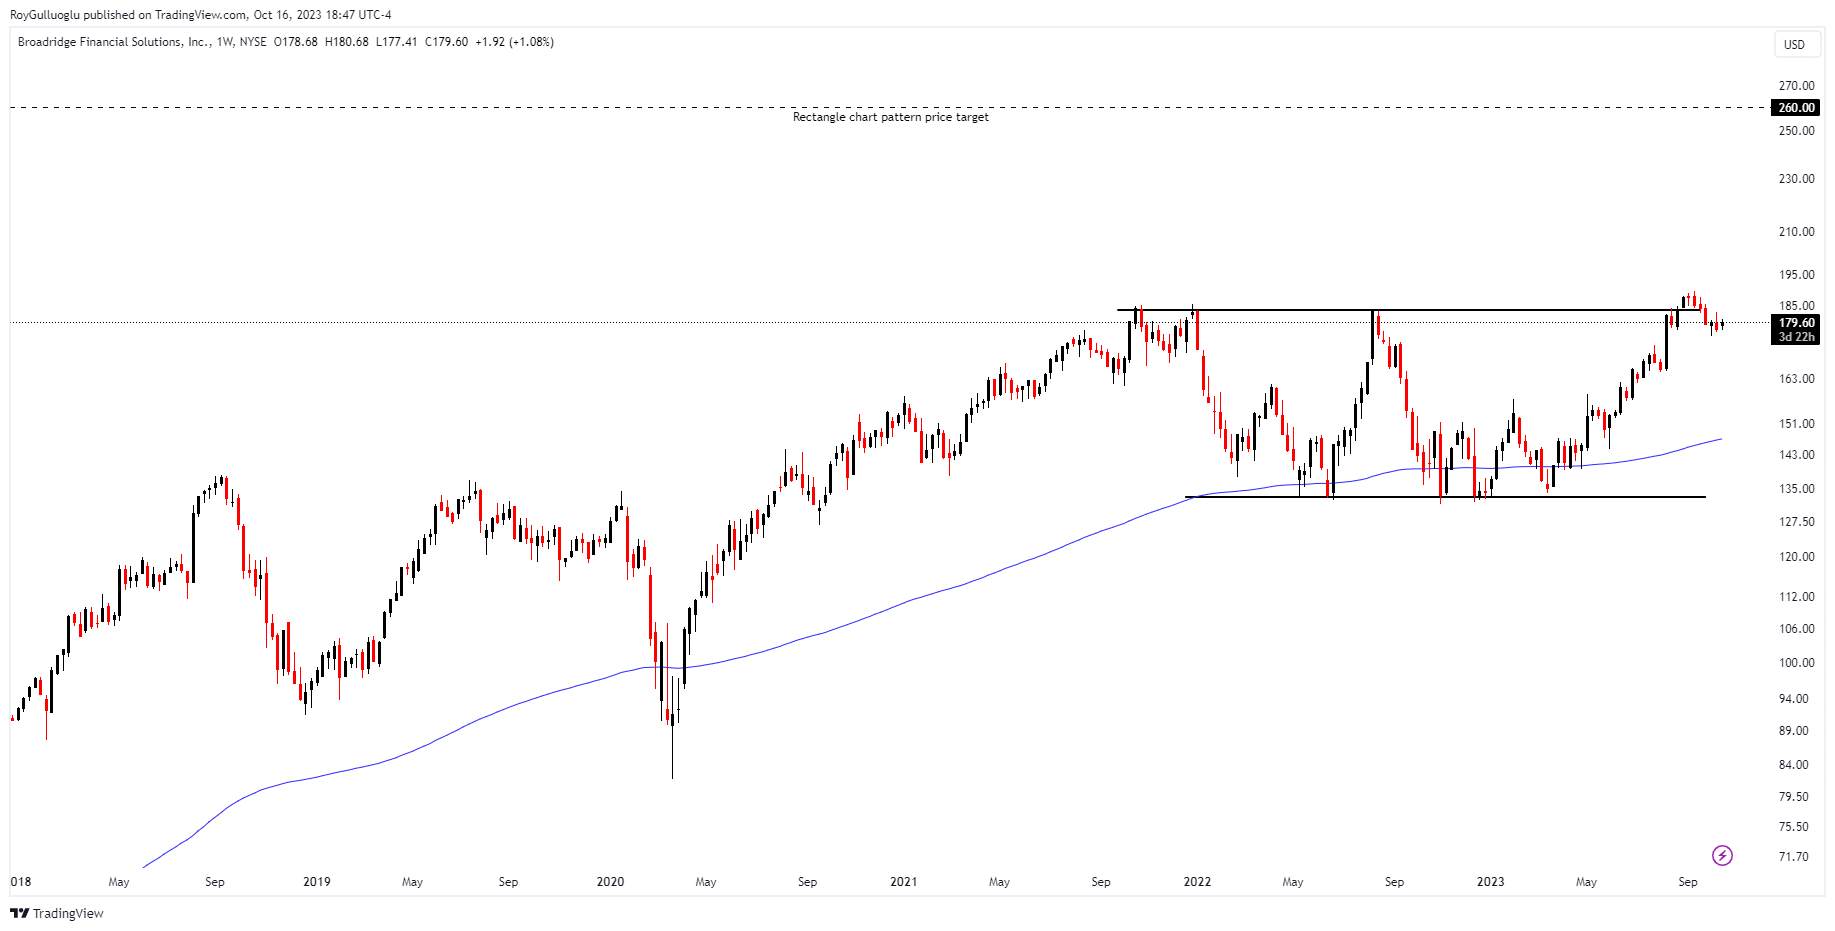
Broadridge Financial Solutions, Inc. operates as a financial technology firm, specializing in delivering investor communications and technology-based solutions to a wide range of clients, including banks, broker-dealers, asset and wealth management firms, public companies, investors, and mutual funds.
The above weekly chart formed an approximately 22-month-long rectangle chart pattern as a bullish continuation after an uptrend, with resistance at 183.62$
A daily close above 190.35$ levels would validate the breakout from the 22-month-long rectangle chart pattern.
This breakout could potentially result in a chart pattern target of 260$ levels.
BR, classified under the "information technology" sector, falls under the category of "Large Cap - Growth" stock.
Stocks` EPS Growth (Last Qtr. vs. Prior Yr.) 30.14%. Accelerating EPS is also a good sign of strength.
INVA - Long Idea
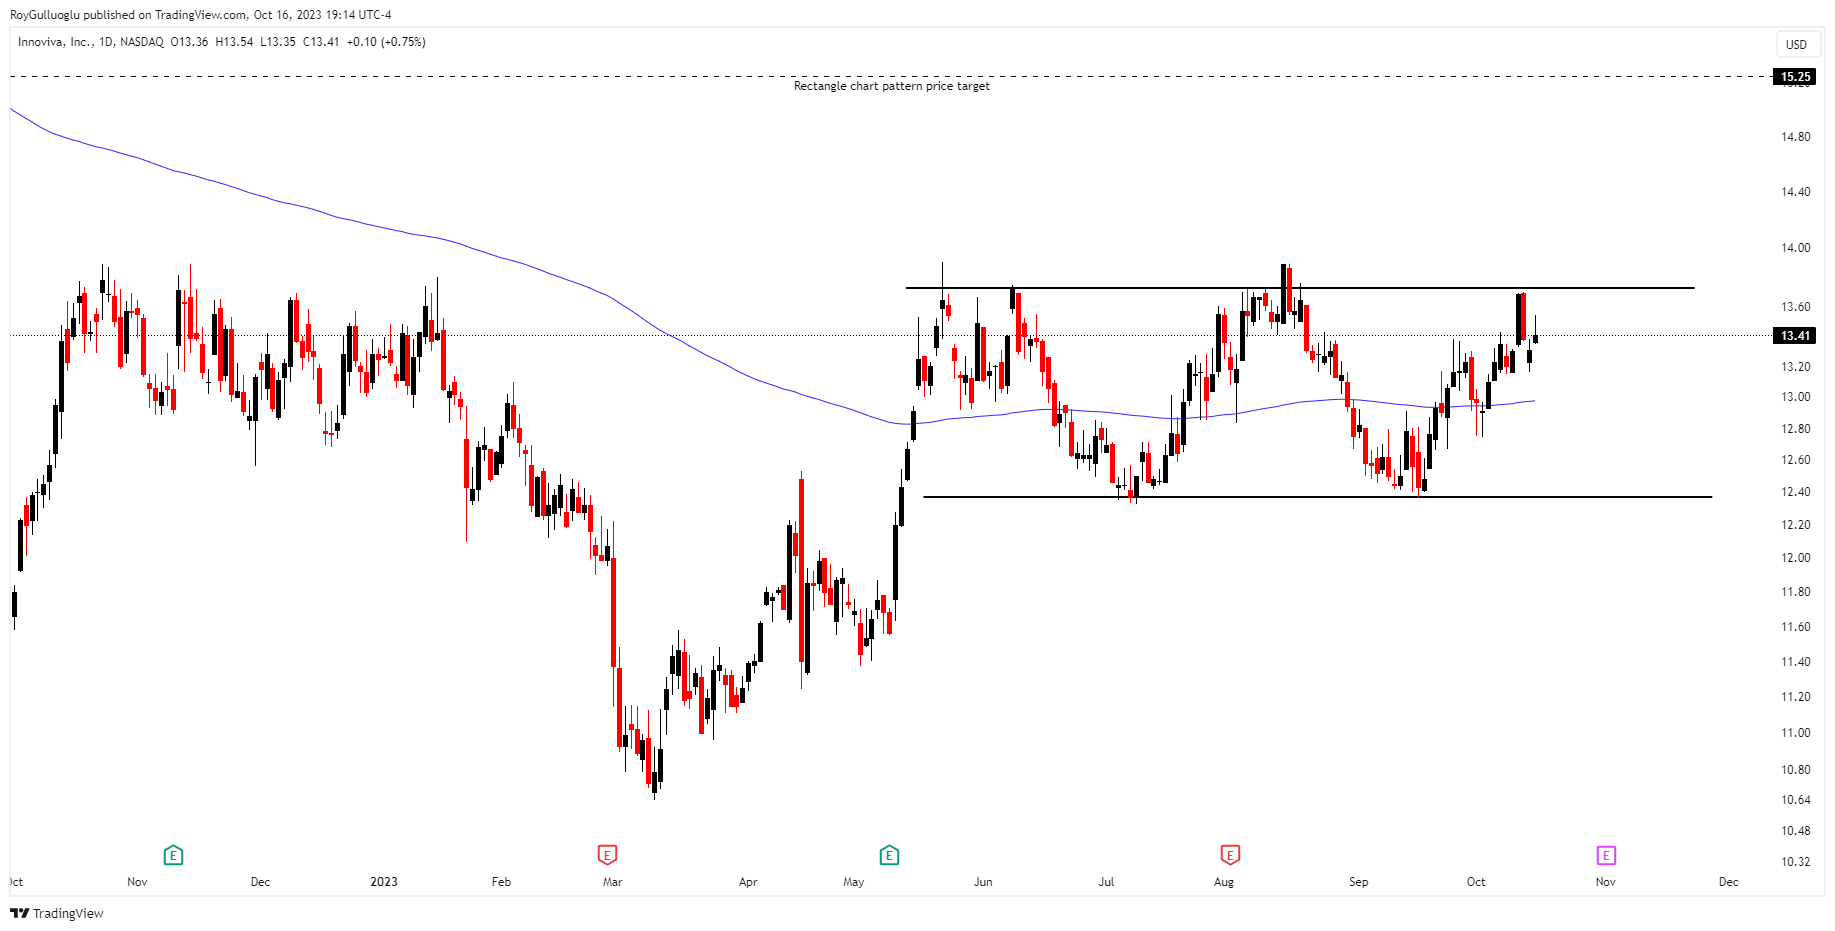
Innoviva, Inc. is a multifaceted holding company that possesses a collection of royalties and various healthcare assets.
The above daily chart formed an approximately 3-month-long rectangle chart pattern as a bullish continuation after an uptrend, with resistance at 13.7$
A daily close above 14.1$ level would validate the breakout from the 3-month-long rectangle chart pattern.
This breakout could potentially result in a chart pattern target of 15.25$ level.
INVA, categorized under the "health care" sector, is part of the "Small Cap - Value" stock segment. With tightening credit conditions and declining economic activities, defensive sectors like health care gain prominence.
Stocks` EPS Growth (Last Qtr. vs. Prior Yr.) 100%. Accelerating EPS is also a good sign of strength.
SHARE INDIA - Long Idea
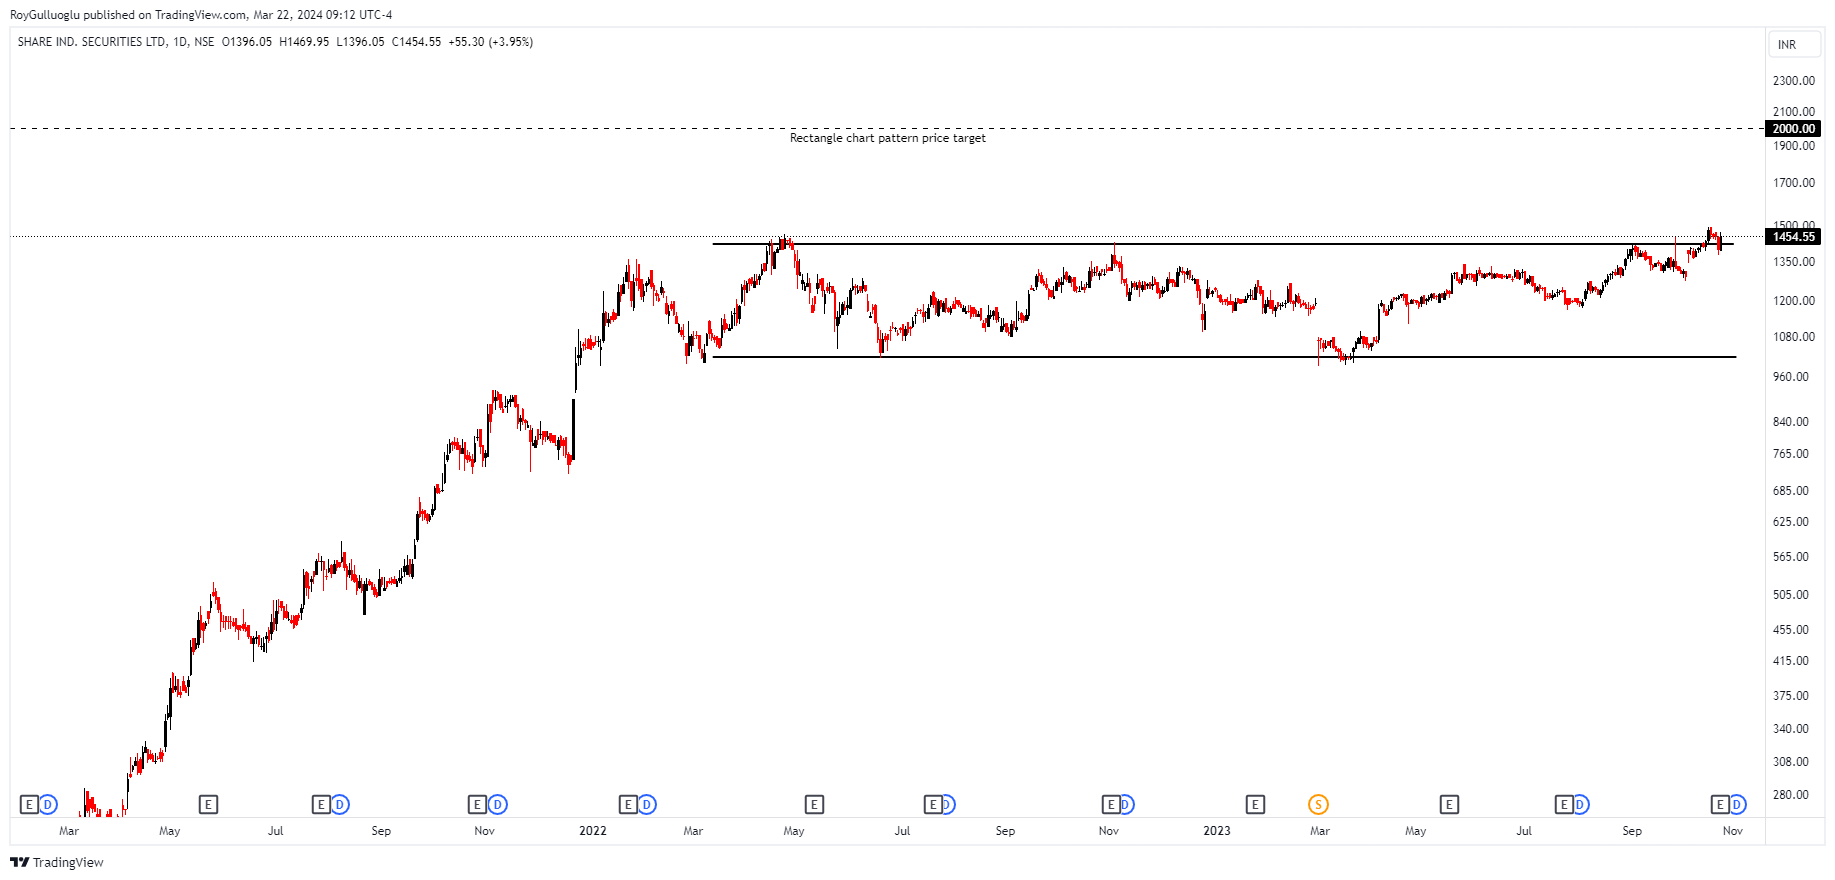
Share India Securities Limited is an Indian financial services firm involved in share and stock broking, commodity derivatives broking, equity derivatives broking, currency derivatives broking, portfolio management, research analysis, mutual funds distribution, and securities-related activities.
The above daily chart formed an approximately 1-year-long rectangle chart pattern as a bullish continuation after an uptrend, with resistance at 1410.
A daily close above 1452 levels would validate the breakout from the 1-year-long rectangle chart pattern.
This breakout could potentially result in a chart pattern target of 2000 levels.
SHARE INDIA, classified under the "financial services" sector, is part of the "Small Cap - Income" stock segment.
SAF - Long Idea
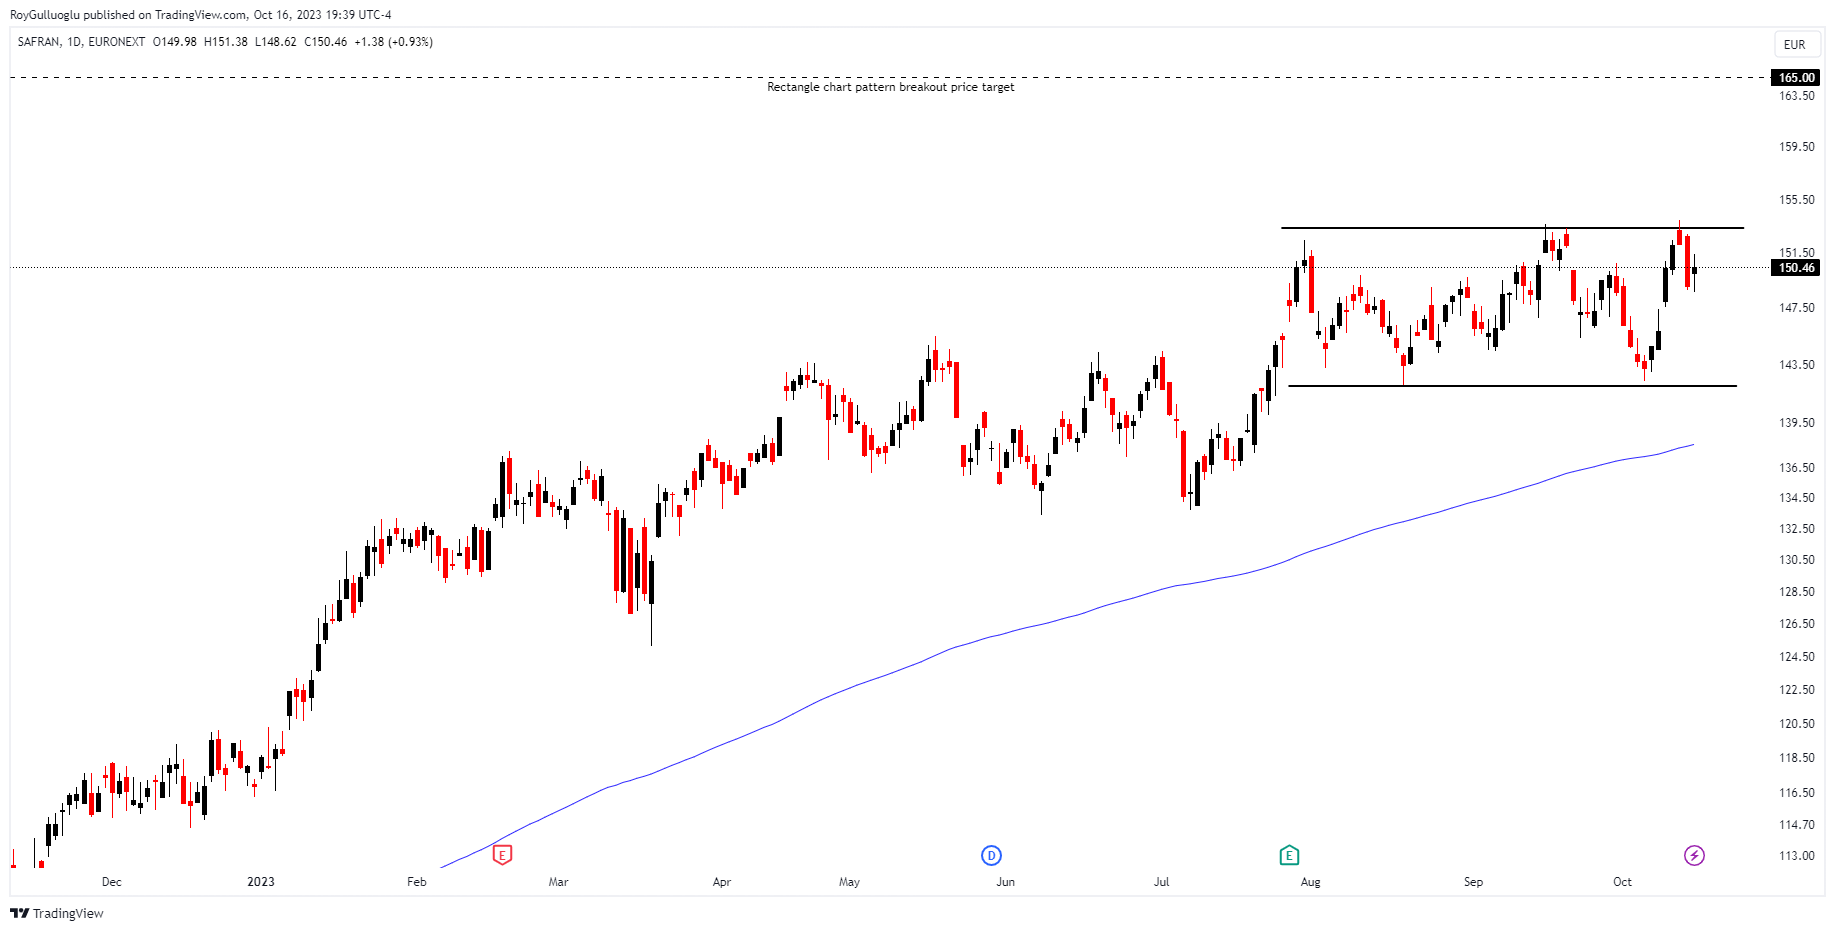
Safran SA is a French high-tech company headquartered in France, engaging in the entire spectrum of high-technology operations, including research, design, development, testing, manufacturing, sales, maintenance, and support. The company's operations are divided into three segments: Aerospace Propulsion, Aircraft Equipment, and Aircraft Interiors.
The above daily chart formed an approximately 2-month-long rectangle chart pattern as a bullish continuation after an uptrend, with resistance at 153.36
A daily close above 157.96 levels would validate the breakout from the 2-month-long rectangle chart pattern.
This breakout could potentially result in a chart pattern target of 165 levels.
SAF, classified under the "industrial" sector, falls under the category of "Large Cap - Value" stock.
EMP.A - Long Idea
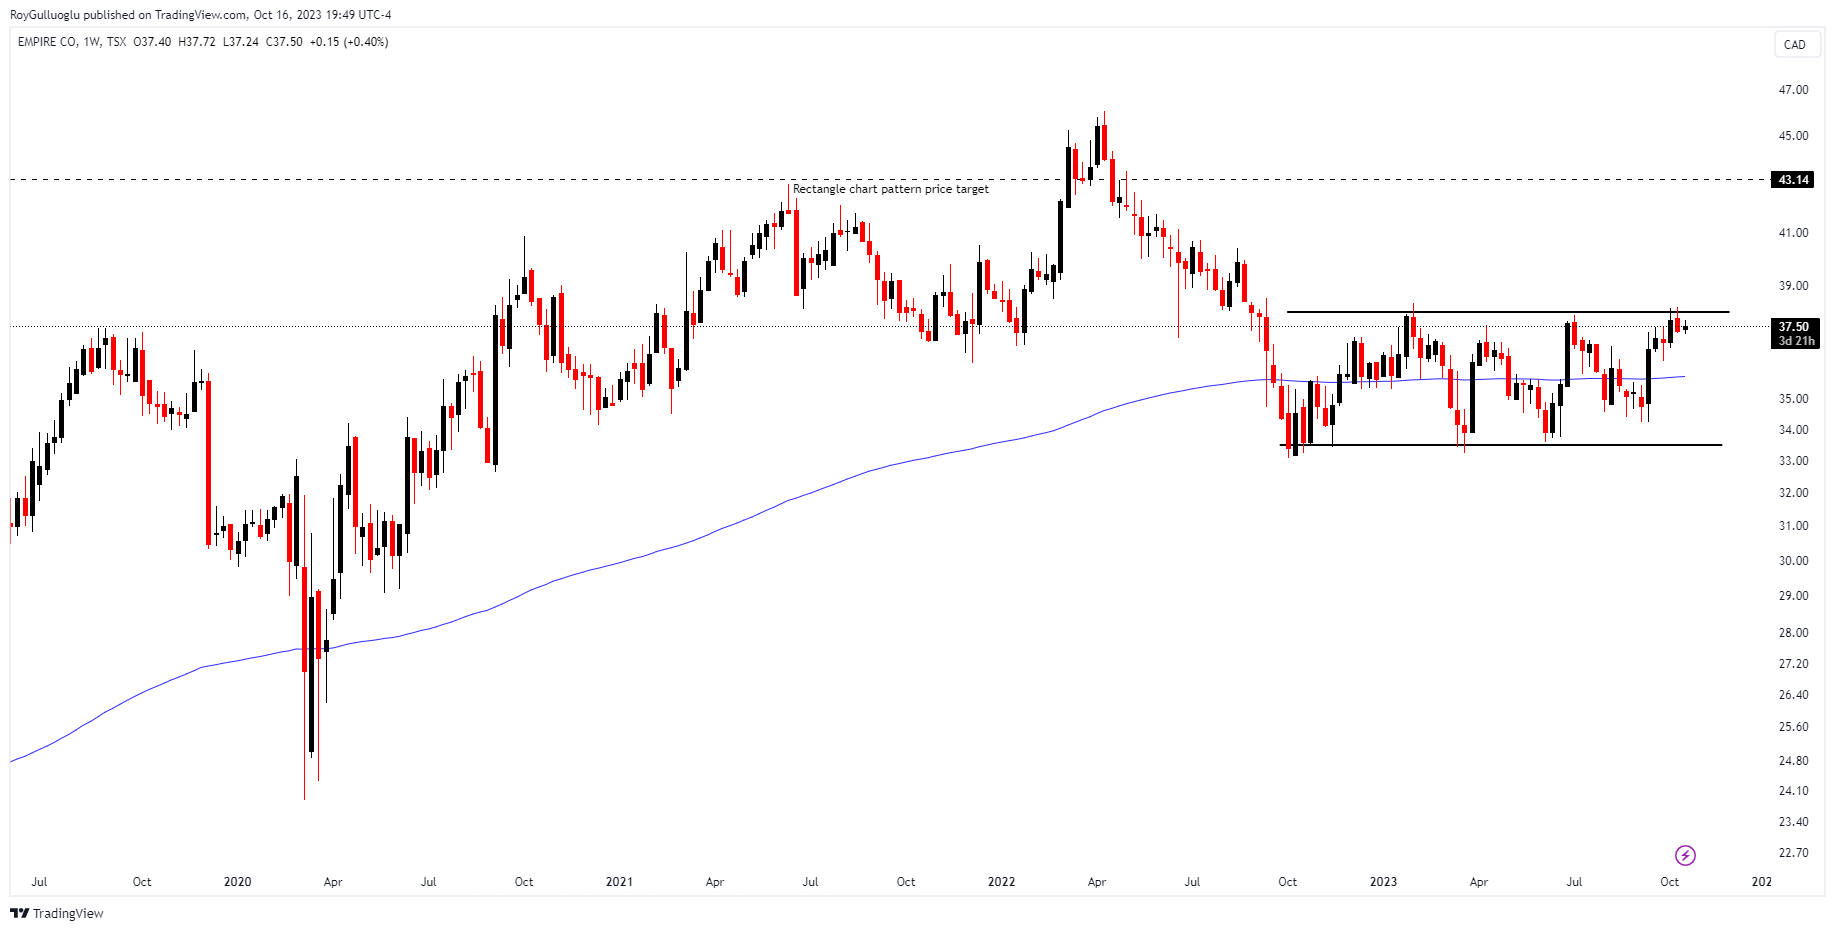
Empire Company Limited, a Canadian enterprise, focuses on the food retail industry and associated real estate endeavors. The company's primary operational divisions encompass Food Retailing and Investments, along with other business operations.
The above weekly chart formed an approximately 11-month-long rectangle chart pattern as a bullish reversal after a downtrend, with resistance at 38.
A daily close above 39.15 levels would validate the breakout from the 11-month-long rectangle chart pattern.
This breakout could potentially result in a chart pattern target of 43.15 levels.
EMP.A, classified under the "consumer staples" sector, falls under the category of "Mid Cap - Value" stock.
Stocks` EPS Growth (Last Qtr. vs. Prior Yr.) 45.07%. Accelerating EPS is also a good sign of strength.
Follow-ups
EG - Long Idea
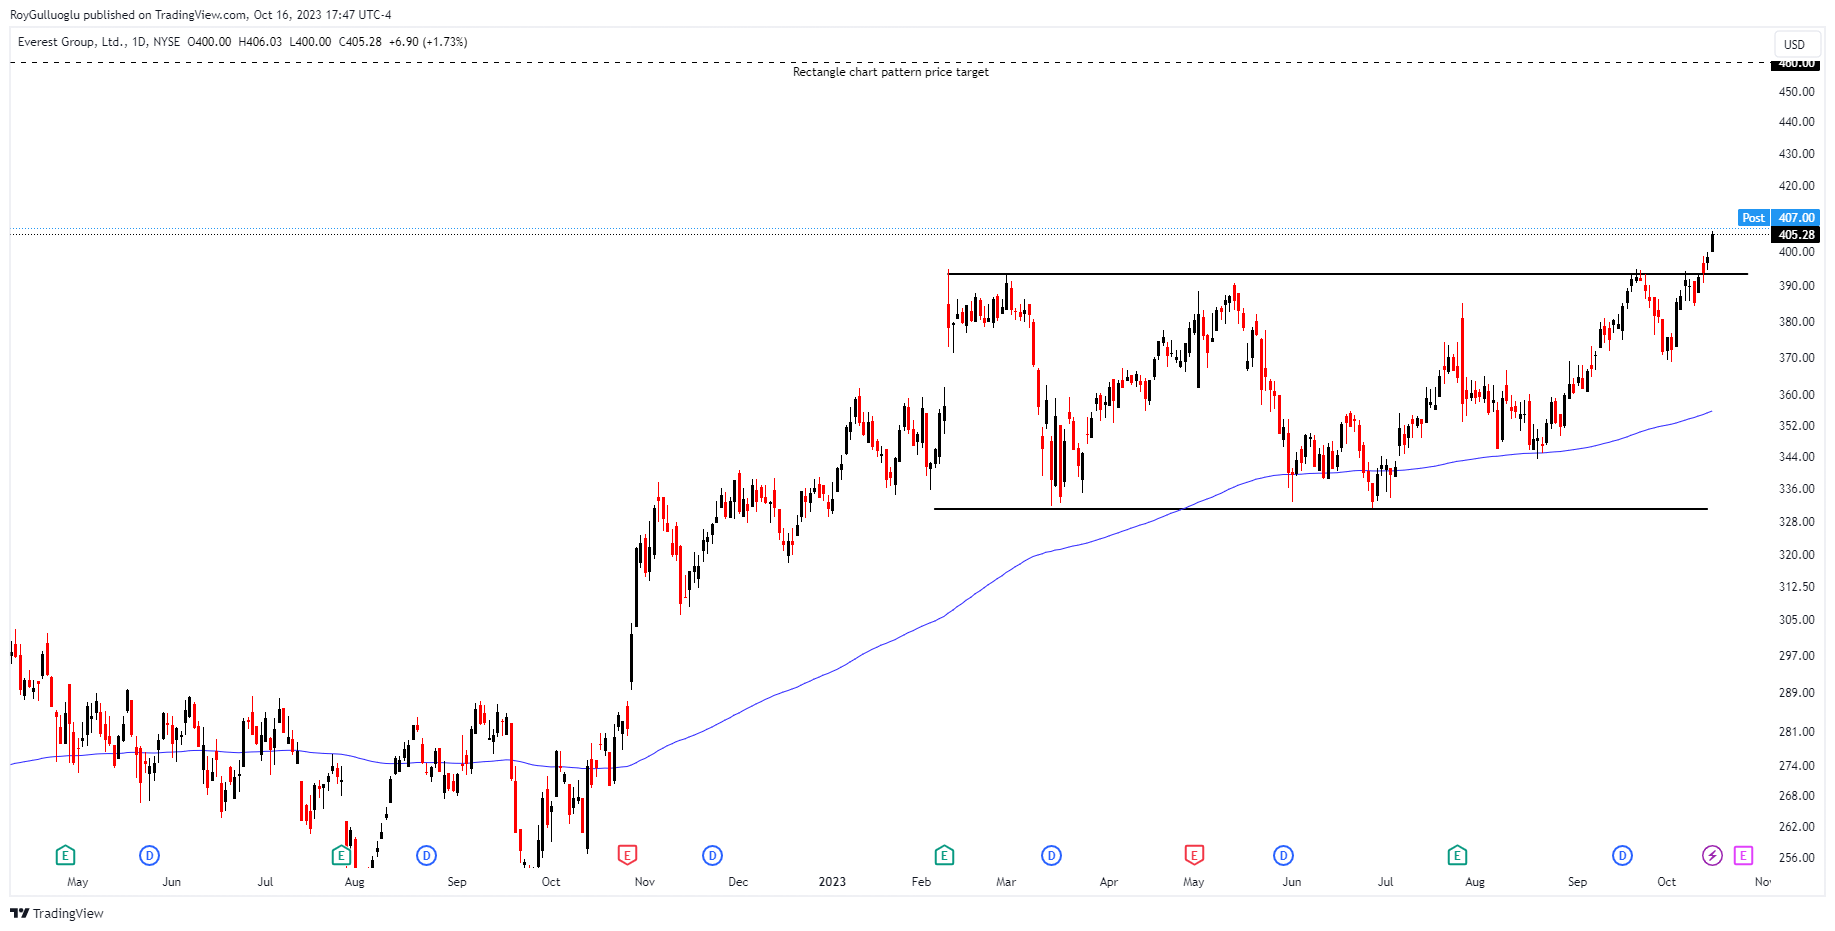
You can click on the EG ticker above to access the first report explaining the RATIONALE behind the trade idea.
The daily close above 399$ levels confirmed the breakout from the 5-month-
long rectangle chart pattern. The possible chart pattern price target is 460$.
TEAM - Long Idea
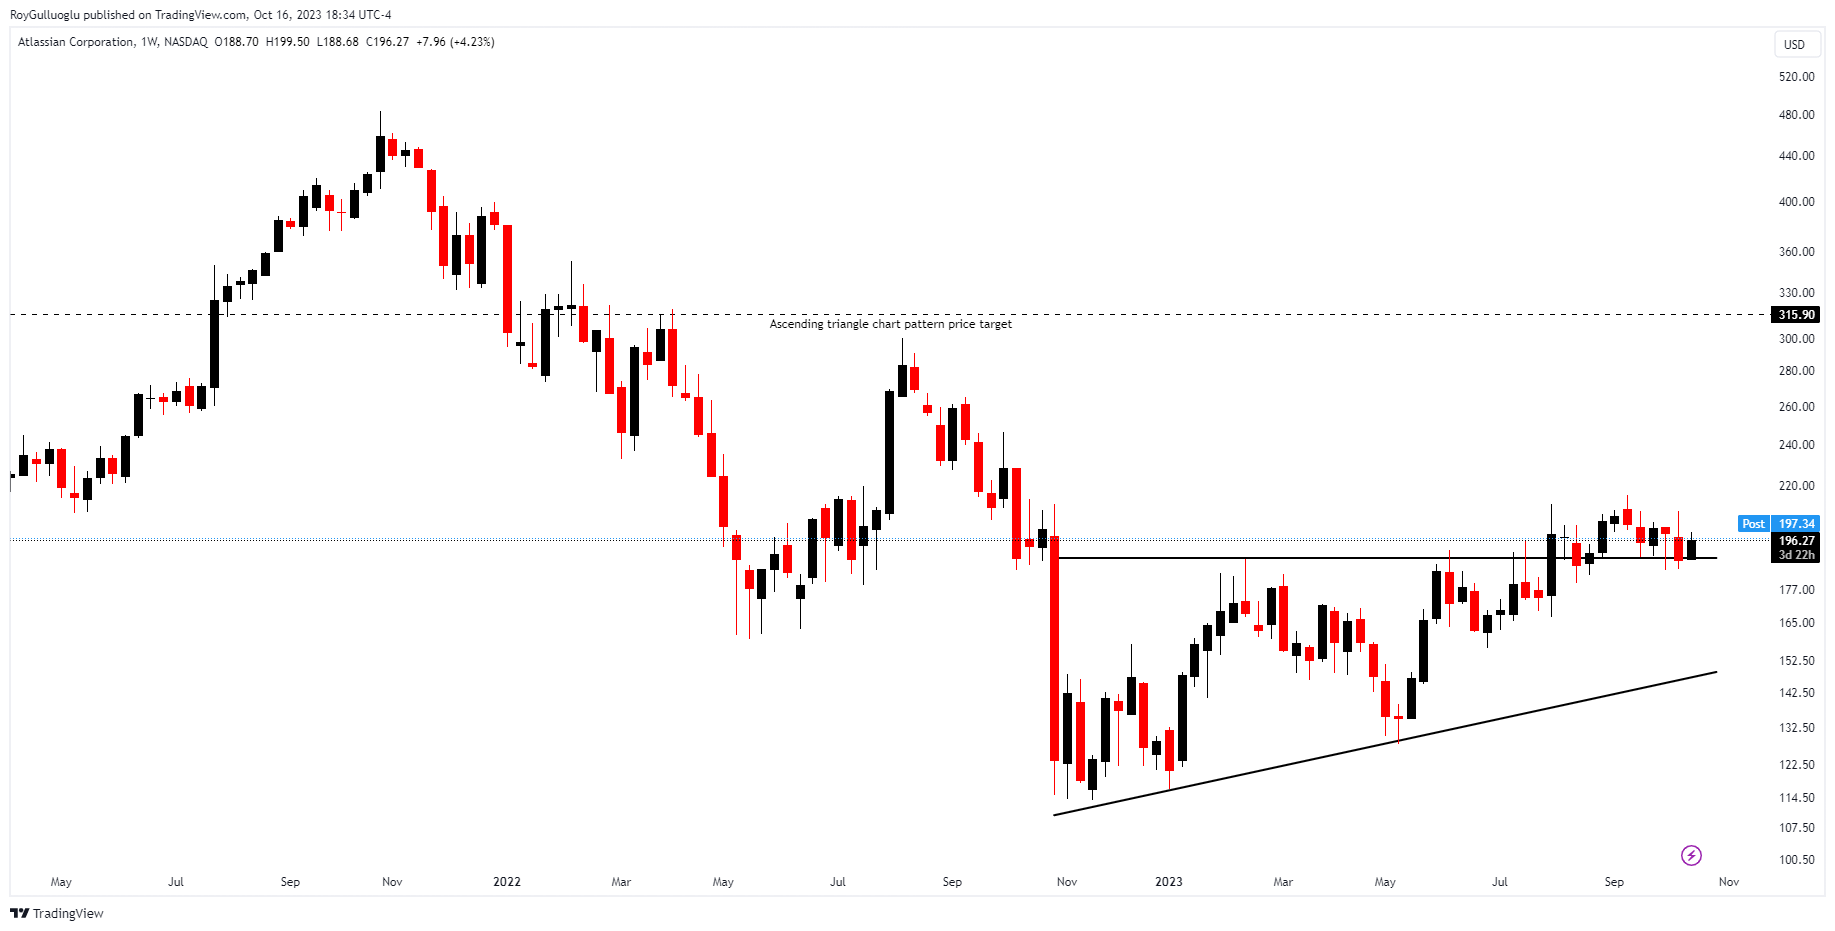
You can click on the TEAM ticker above to access the first report explaining the RATIONALE behind the trade idea.
The above weekly chart formed an approximately 9-month-long ascending triangle chart pattern as a bullish reversal after a downtrend, with resistance at 189.1$ levels.
A daily close above 195$ level has already validated the breakout from the 9-month-long ascending triangle chart pattern.
The price pulled back to its 40-week moving average and the support level of 189.1$ level. This might provide an opportunity to enter a position.
This breakout could potentially result in a chart pattern target of 315.9$ levels.
FDAX1! - Short Idea
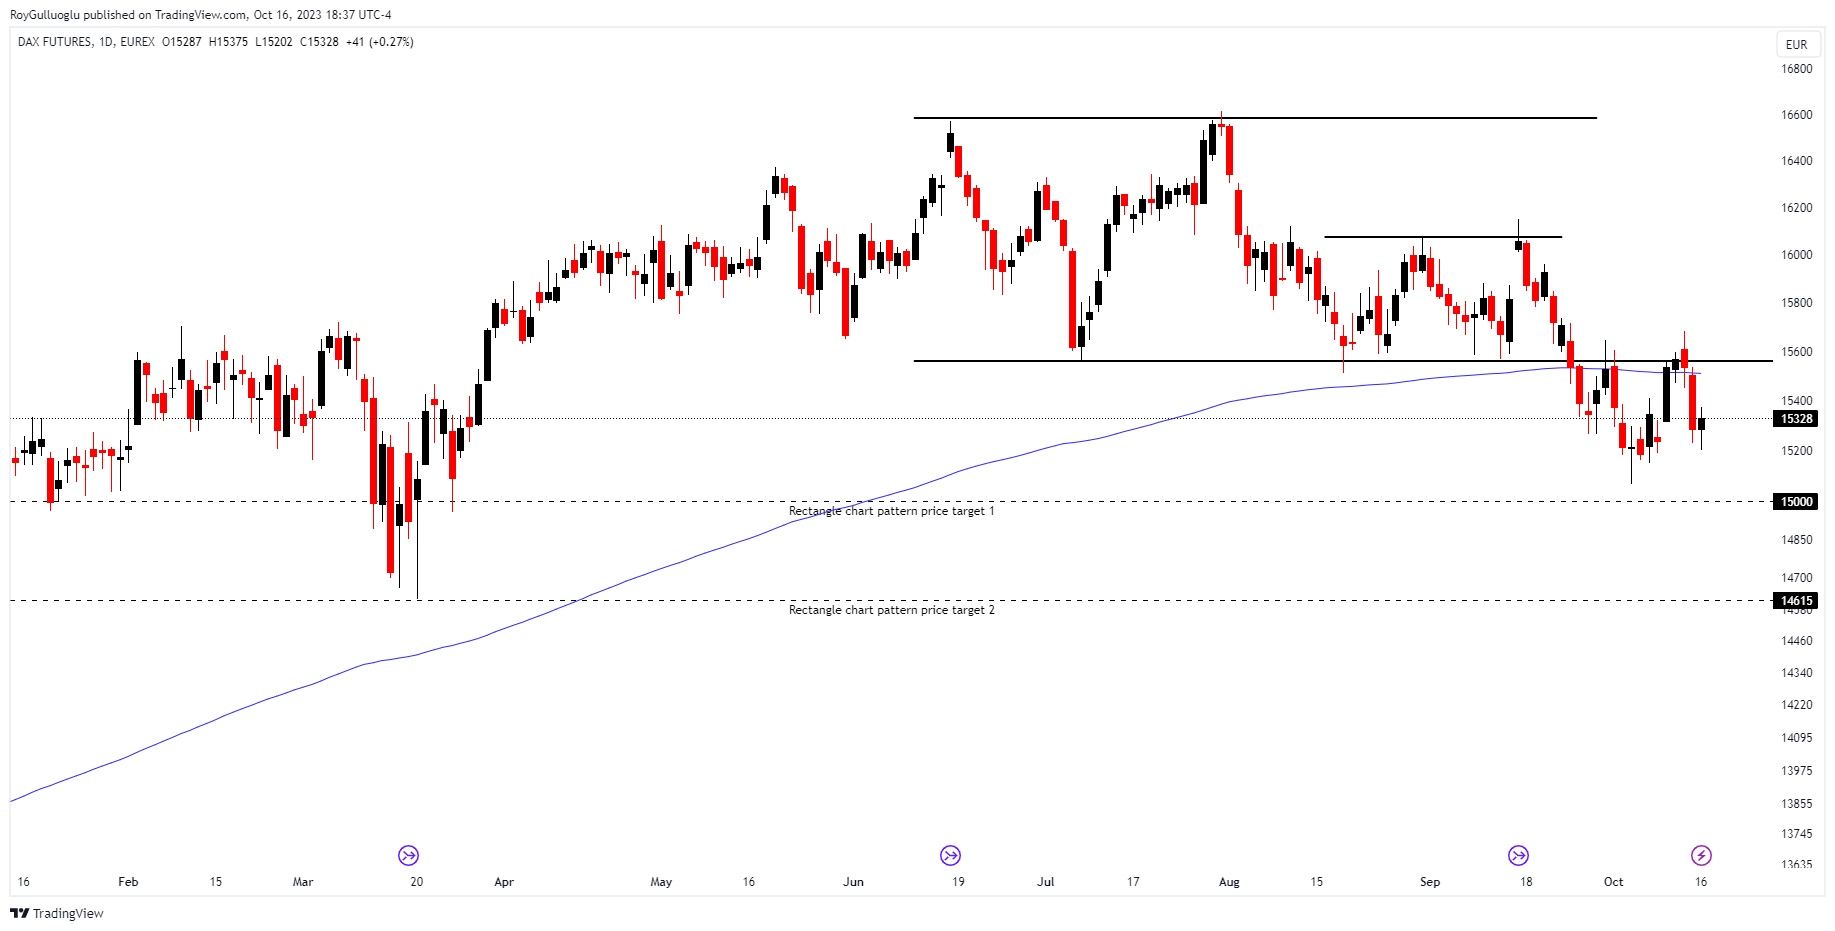
You can click on the FDAX1! ticker above to access the first report explaining the RATIONALE behind the trade idea.
The above daily chart formed an approximately 3-month-long rectangle chart pattern as a bearish reversal after an uptrend, with support at 15560 levels.
A daily close below 15400 levels would validate the breakdown from the 3-month-long rectangle chart pattern. The price broke down below the 200-day EMA which is my filter for entering short positions.
This breakdown could potentially result in a chart pattern target of 14615 levels.
KBH - Short Idea
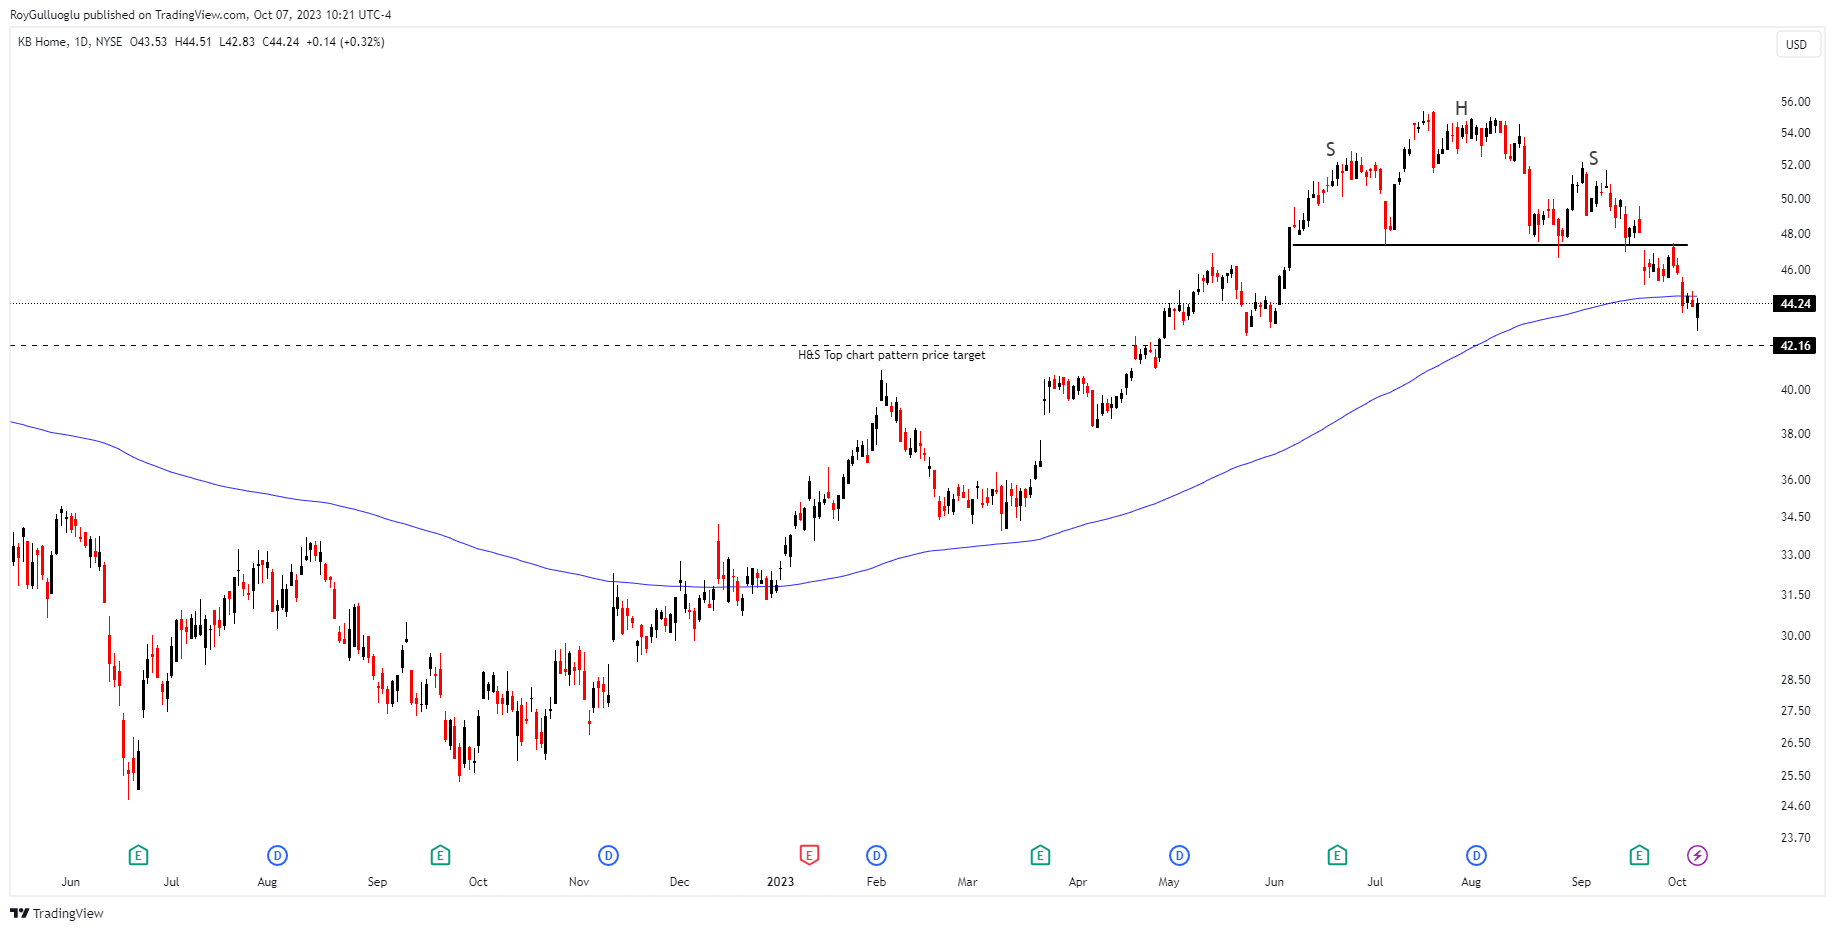
You can click on the KBH ticker above to access the first report explaining the RATIONALE behind the trade idea.
The trading signal was given when the price pulled back to the support of the H&S Top chart pattern.
Since then the bearish movement resumed and broke down the 200 day-EMA which is known as a significant trend filter.
KBH is in the residential construction industry which is very sensitive to yield movements. The driver behind the bearish movement is mainly the upward momentum of the long-term US treasury yields.
At the weekly close of the stock market, the equities became insensitive to the US yield movement and SPX closed 1.18% higher daily in Magnificant 7`s lead.
Considering the headline Nonfarm payroll data it is not easy to understand the equities` reaction at the weekly close. Recently, the main discourse of the market has been `good data-bad pricing` because good data for the economy such as headline non-farm payroll data provides FED more room to hike and a potential increase in the yields would harm the equities. But…
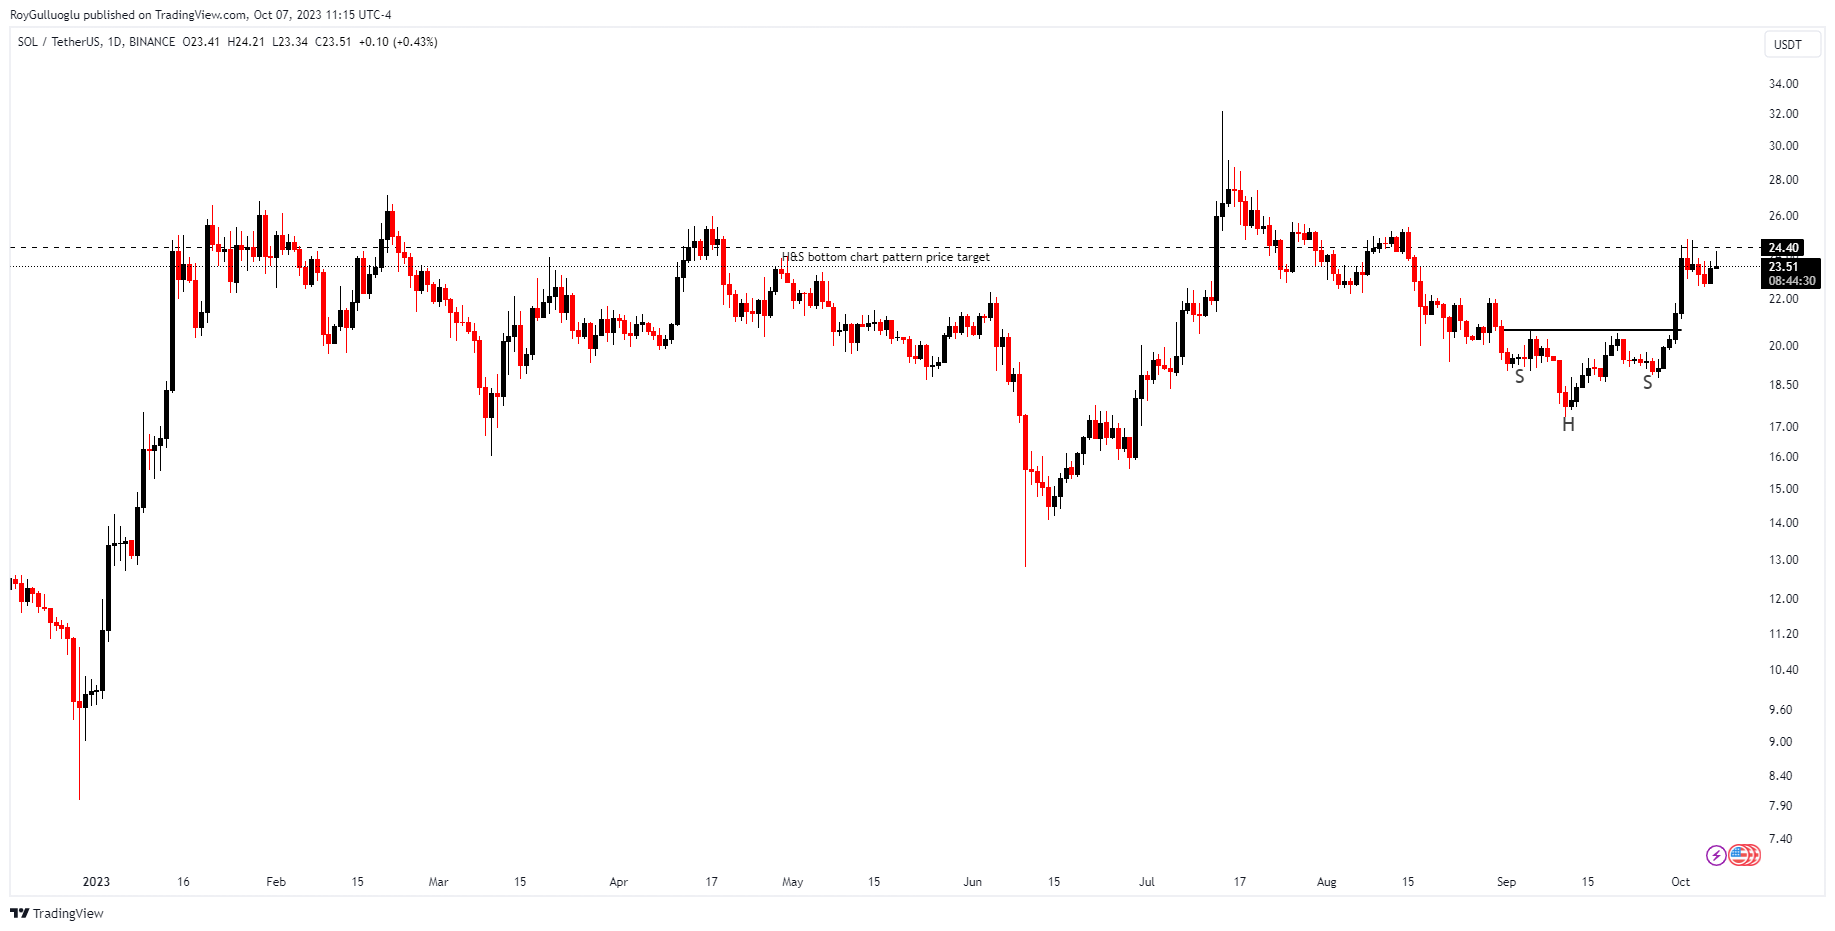
SOLUSDT - Long Idea
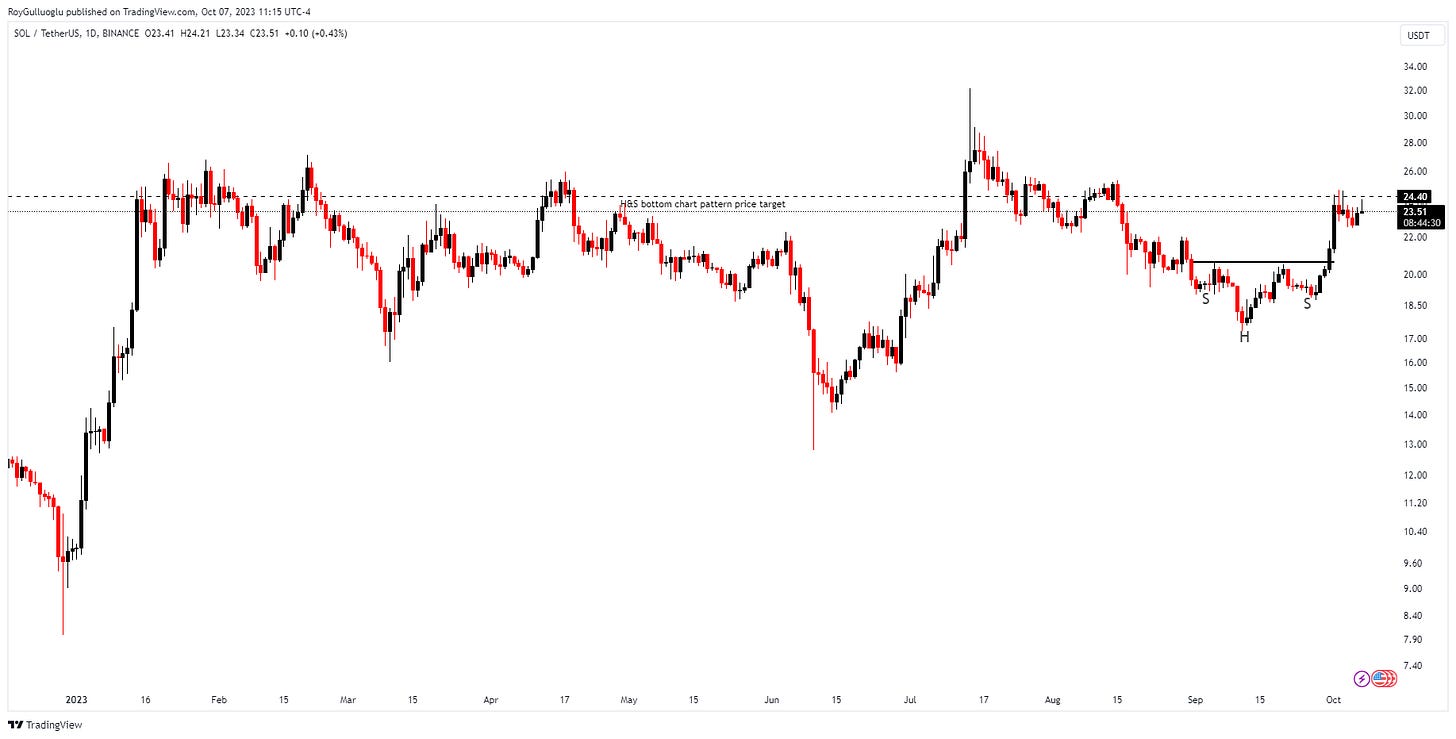
You can click on the SOLUSDT ticker above to access the first report explaining the RATIONALE behind the trade idea.
The trading signal was given before the breakout, then the price reached the H&S bottom chart pattern price target.