

New setups
TTF1!/NG1! SPREAD - Long Idea
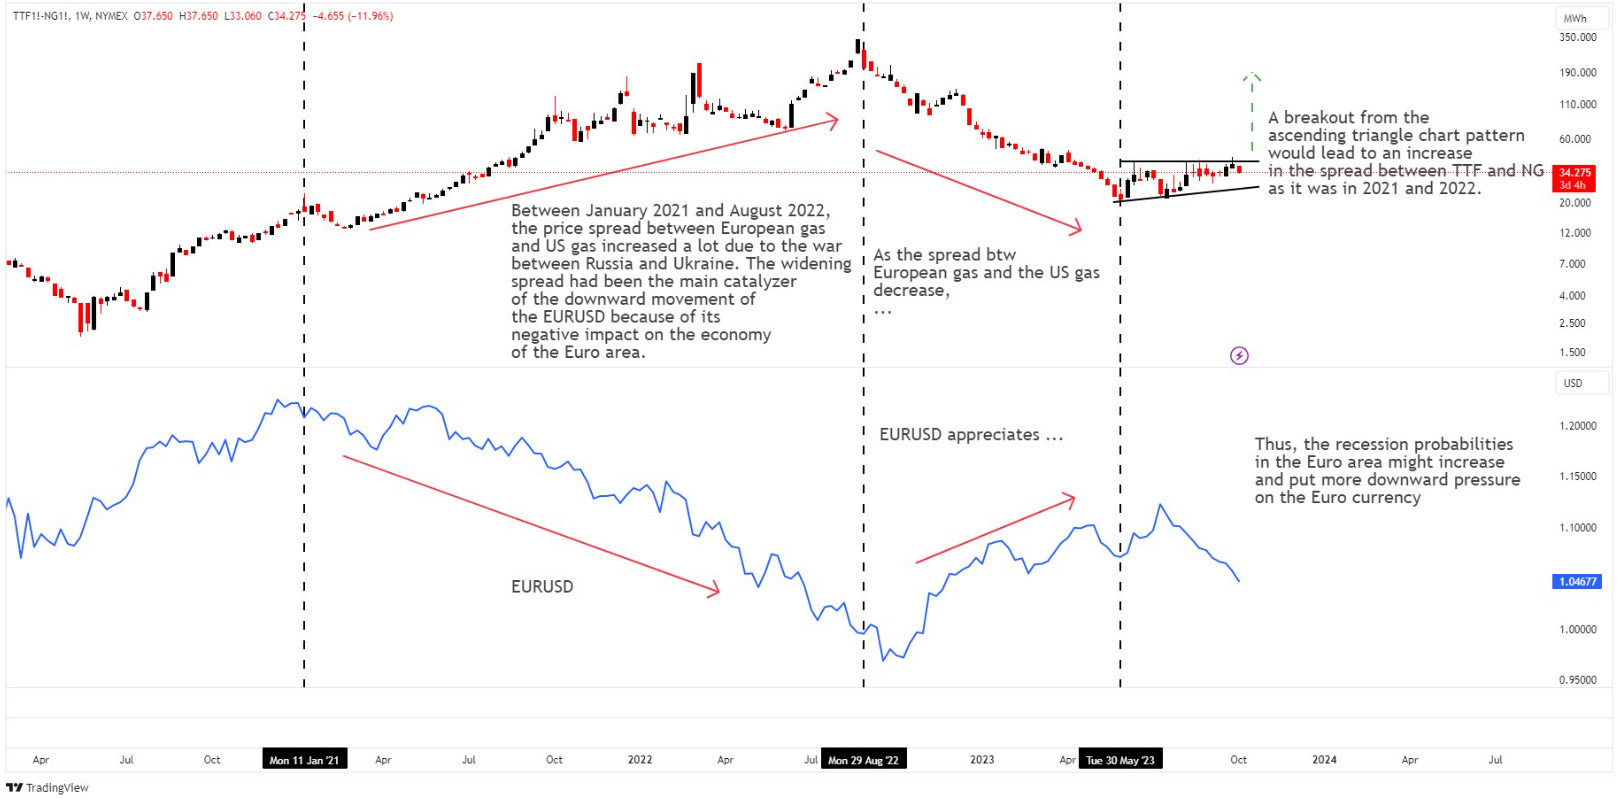
Basically, this trade idea suggests that to take a long position on the spread between the TTF(European natural gas-Title Transfer Facility, a natural gas hub in the Netherlands) and NG (US natural gas), one should buy the same nominal value of TTF while simultaneously selling NG. This strategy essentially might act as a derivative of being short on EURUSD, implying that movements in the TTF and NG spread can serve as an indicator or predictor of changes in the EURUSD exchange rate. In essence, it's a way to benefit from the relationship between these energy markets and currency fluctuations.
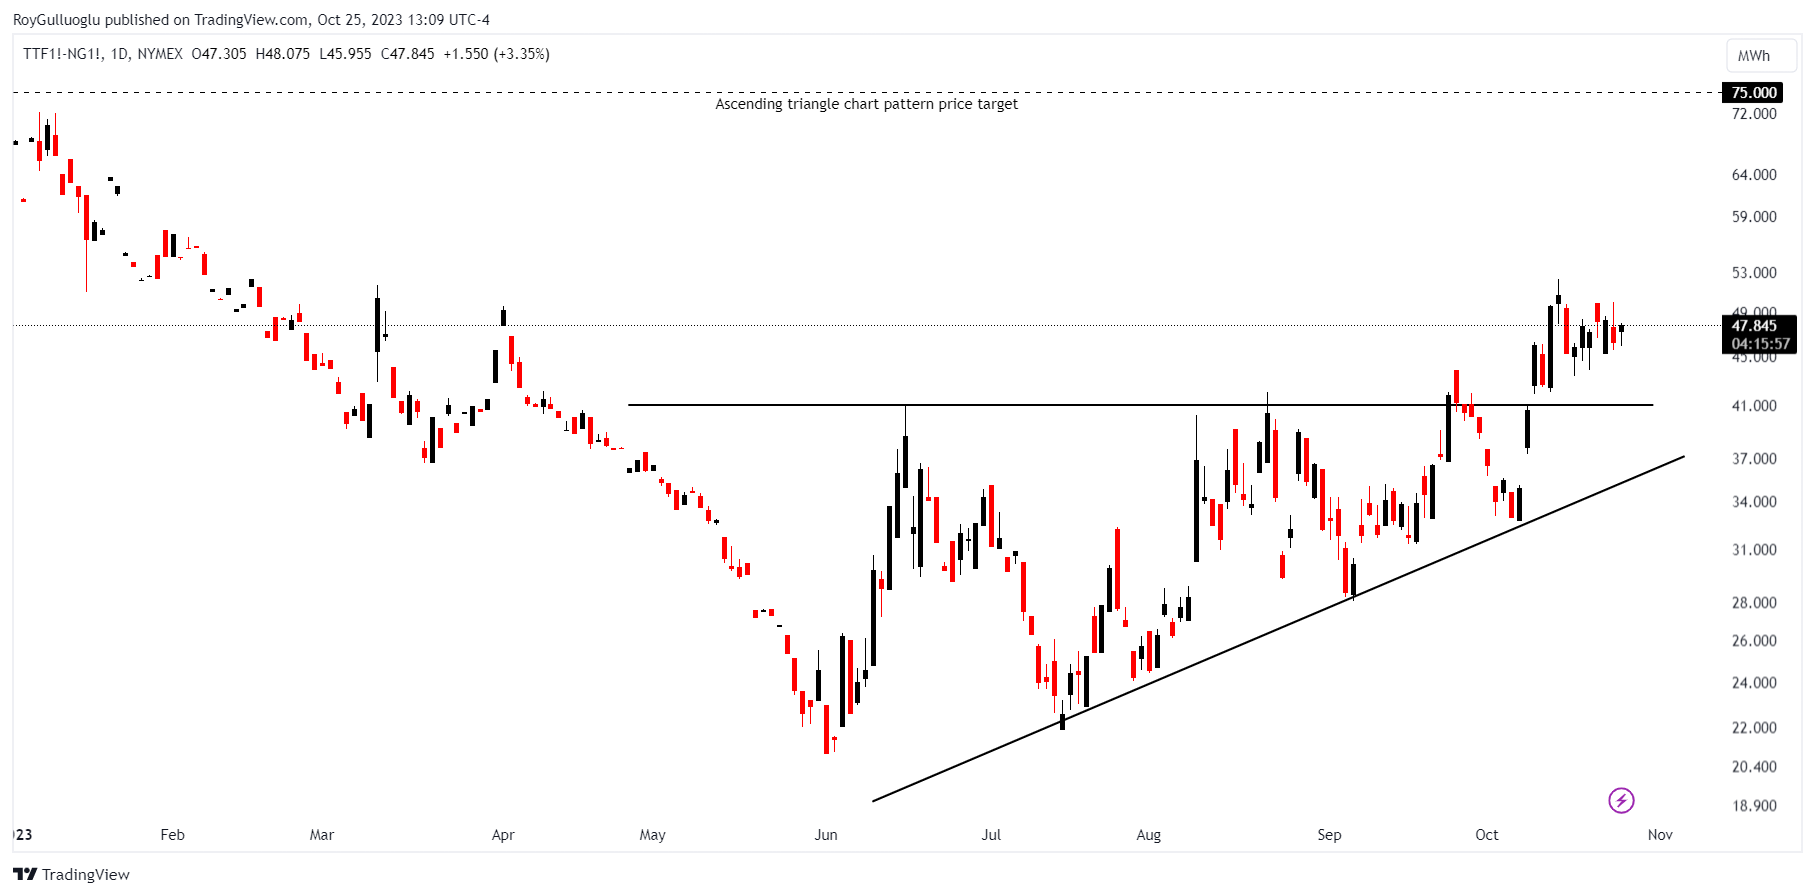
The above daily chart formed an approximately 3-month-long ascending triangle chart pattern as a bullish reversal after a downtrend.
Within this pattern, the horizontal boundary at 41 levels acted as strong resistance.
A daily close above 44.18 levels validated the breakout from the 3-month-long ascending triangle chart pattern.
The potential price target, based on this chart pattern, is 75 levels.

MXNJPY - Short Idea
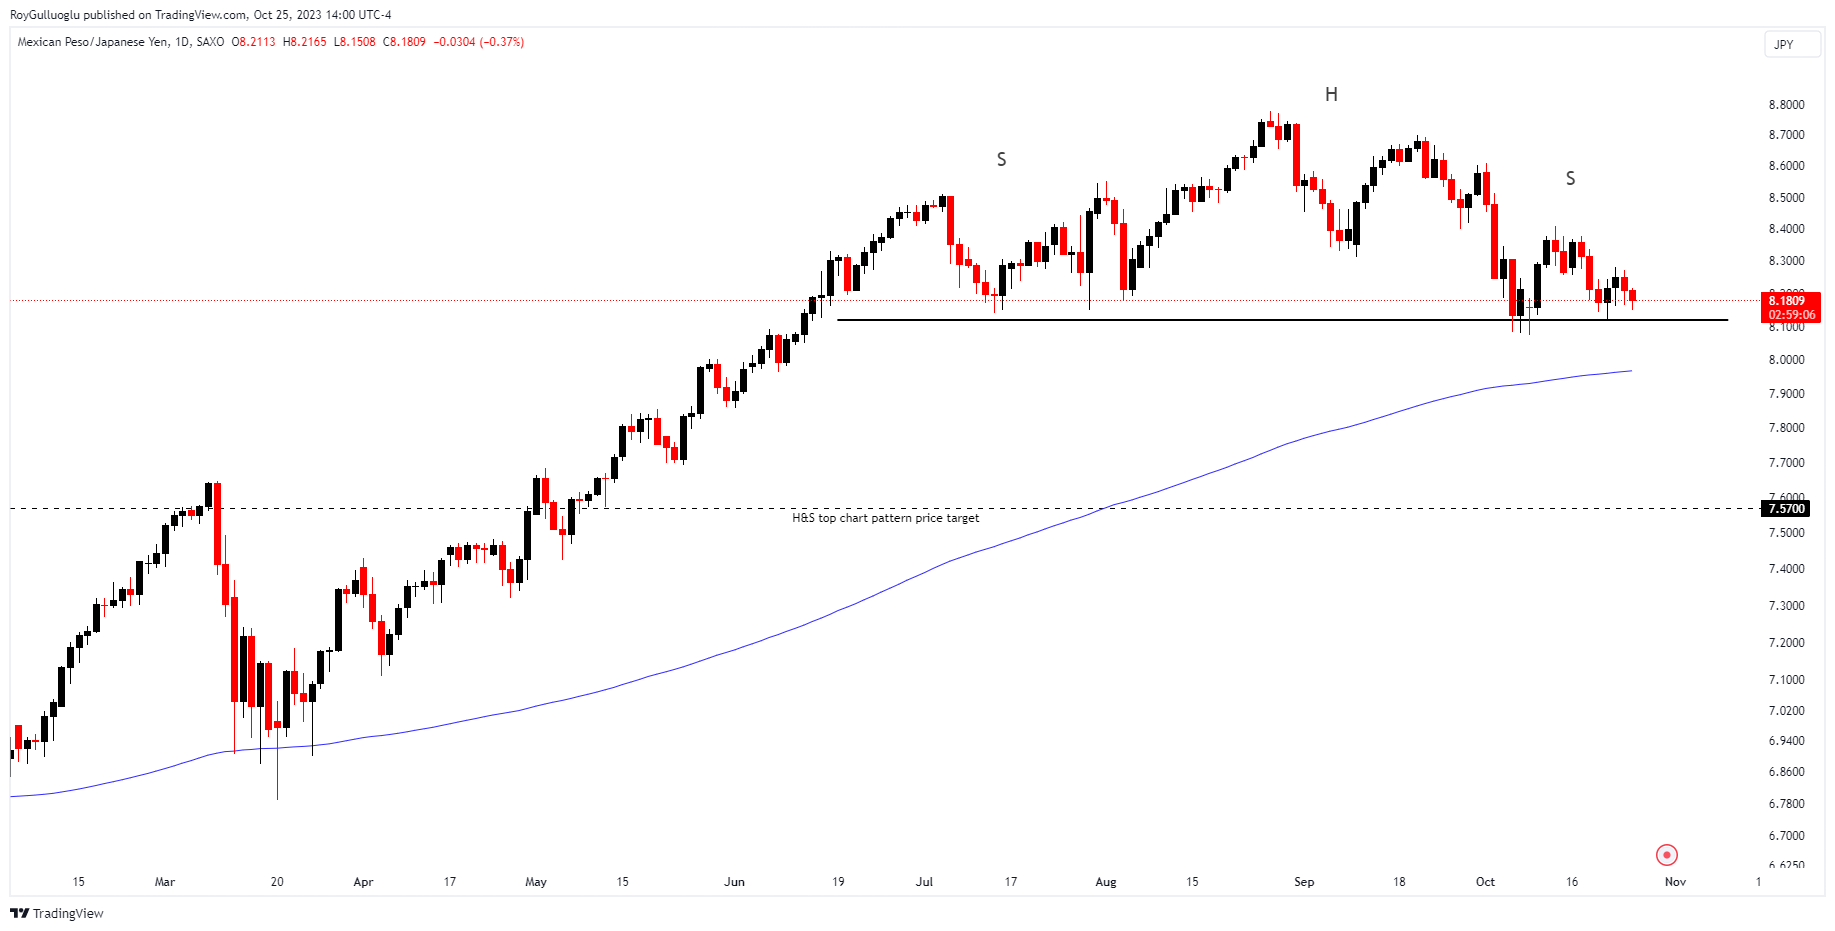
The above daily chart formed an approximately 3-month-long H&S top chart pattern as a bearish reversal after an uptrend.
Within this pattern, the horizontal boundary at 8.12 levels acts as strong support.
A daily close below 8 levels would validate the breakout from the 3-month-long H&S top chart pattern. That might also be a breakdown below the 200-day EMA which I use as a trend filter.
The potential price target, based on this chart pattern, is 7.57 levels.
The crucial element in this trade idea is the Japanese yen (JPY). The market anticipates that the Bank of Japan (BoJ) will adjust its yield curve control, especially since it's the only central bank that continues to implement monetary policy easing. Therefore, keeping a close eye on the USDJPY exchange rate, specifically the level around 150, is essential for this trade idea. Movements in the USDJPY exchange rate will likely play a significant role in this trading strategy.
To summarize this idea in particular, if the BoJ ceases its yield curve control, it is expected that the MXNJPY exchange rate will decrease in value, and there will likely be a breakdown in the "Head and Shoulders" (H&S) top chart pattern.
XRPUSDT - Short Idea
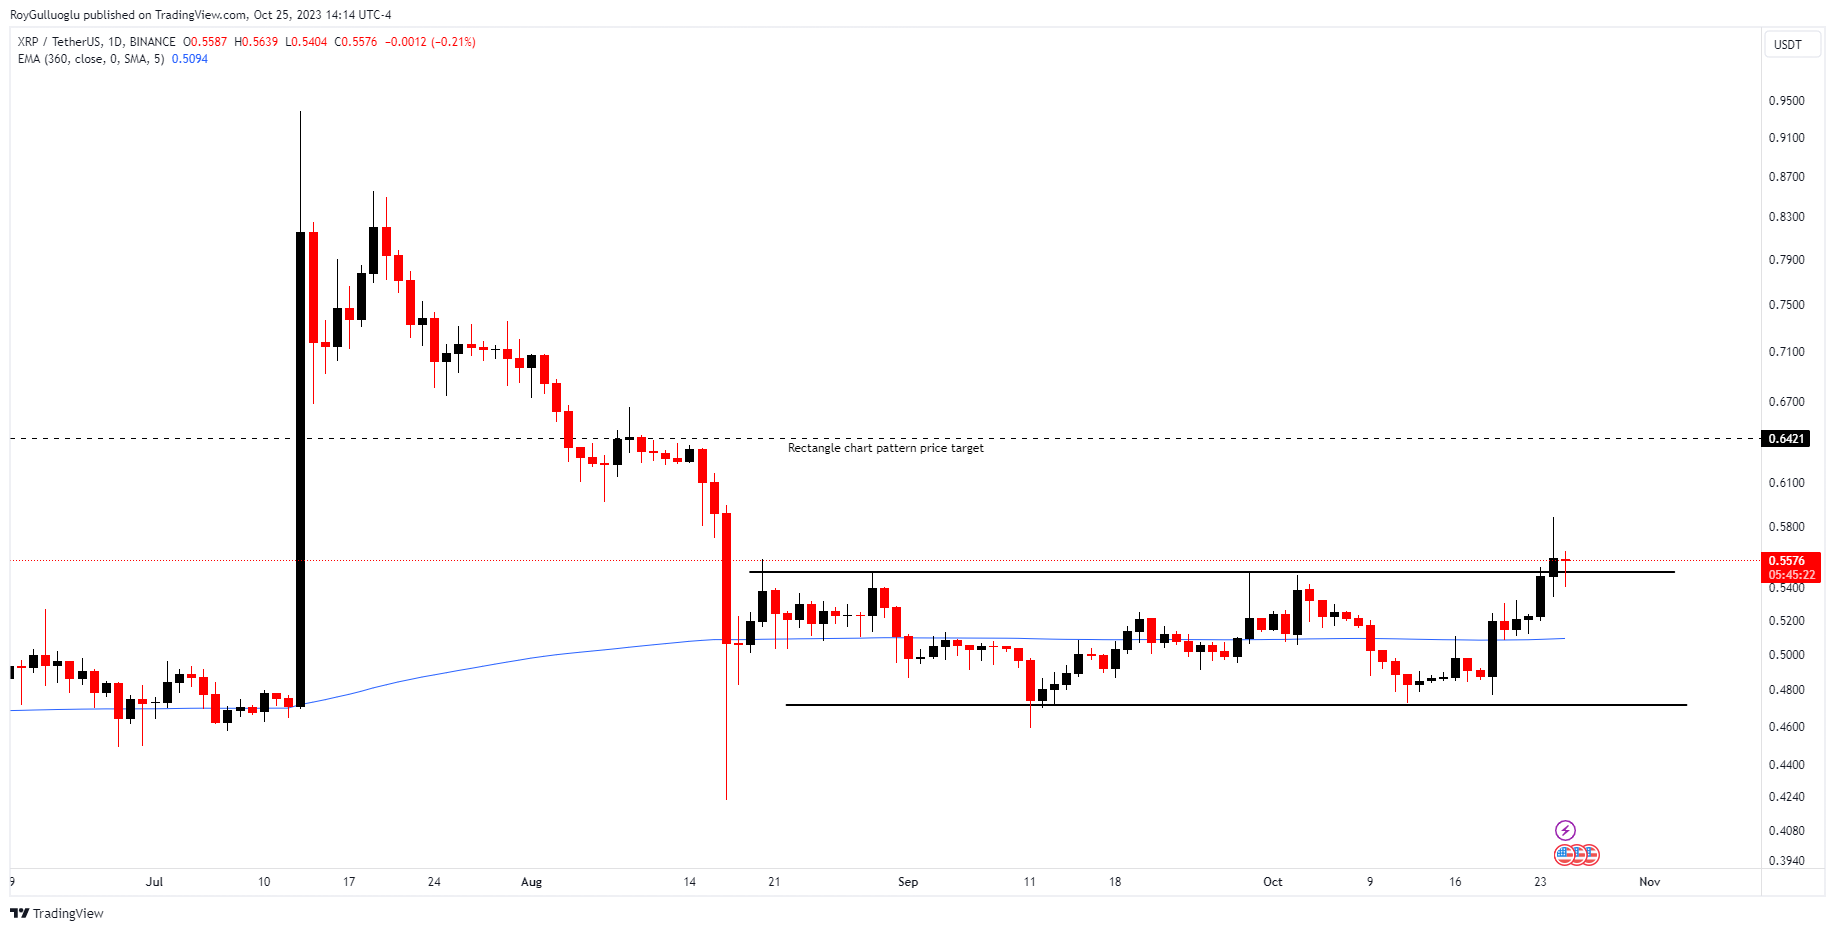
The above daily chart formed an approximately 2-month-long rectangle chart pattern as a bullish reversal after a downtrend.
Within this pattern, the horizontal boundary at 0.55 levels acts as strong resistance.
A daily close below 0.5691 levels would validate the breakout from the 2-month-long rectangle chart pattern.
The potential price target, based on this chart pattern, is 0.6421 levels.
LINKUSDT - Long Idea
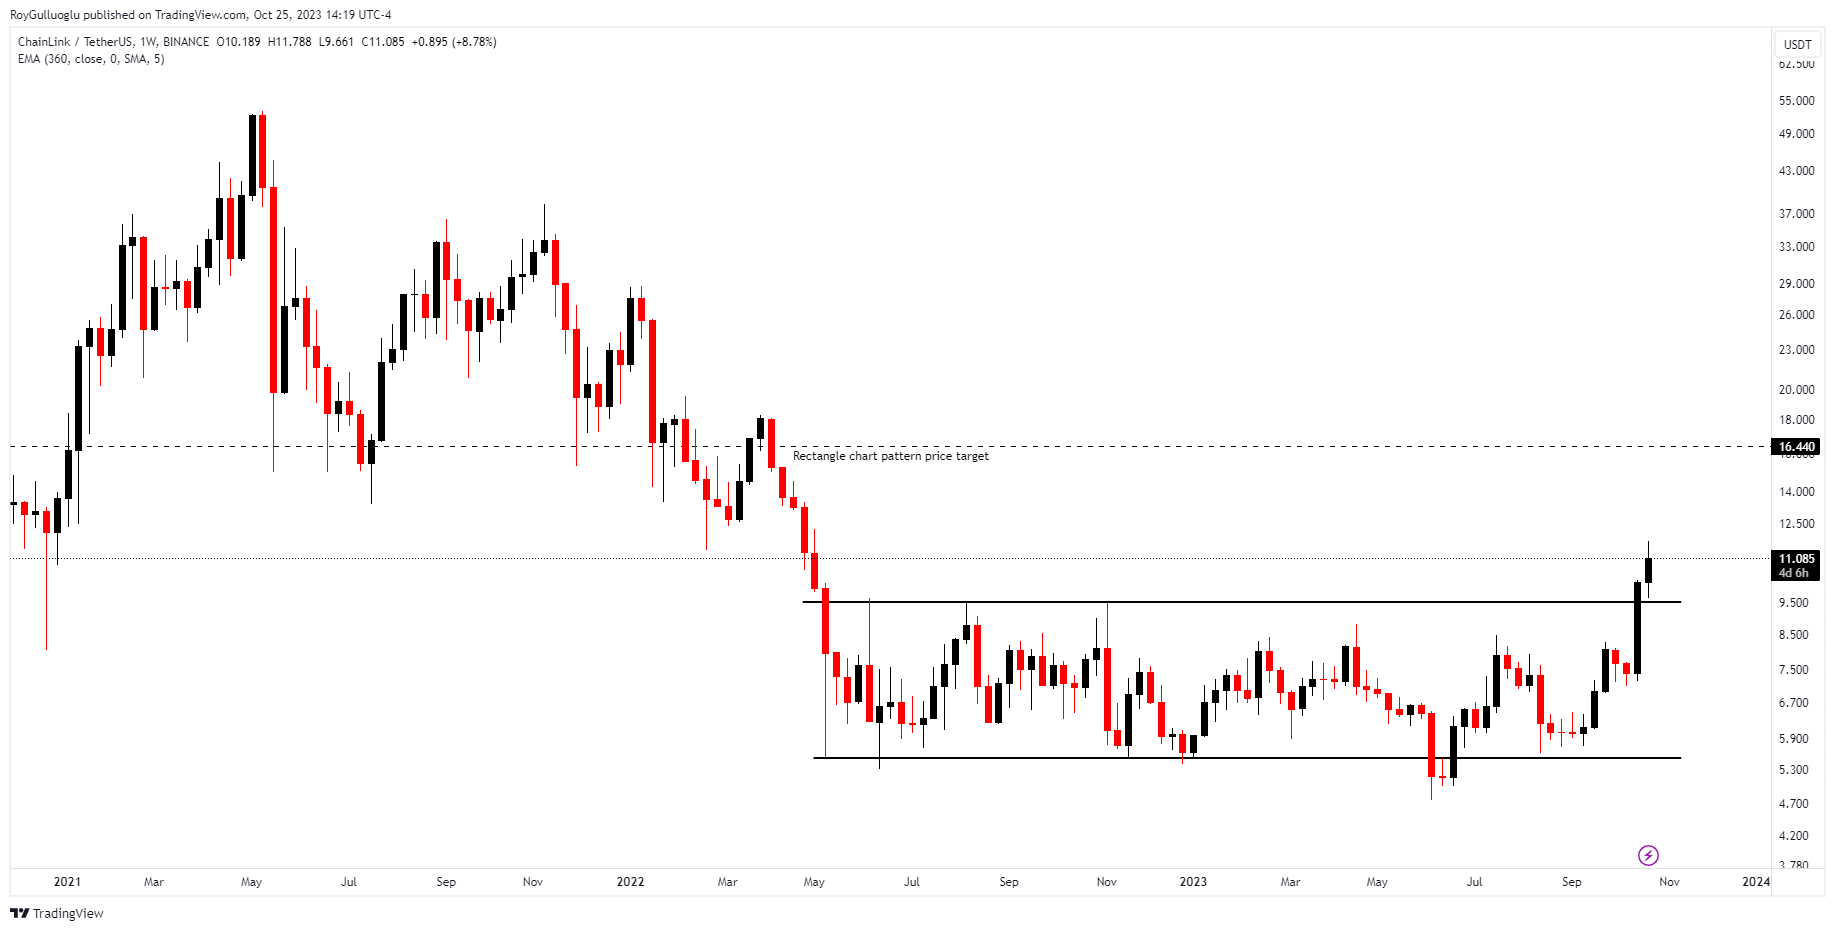
The above weekly chart formed an approximately 1.5-year-long rectangle chart pattern as a bullish reversal after a downtrend.
Within this pattern, the horizontal boundary at 9.5 levels acted as strong resistance.
A daily close above 10 levels validated the breakout from the 1.5-year-long rectangle chart pattern.
Based on this chart pattern, the potential price target is 16.44 levels.
EGLDUSDT - Long Idea
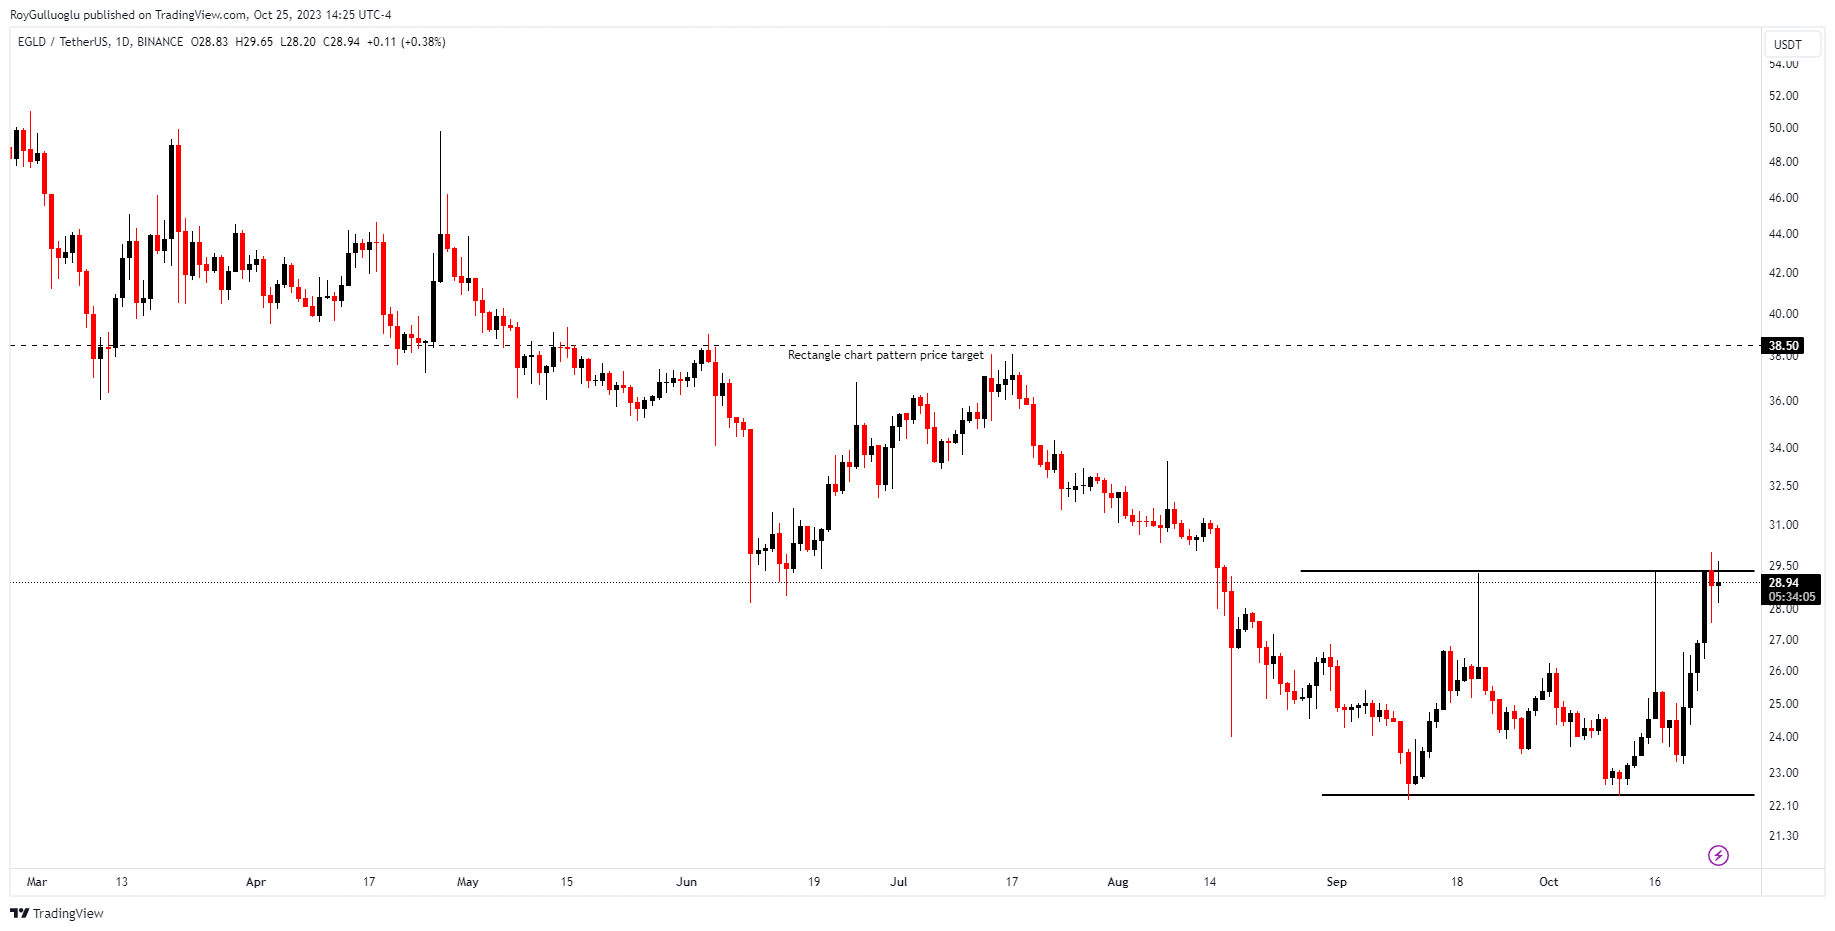
The above daily chart formed an approximately 1.5-month-long rectangle chart pattern as a bullish reversal after a downtrend.
Within this pattern, the horizontal boundary at 29.3 levels acts as strong resistance.
A daily close above 30.9 levels would validate the breakout from the 1.5-year-month rectangle chart pattern.
The potential price target, based on this chart pattern, is 38.5 levels.
LTCUSDT - Long Idea
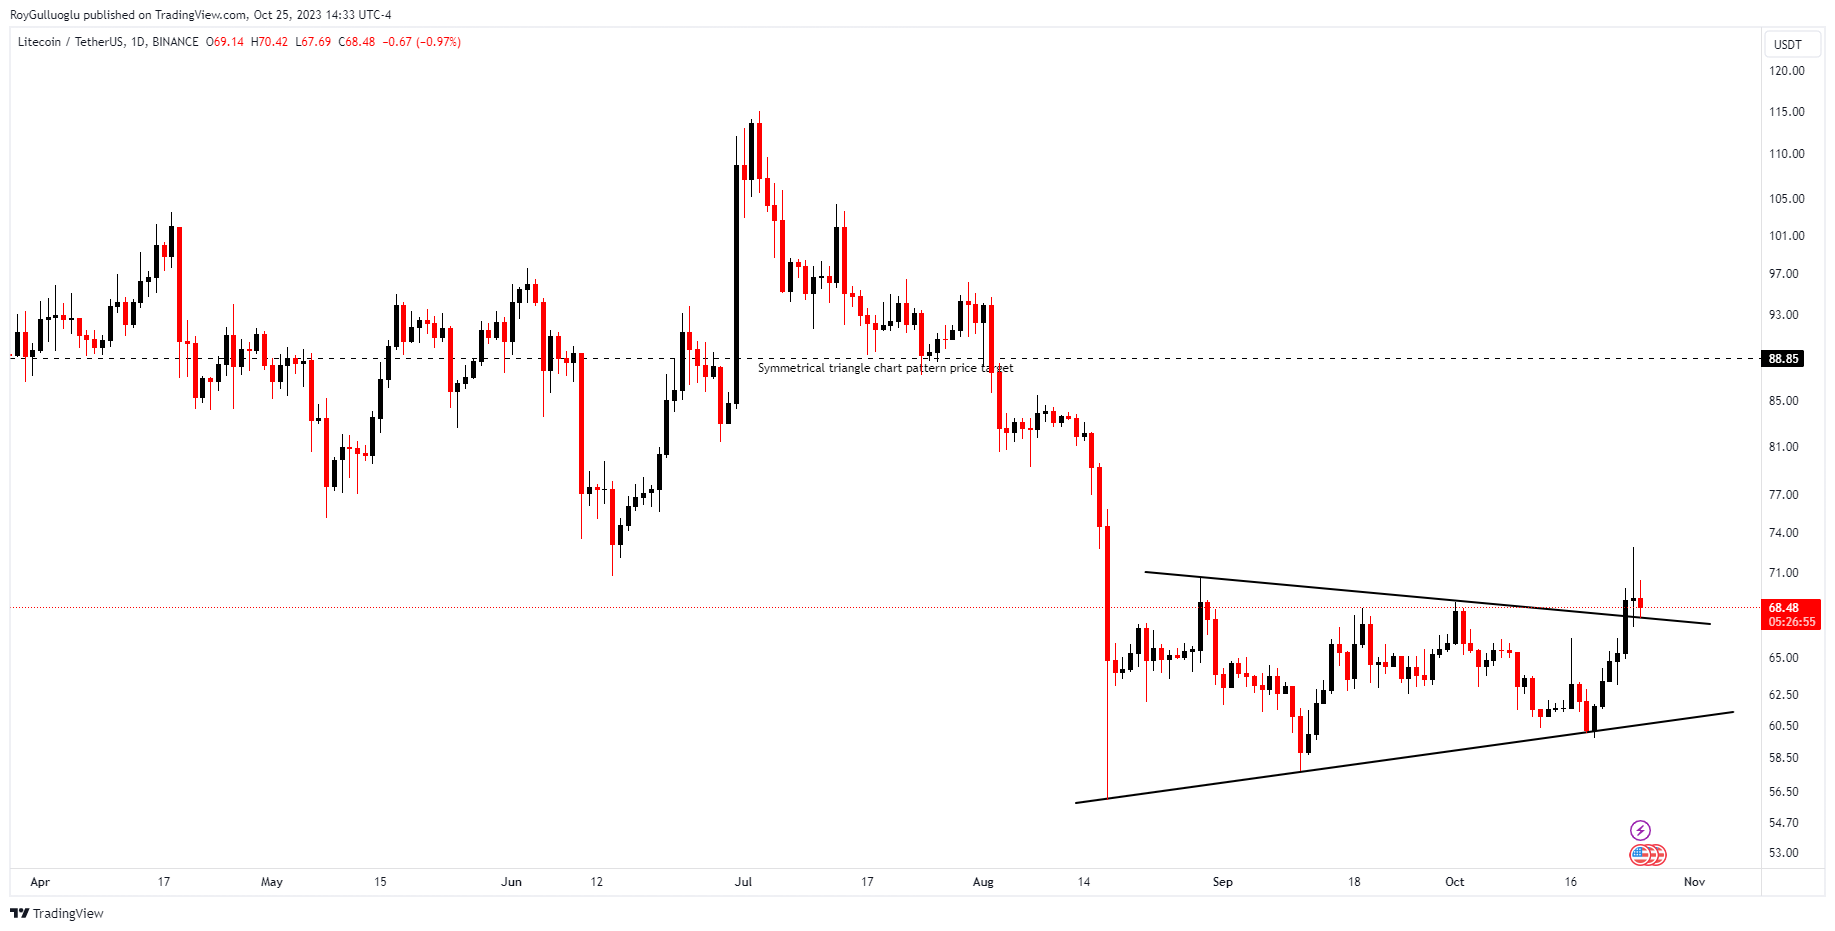
The above daily chart formed an approximately 2-month-long symmetrical triangle chart pattern as a bullish reversal after a downtrend.
Within this pattern, the upper boundary at 67.8 levels acts as strong resistance.
A daily close above 70.3 levels would validate the breakout from the 2-month-long symmetrical triangle chart pattern.
The potential price target, based on this chart pattern, is 88.85 levels.
Follow-ups
USDSGD - Long Idea
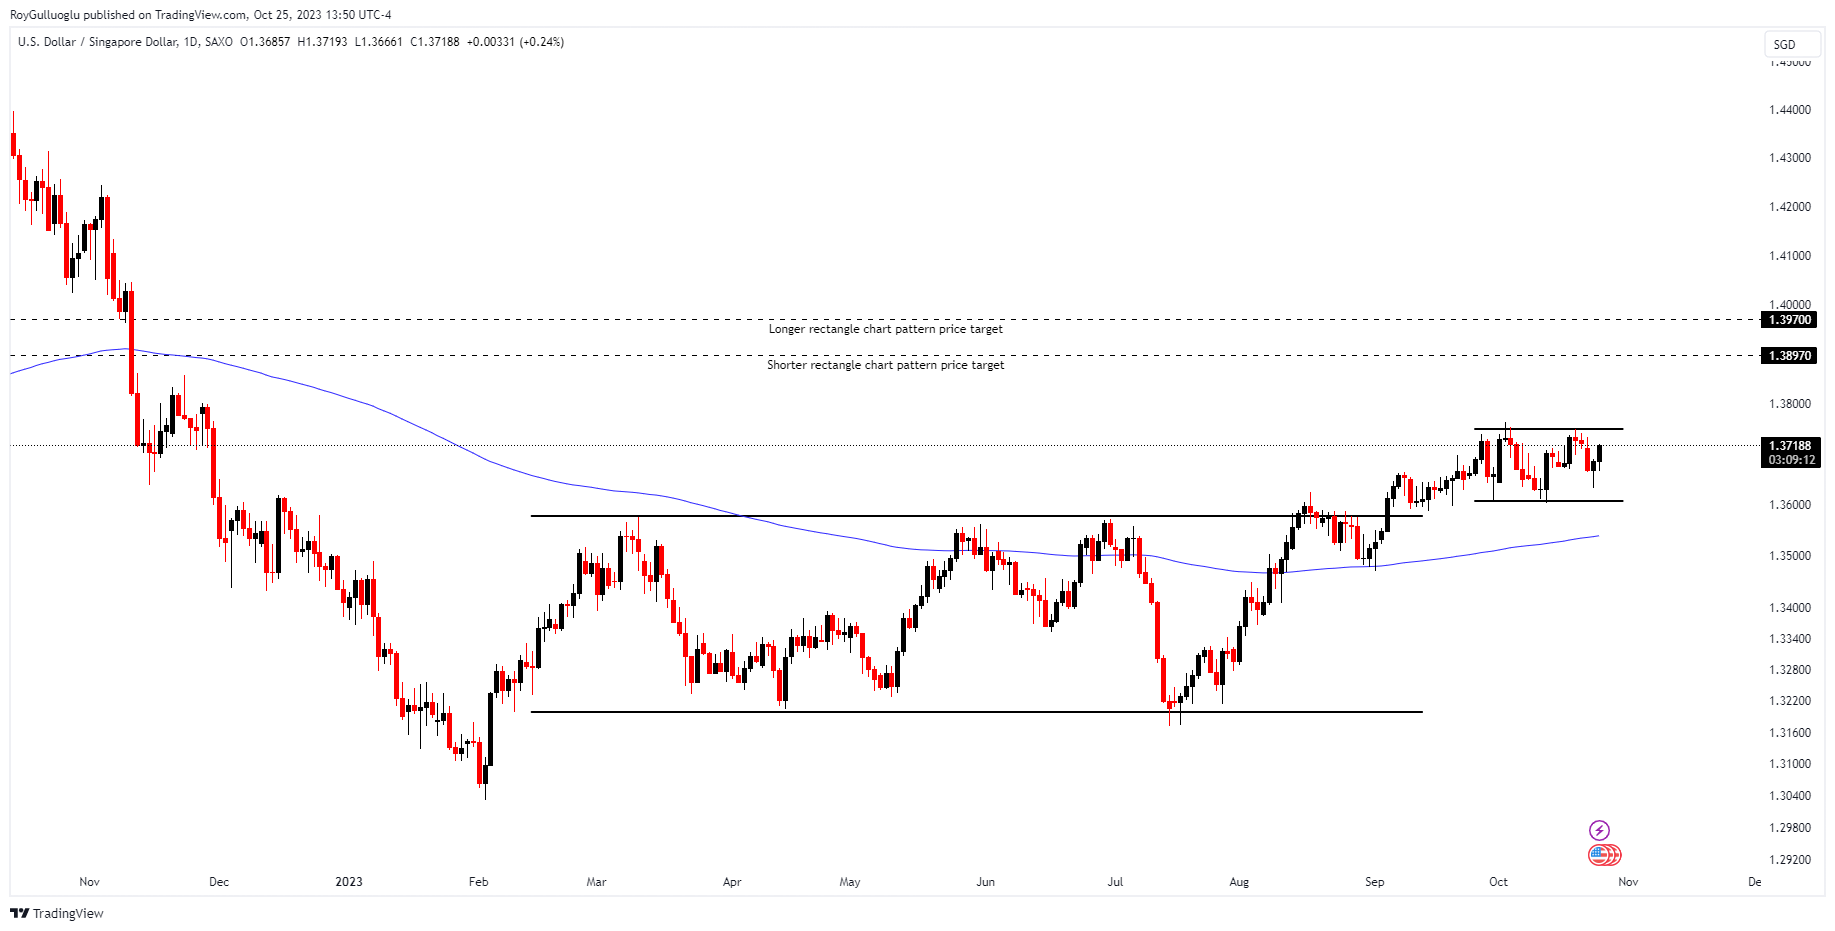
You can click on the USDSGD ticker above to access the first tweet sharing the RATIONALE trade idea.
The above daily chart formed an approximately 4-month-long rectangle chart pattern.
Price broke out and then formed another 1-month-long rectangle chart pattern as a bullish continuation after an uptrend.
EURGBP - Long Idea
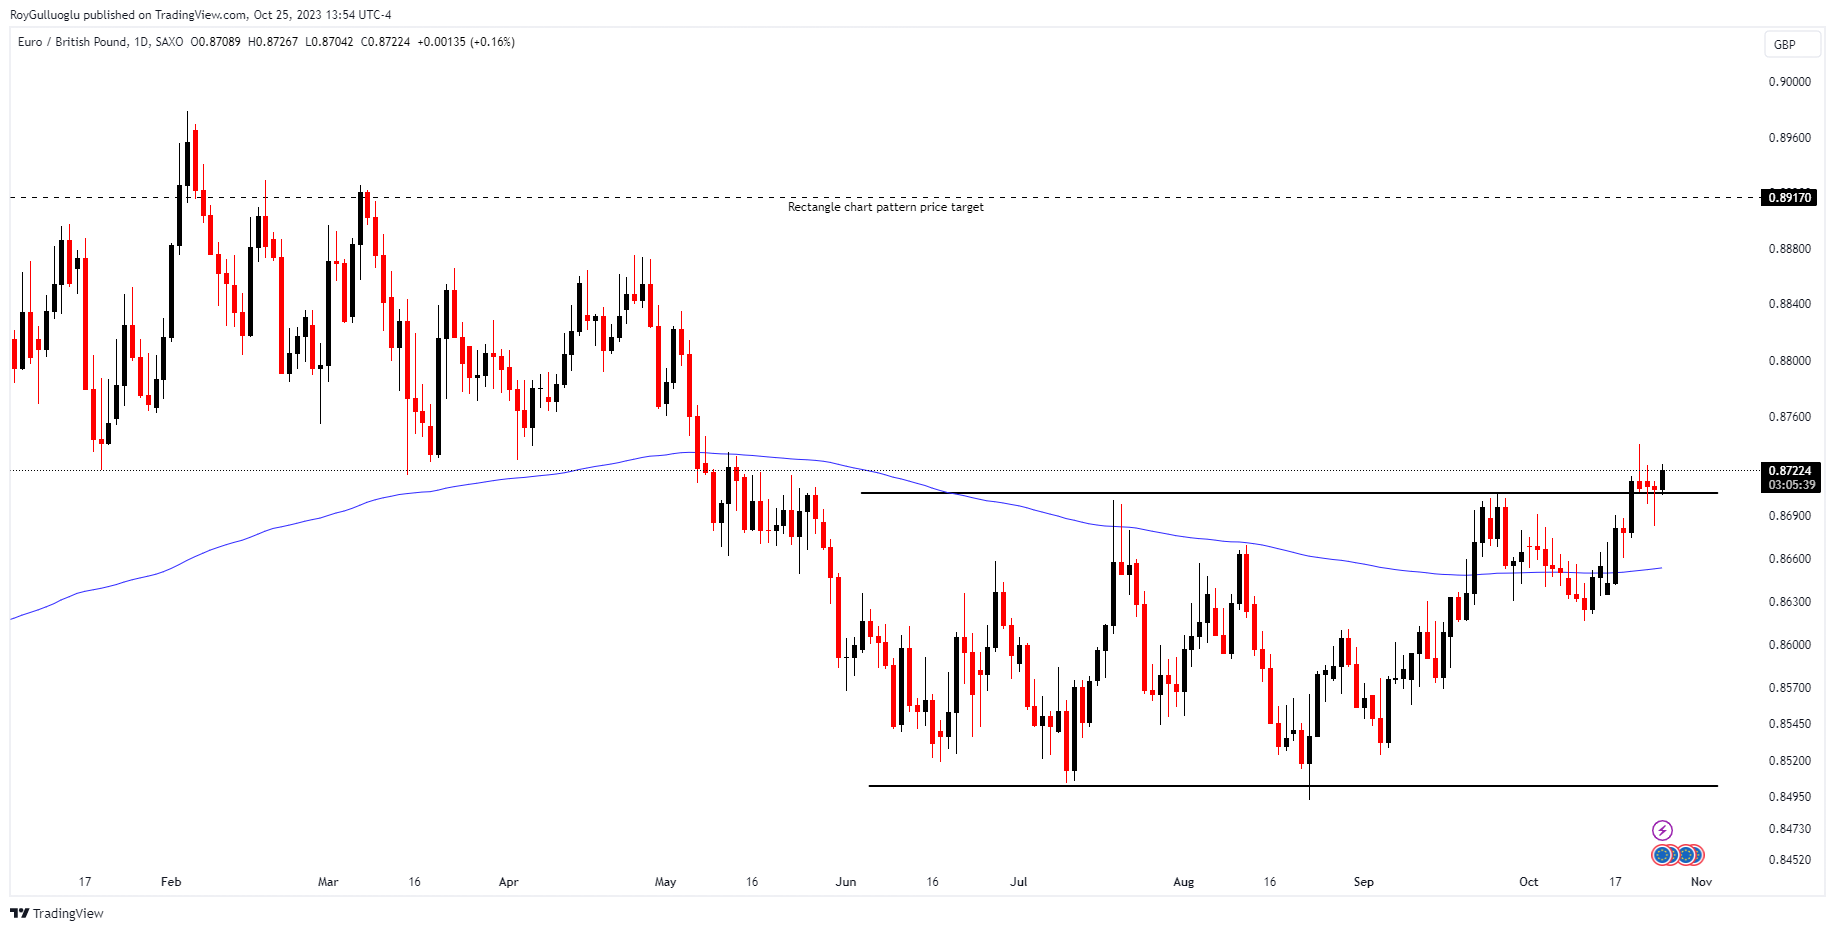
You can click on the EURGBP ticker above to access the first report explaining the RATIONALE behind the trade idea.
Monitoring the strength of a potential daily close above the 0.87 resistance level.
NQ1! - Short Idea
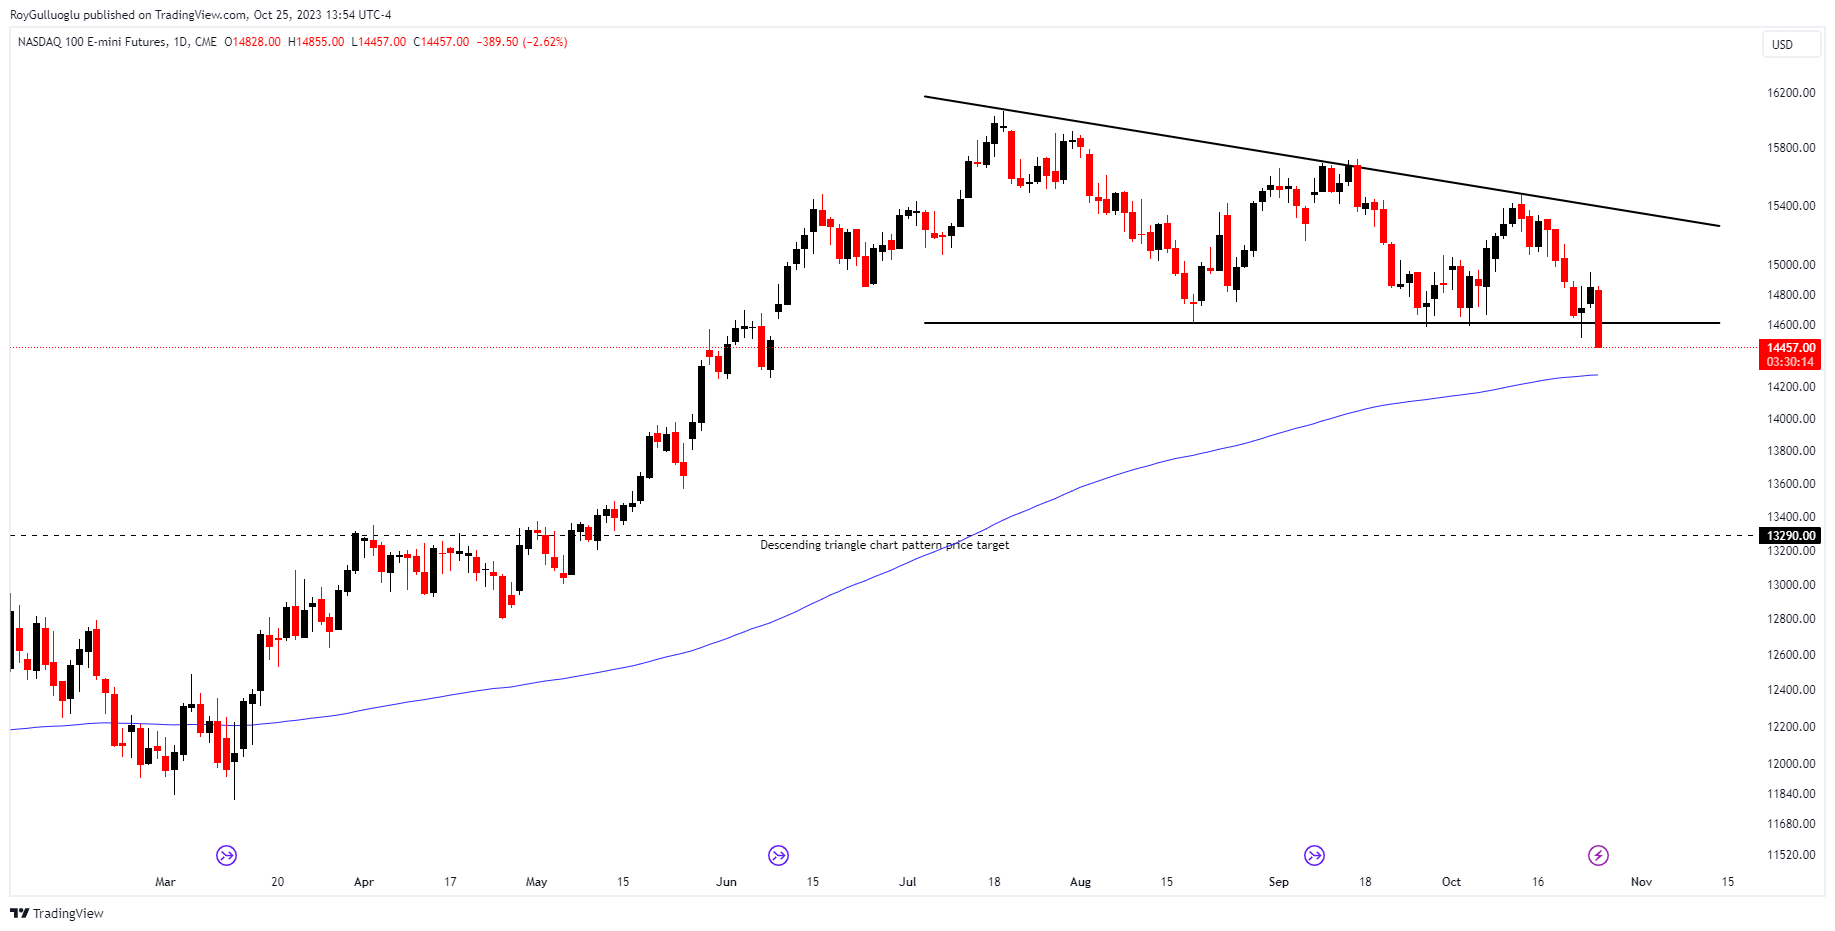
You can click on the NQ1! ticker above to access the first report explaining the RATIONALE behind the trade idea.
Monitoring the strength of a potential daily close below the 14610 resistance level.