

New setups
GBPAUD - Long Idea
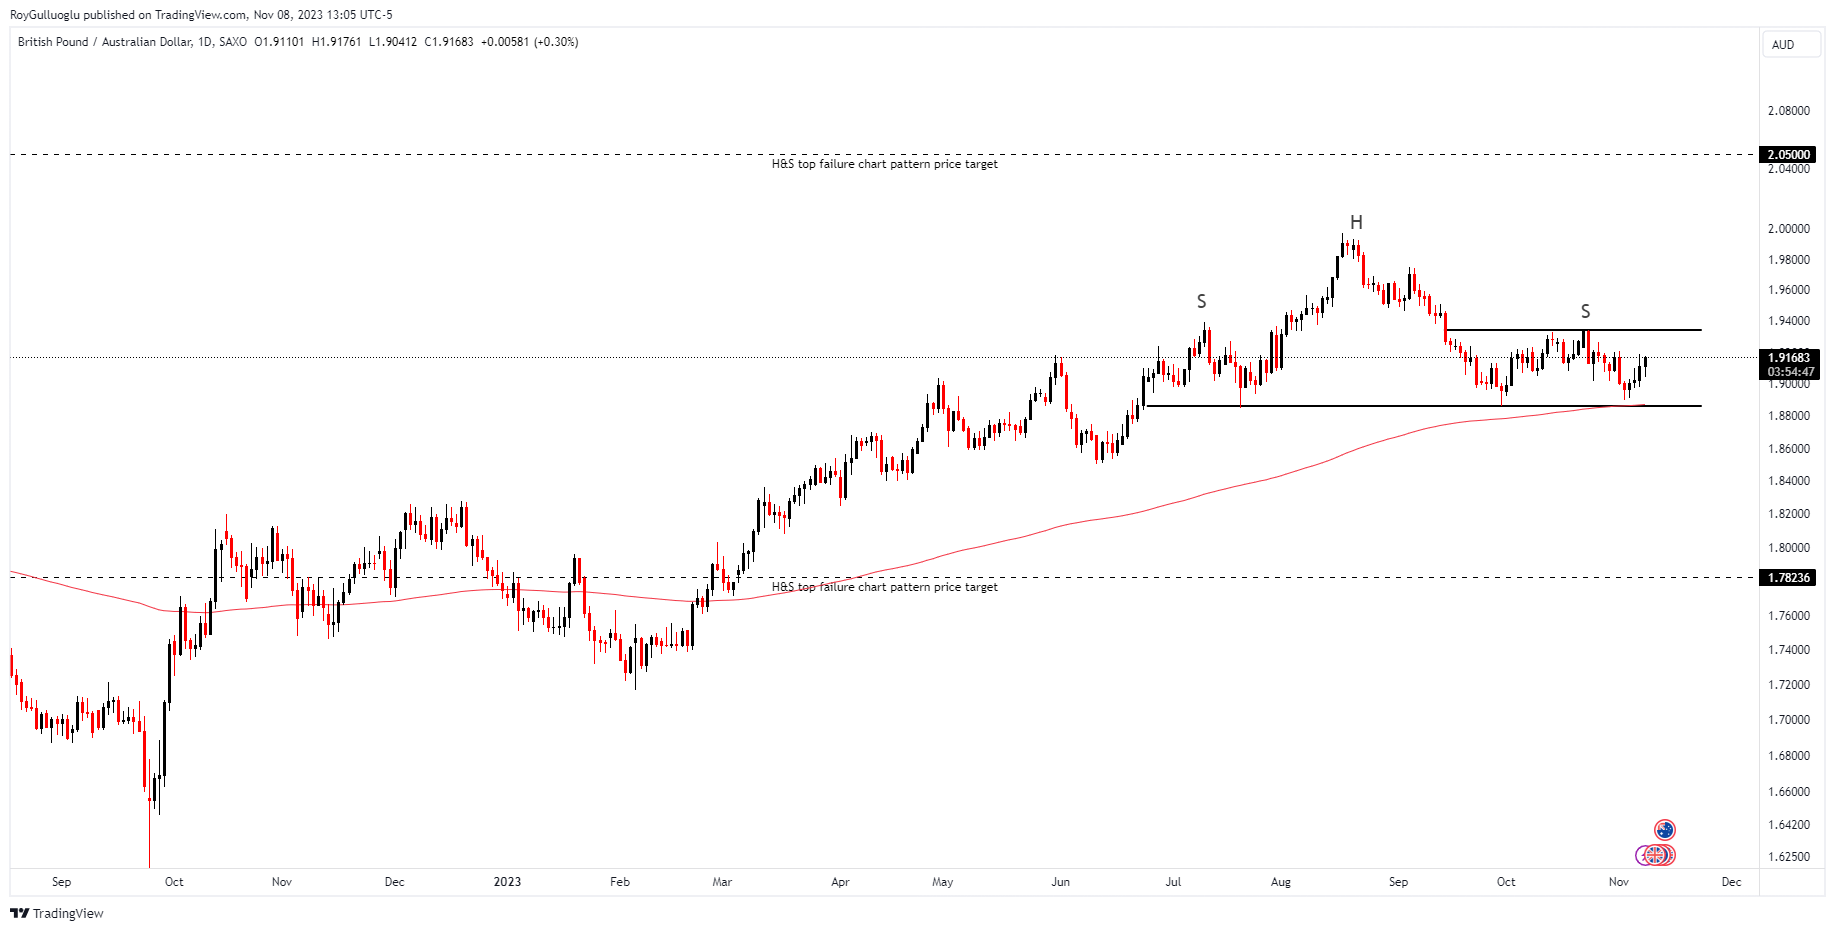
The above daily chart formed an approximately 3.5-month-long H&S top chart pattern.
Within this pattern, the horizontal boundaries at 1.9341 and 1.885 levels act as resistance and support.
A daily close above 1.953 levels would validate the breakout from the 3.5-month-long H&S top failure chart pattern as a bullish continuation.
A daily close below 1.866 levels would validate the breakdown from the 3.5-month-long H&S top chart pattern as a bearish reversal.
The potential price targets, based on the chart patterns, are respectively 2.05 and 1.78 levels.
GBPAUD short rationale:
The RBA hiked rates by 25 bp to 4.35% on 7 Nov due to the slow progress taken on inflation especially considering the home prices which got back all losses from the rate hike.
The IMF also suggested that a tighter monetary policy is necessary to return inflation to the RBA's desired range of 2-3%.
The RBA has maintained interest rates at a steady level since July, positioning itself as one of the early central banks to halt the rate hike trend. This puts them ahead of the curve compared to other central banks, making them potential first movers if additional rate hikes occur in the central banks in general especially considering the above factors. (Just as a reminder: They started to hike rates relatively late and finished early.)
GBPAUD Long rationale:
The BoE on the other hand decided to keep rates unchanged and said that borrowing costs were set to remain high for a while.
The 5.25% level might be the end of the hiking cycle, but maintaining a high-risk environment for a long time is questionable for the UK economy considering the growth risks.
USDCAD- Long Idea
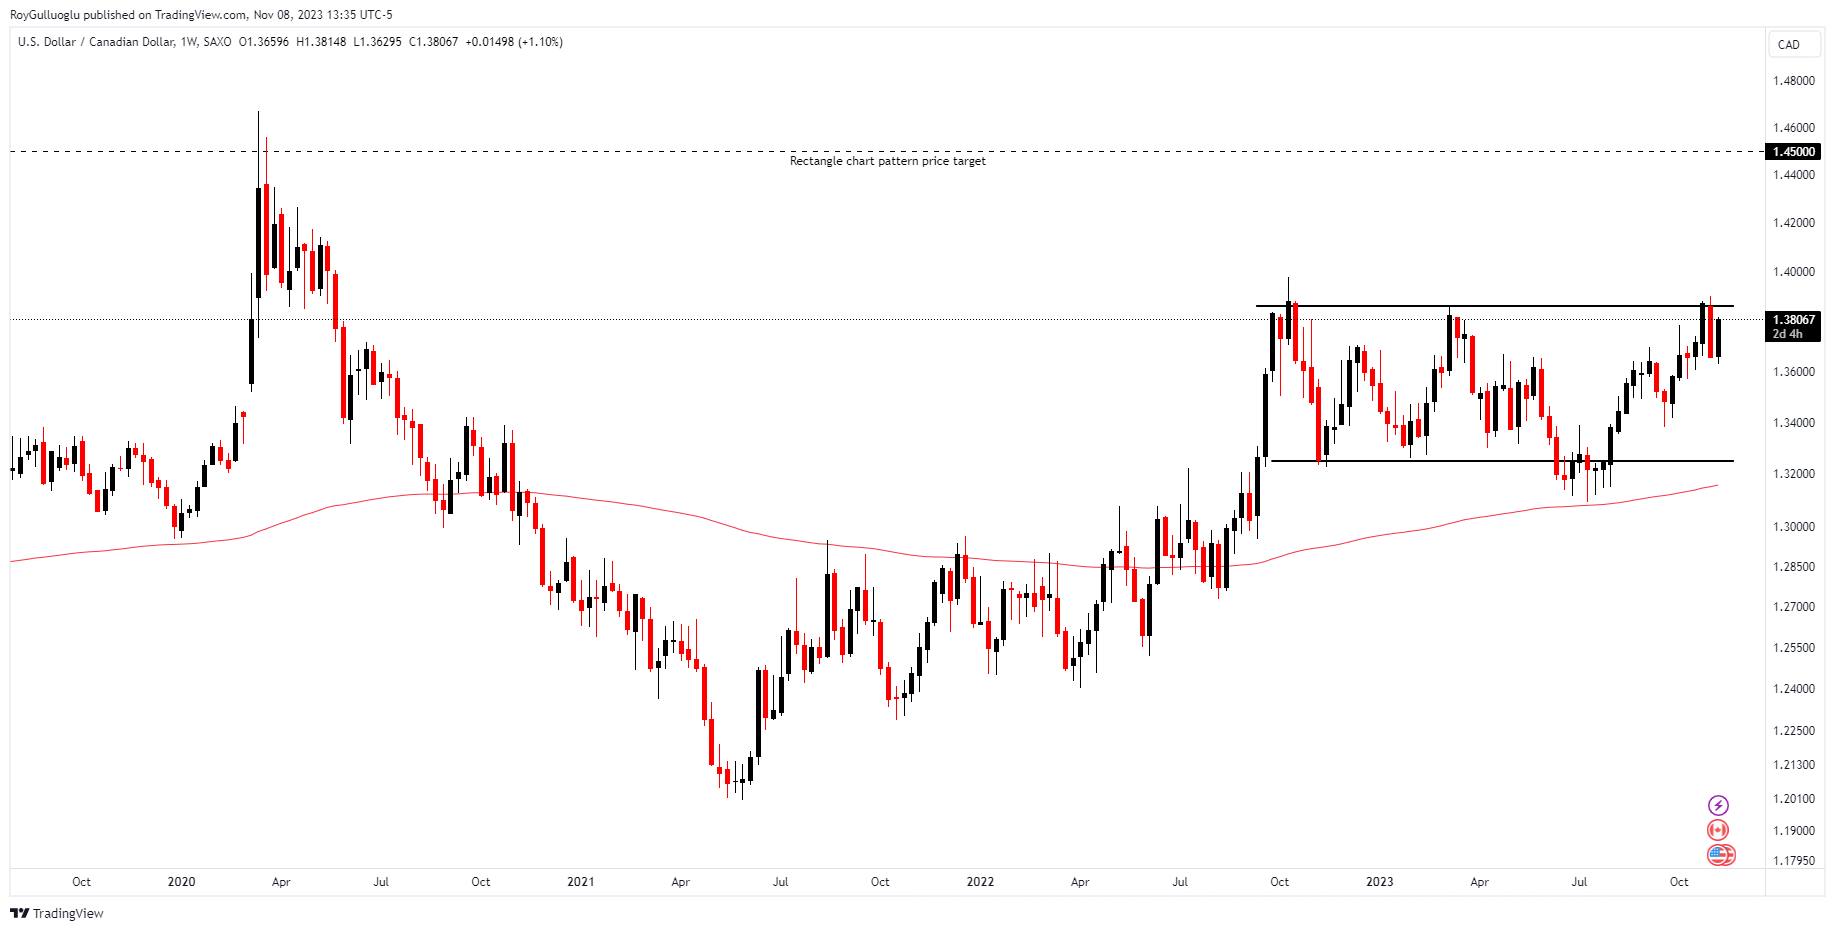
The above weekly chart formed an approximately 14-month-long rectangle chart pattern.
Within this pattern, the horizontal boundary at 1.386 levels acted as strong resistance.
A daily close above 1.3998 levels validated the breakout from the 14-month-long rectangle chart pattern.
The potential price target, based on this chart pattern, is 1.45 levels.
Let`s first examine the meaning of being long USD against CAD and understand the rationale behind the recent depreciation of the CAD,
As oil is an essential component of the Canadian economy, CAD exhibits a strong correlation with oil prices. During periods of strong global economic growth, both oil prices and the CAD are expected to rise.
As it happened at the beginning of the week, with the impact of the lower-than-expected Chinese export data(a threat to global economic growth), the oil price declined and the CAD depreciated against USD.
So if you believe that the global recession will be effective and the oil demand will be reduced in the following months, this bet makes sense. However, external supply risks should not be omitted. Especially, the ongoing war in the Middle East might put pressure on the oil supply which would lead to a surge in oil price and CAD.
Follow-ups
KC1! - Long Idea
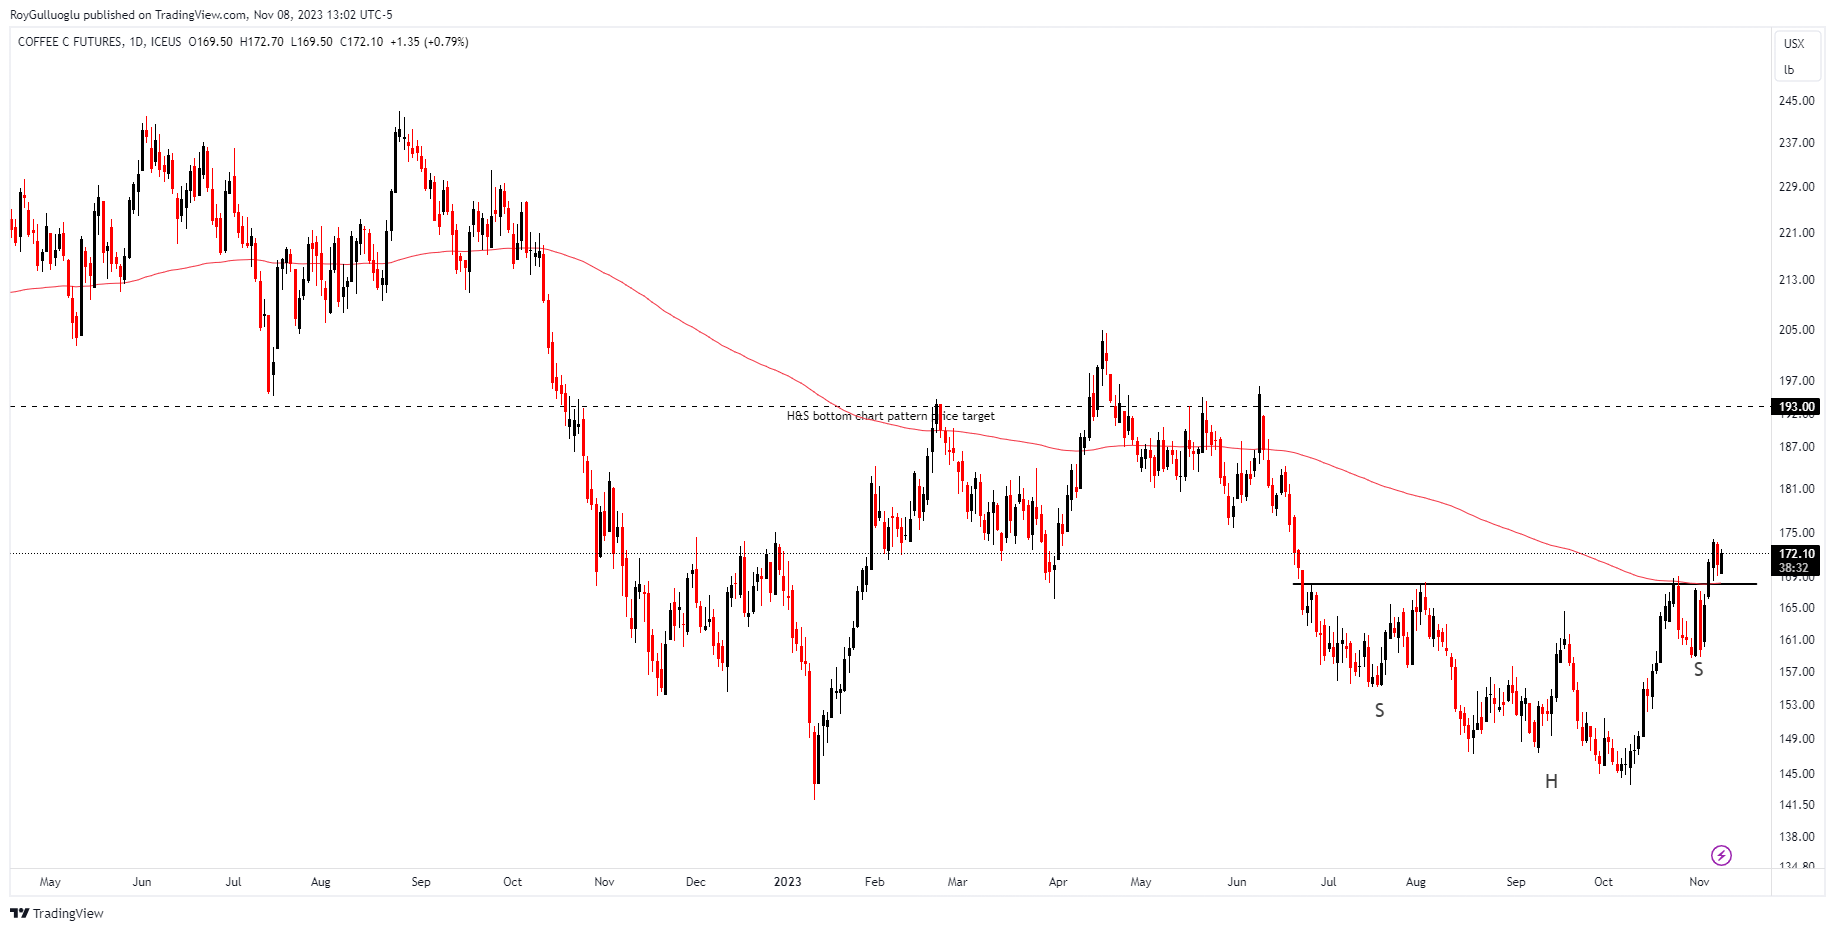
You can click the KC1! ticker above to access the first report explaining the RATIONALE behind the trade idea.
MXNJPY - Long/Short Idea
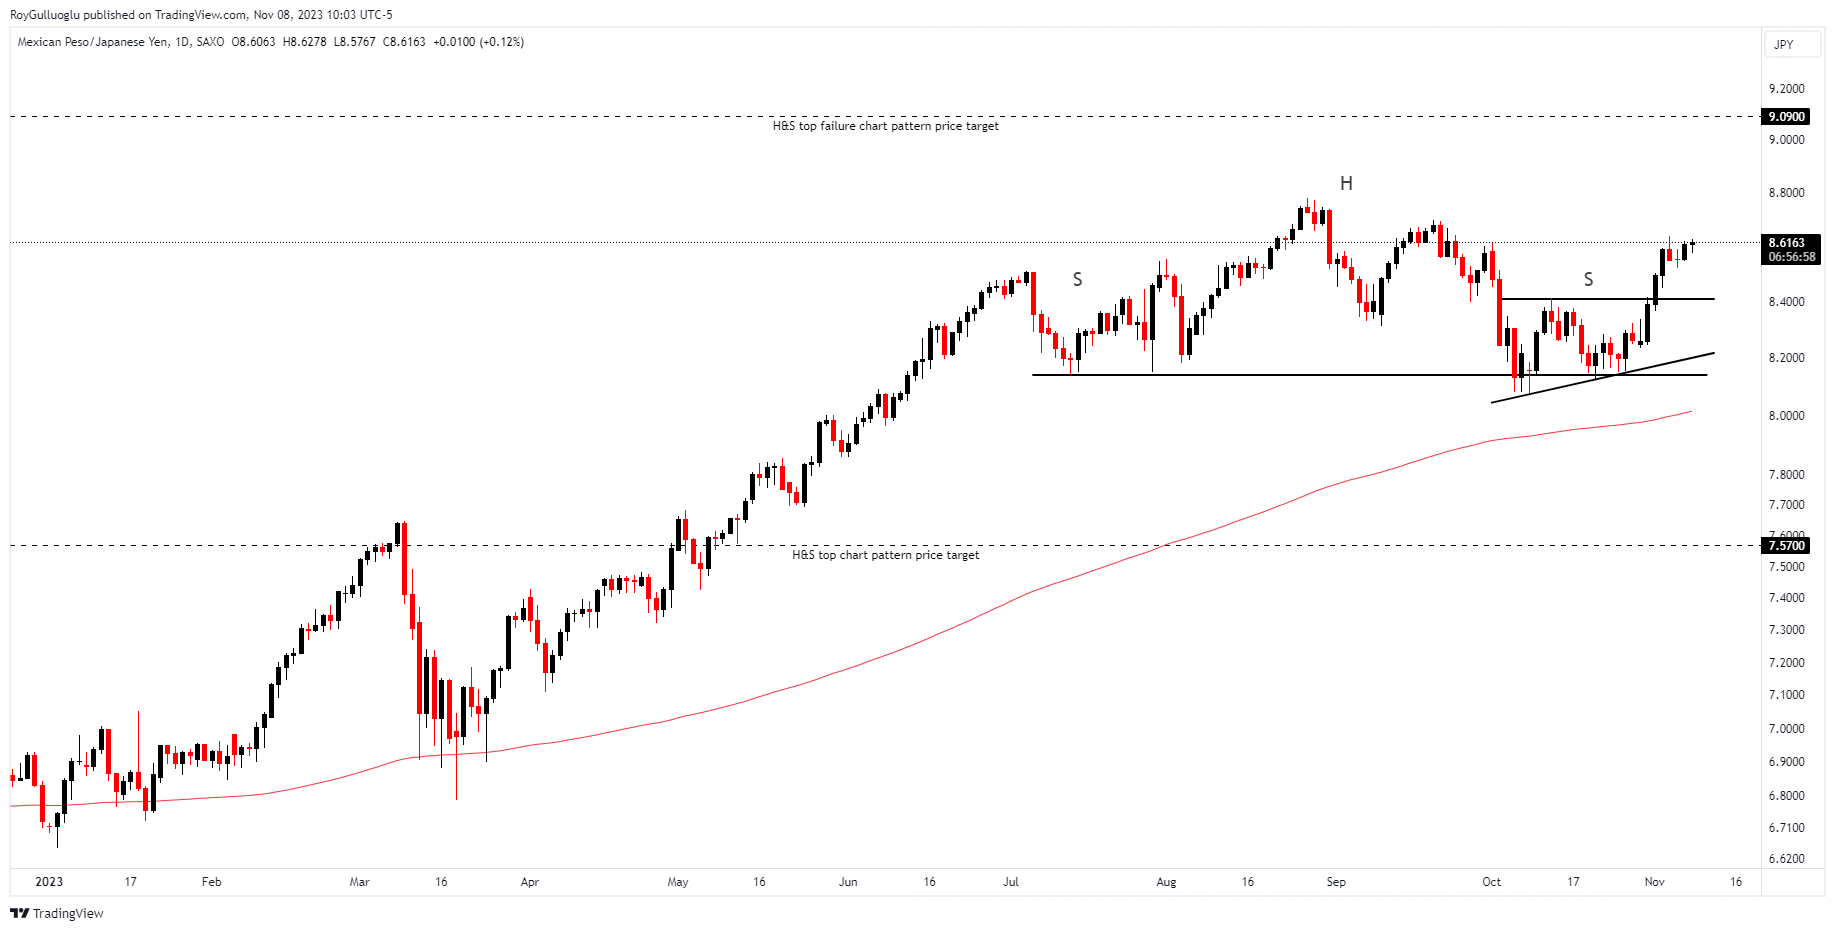
You can click on the MXNJPY ticker above to access the first report explaining the RATIONALE behind the trade idea.
The H&S top failure as a bullish continuation chart pattern is in action.
Within this pattern, the horizontal boundary at 8.4 levels acted as strong support.
A daily close above 8.48 levels validated the breakout from the 3-month-long H&S top chart pattern.
The potential price target, based on this chart pattern, is 9.09 levels.
SOLUSD - Long Idea
You can click on the SOLUSD ticker above to access the first report explaining the RATIONALE behind the trade idea.
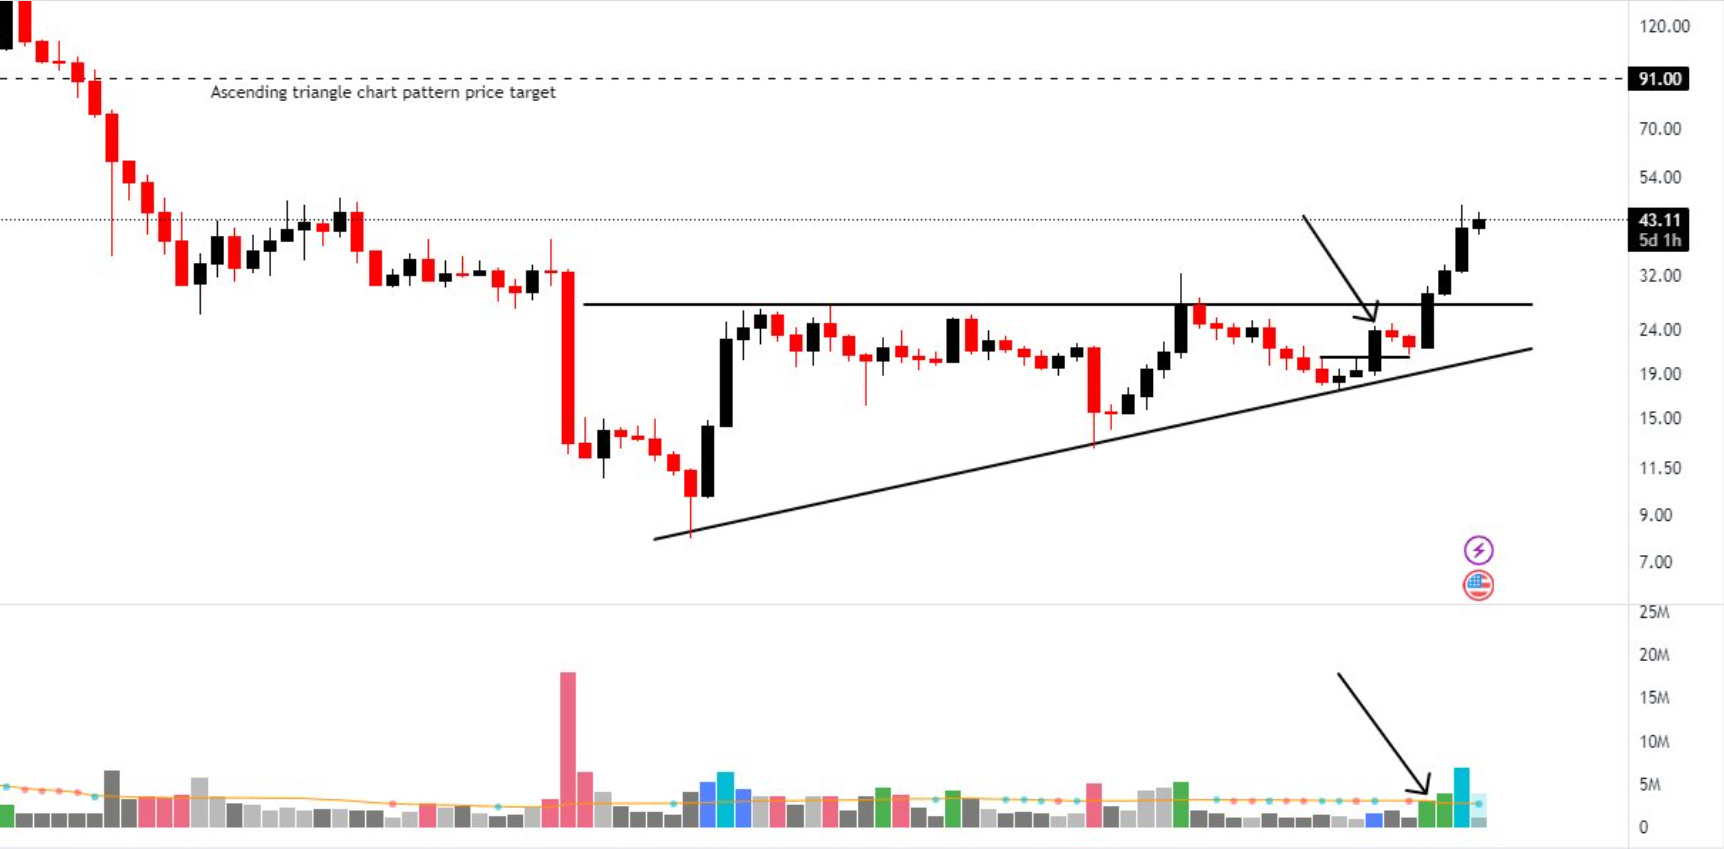
The above weekly graph shows the breakout from the ascending triangle chart pattern formed in SOLUSD. The bar shown with the arrow is the breakout bar that came with high volume after the dried-up volume(dotted part of the line) which accompanies the price decline until then.
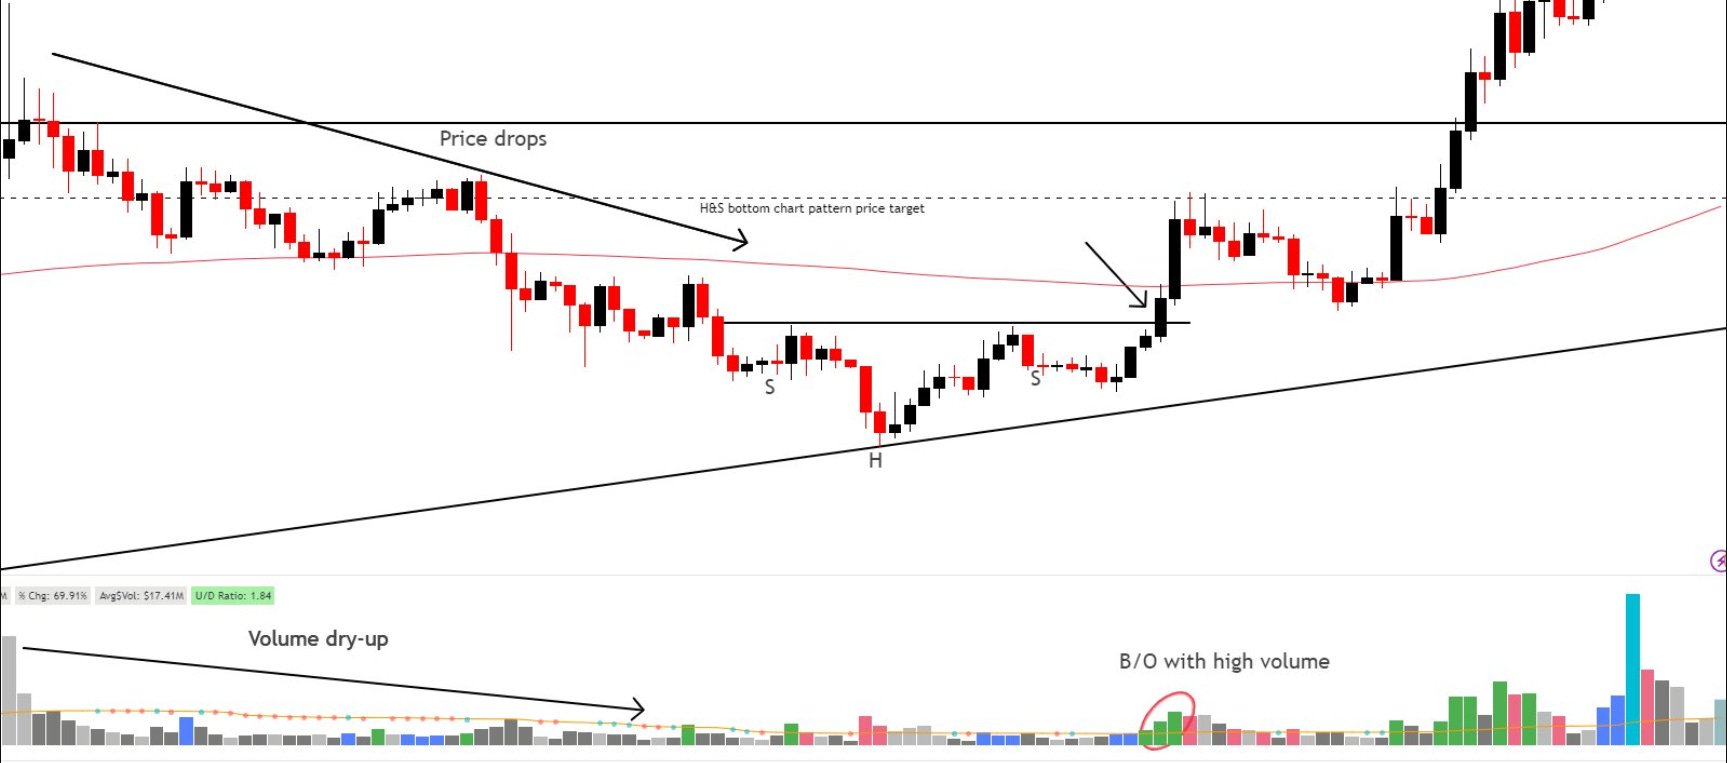
When you switch from weekly to daily(below graph), you can see that it is also a breakout from the H&S bottom chart pattern in the daily graph. So, the shown entry point in the weekly graph also corresponds to a consolidation in the daily graph. A lecture price action!

The ascending triangle as a bullish reversal after a downtrend is still in action.
NQ1! - Short Idea
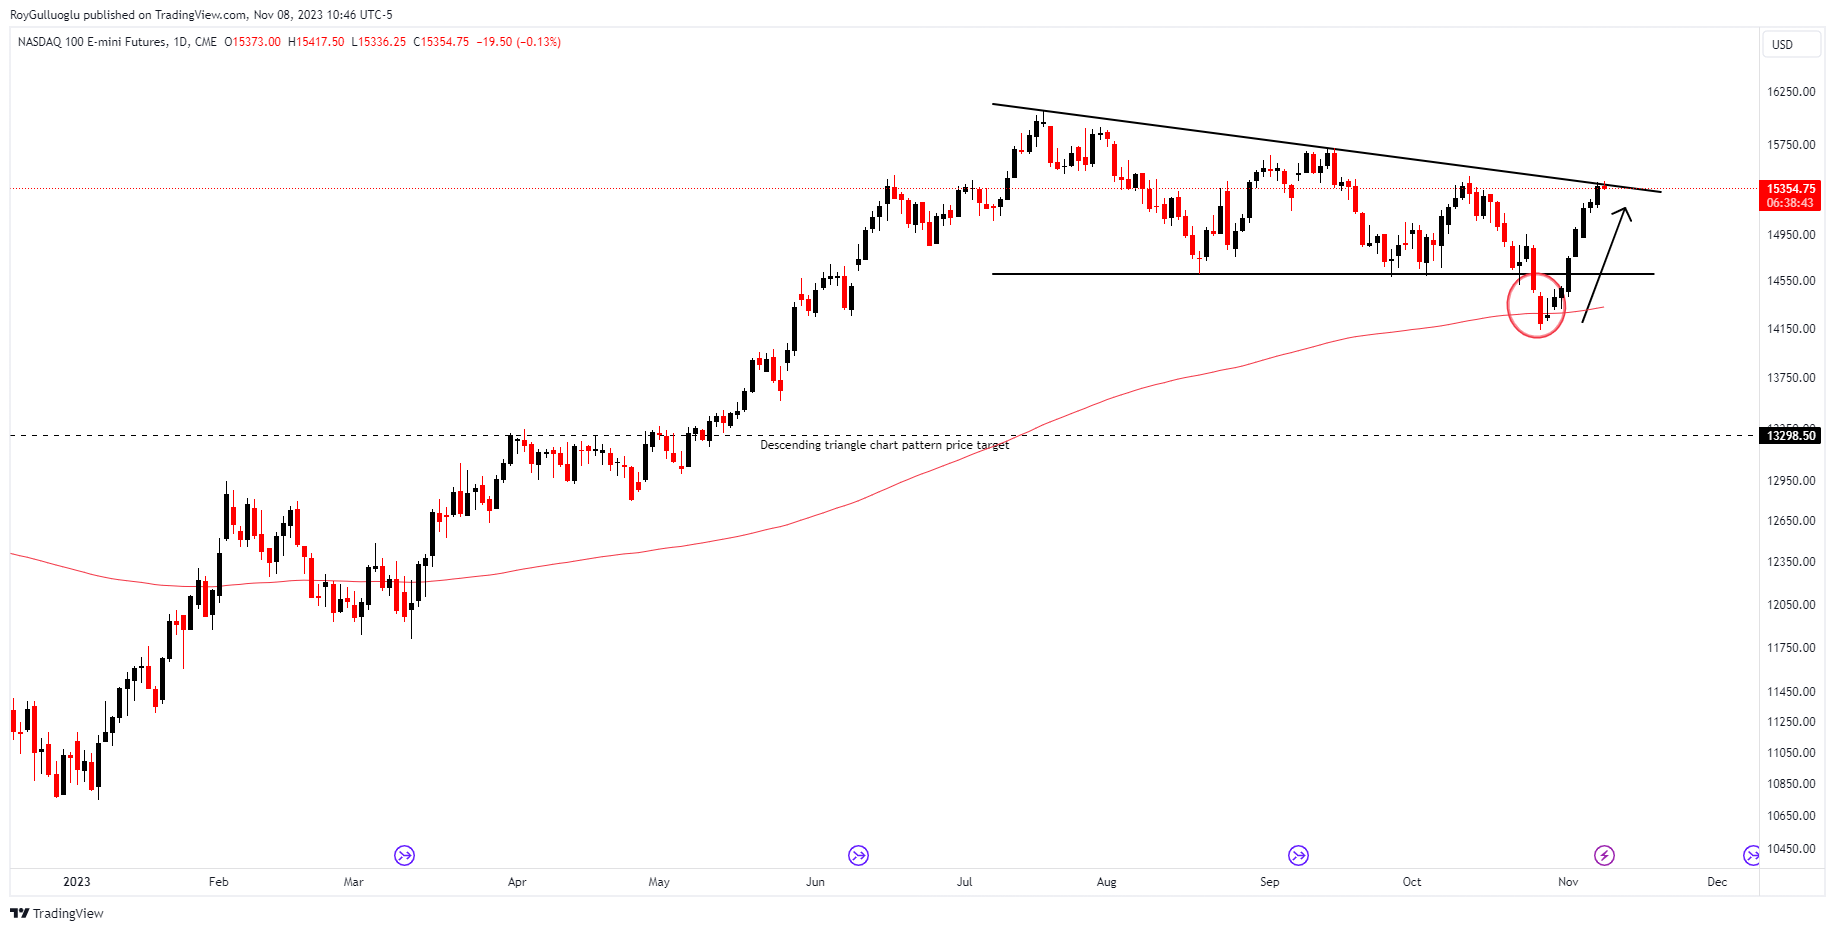
You can click on the NQ1! ticker above to access the first report explaining the RATIONALE behind the trade idea.
The trade idea was given before the breakdown occurred where it is marked with the circle. However, the price failed to trade lower with the FOMC impact and data(PMIs, Non-farm payroll) signaling growth-related concerns. Then, the chart pattern was neglected.
After the FOMC the market seems to be more convinced that there will be no more higher rates but maybe longer.
On one side, there are factors(exposures on personal consumption) that withhold FED from hiking more such as
Resumed student loan payments
Overall burden of high rates(considering the lagged impact) on the economy
On the other side, some factors provide the FED room to hike more such as
Resilient labor market
The strong balance sheet of consumers
As long as we see threatening data on growth(like last week), the market takes it dovish with the expectation that a resilient labor market and a strong balance sheet will be disrupted.
However, before getting caught up in the FOMO, we should be monitoring the following risks:
Potential government shutdown
Potential illiquidity in treasuries in Q4-remember the lack of demand at the long end of the curve which drove the market lower.
Geopolitical events
Energy prices
BoJ’s stronger policy shift
XRPUSDT - Long Idea
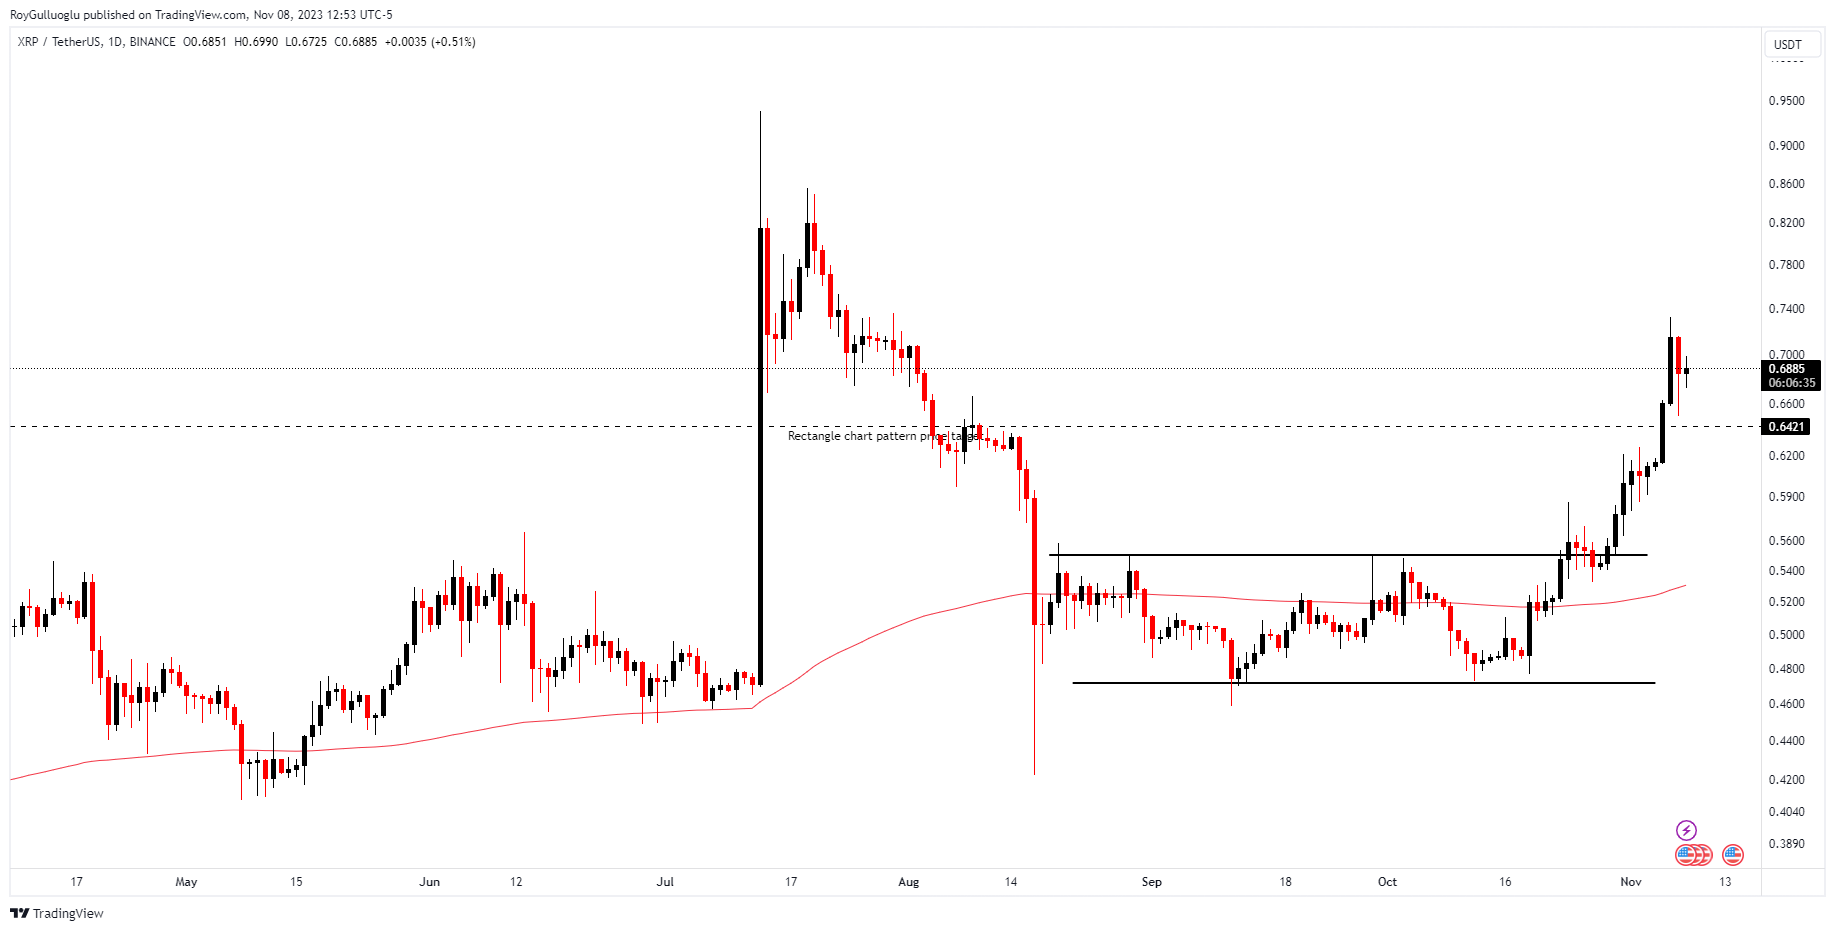
You can click the XRPUSDT ticker above to access the first report explaining the RATIONALE behind the trade idea.
The rectangle chart pattern price target is reached.
EGLDUSD - Long Idea
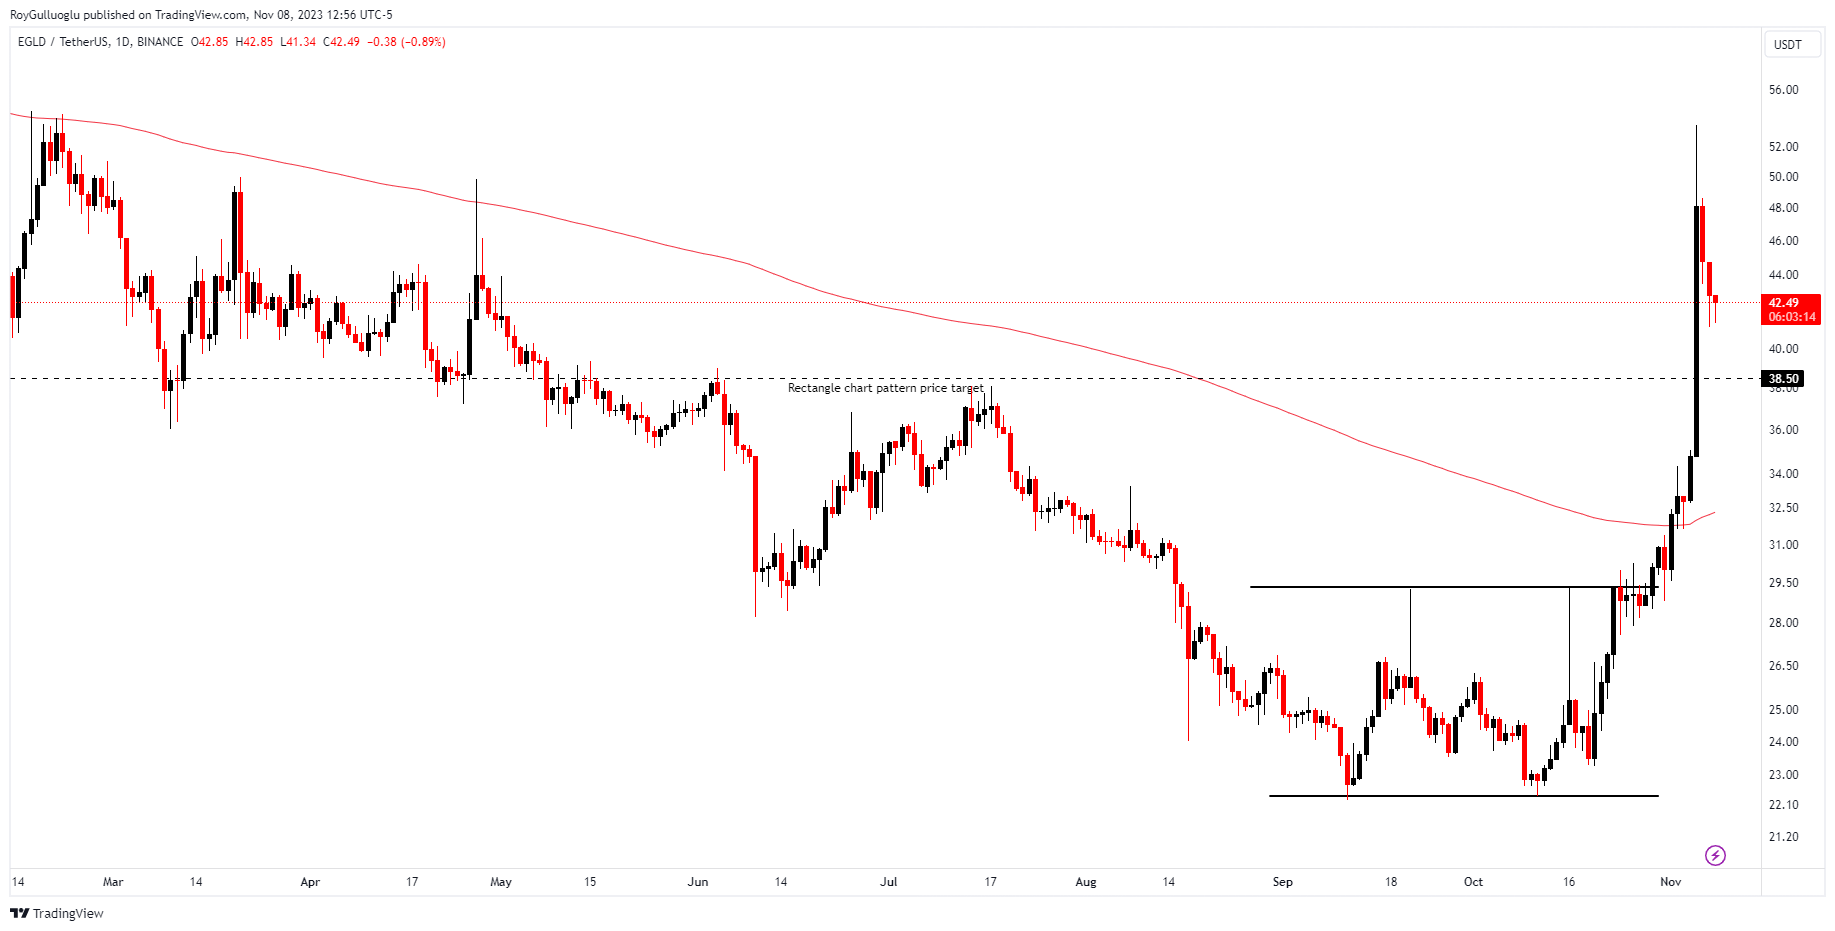
You can click the EGLDUSD ticker above to access the first report explaining the RATIONALE behind the trade idea.
The rectangle chart pattern price target is reached.
LINKUSD - Long Idea
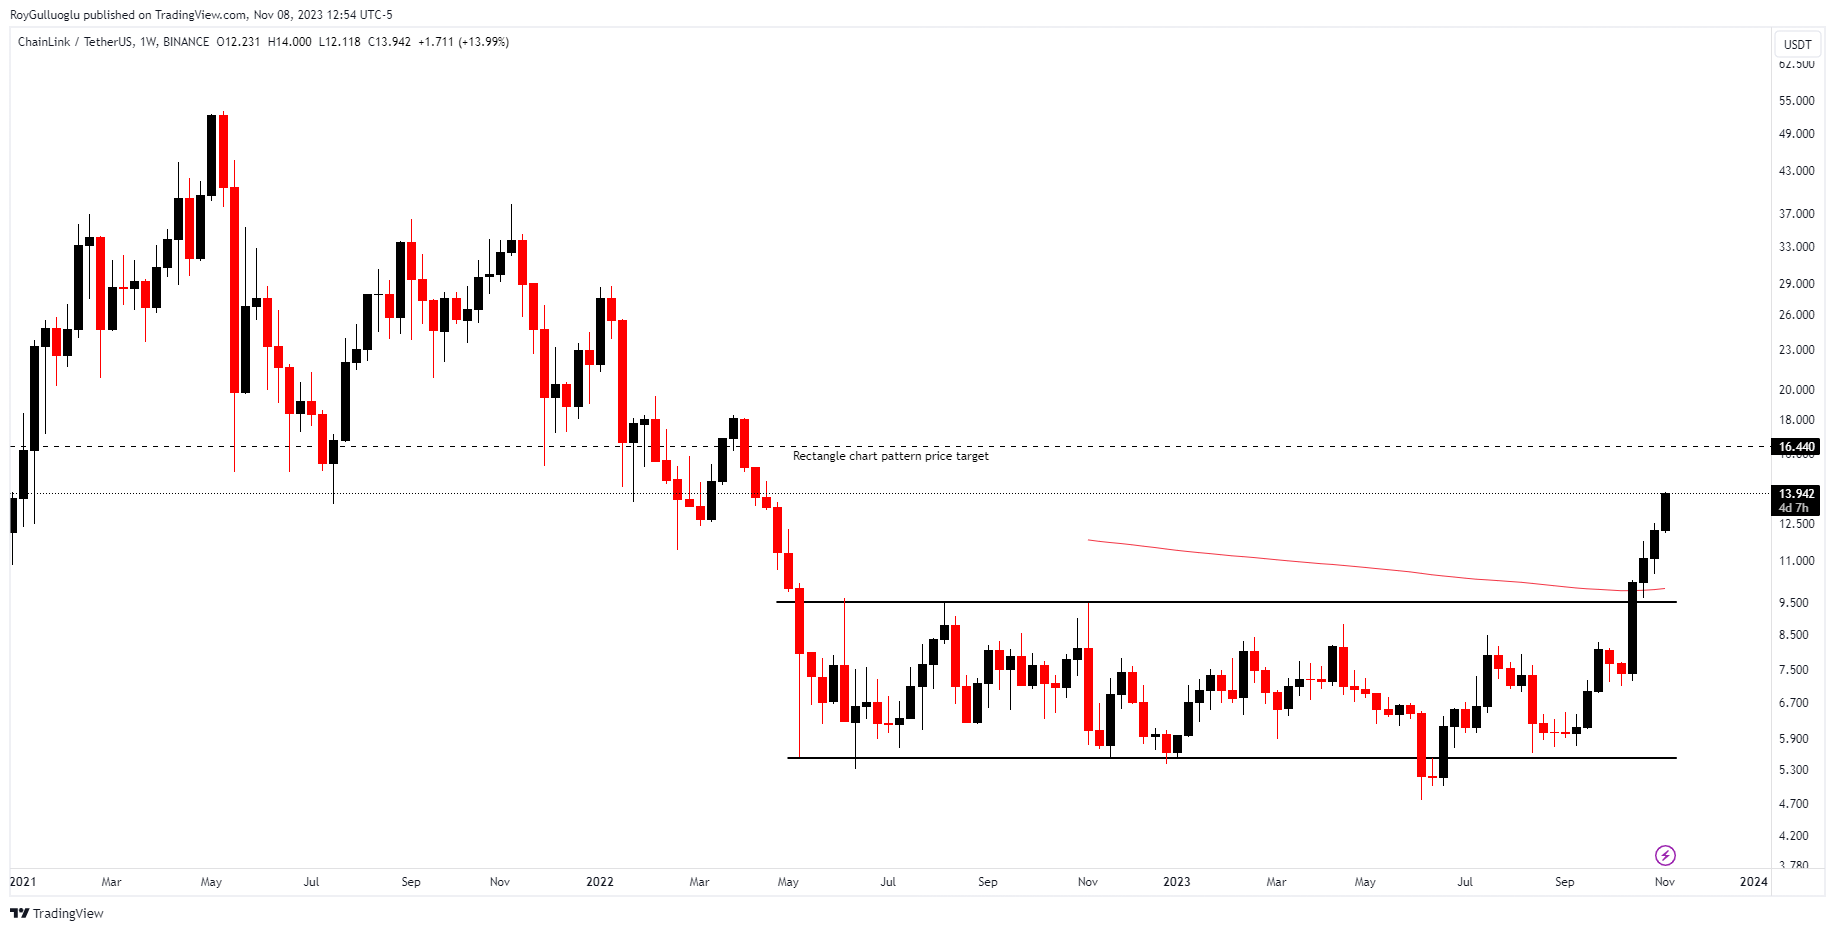
You can click the LINKUSD ticker above to access the first report explaining the RATIONALE behind the trade idea.
BANDUSD - Long Idea
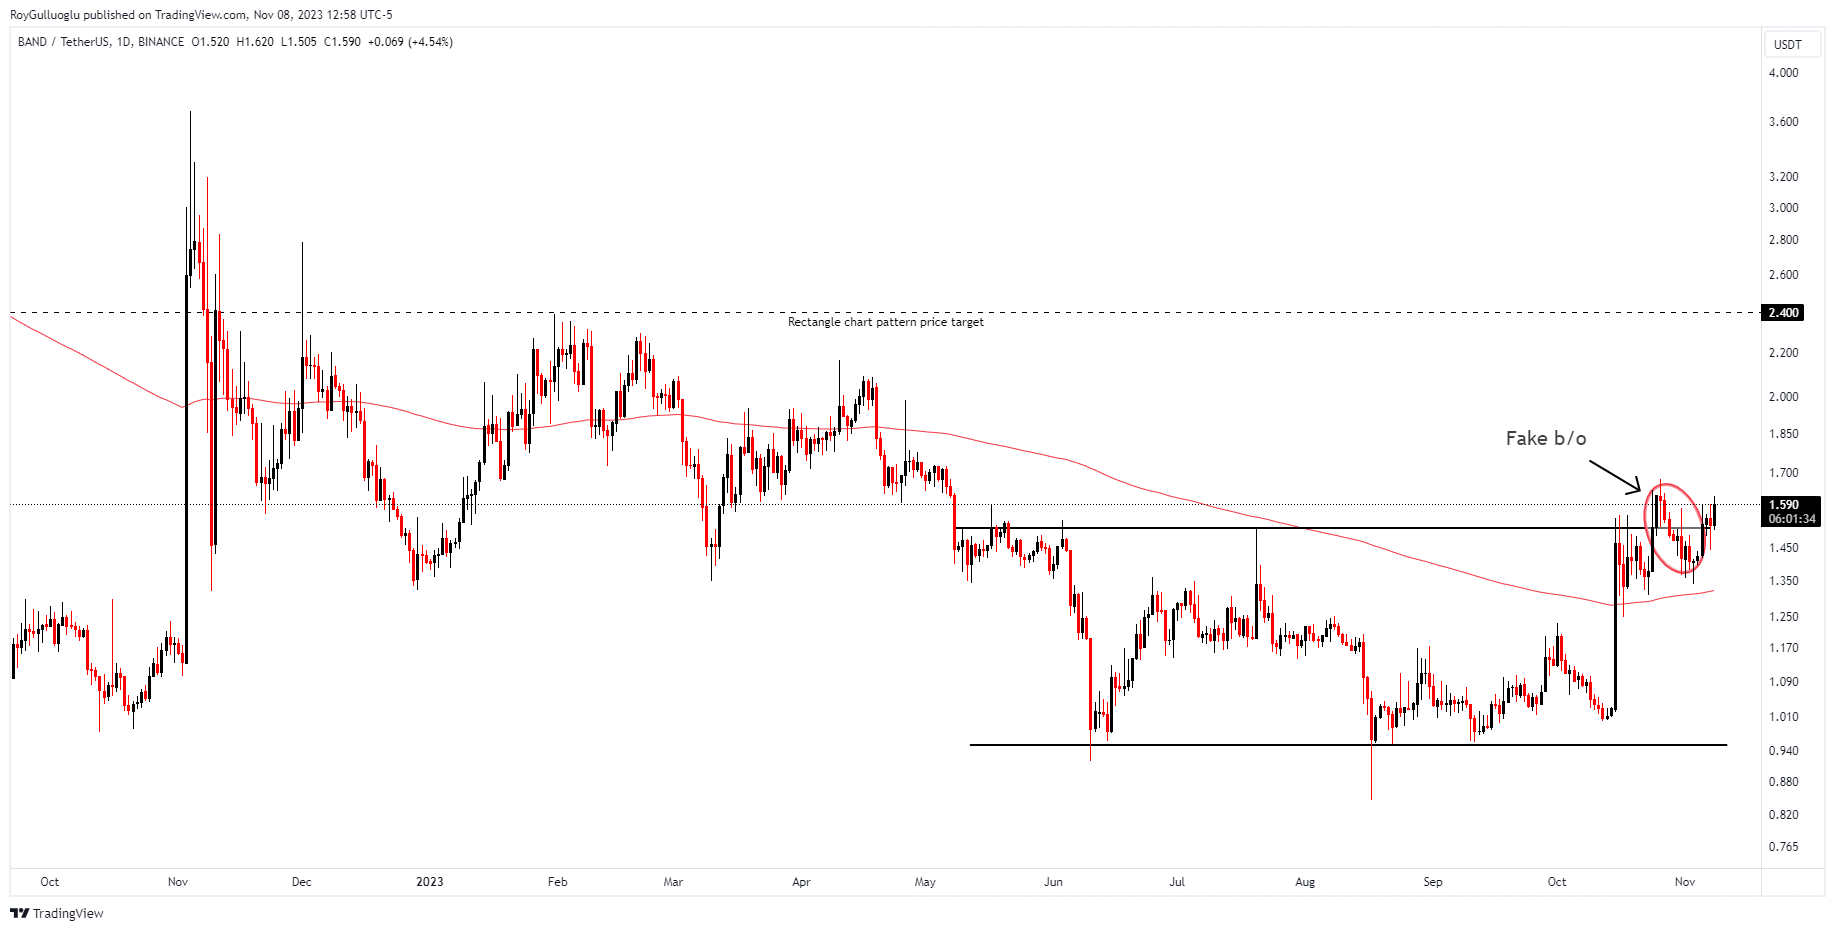
You can click the BANDUSD ticker above to access the first report explaining the RATIONALE behind the trade idea.
ATOMUSD - Long Idea
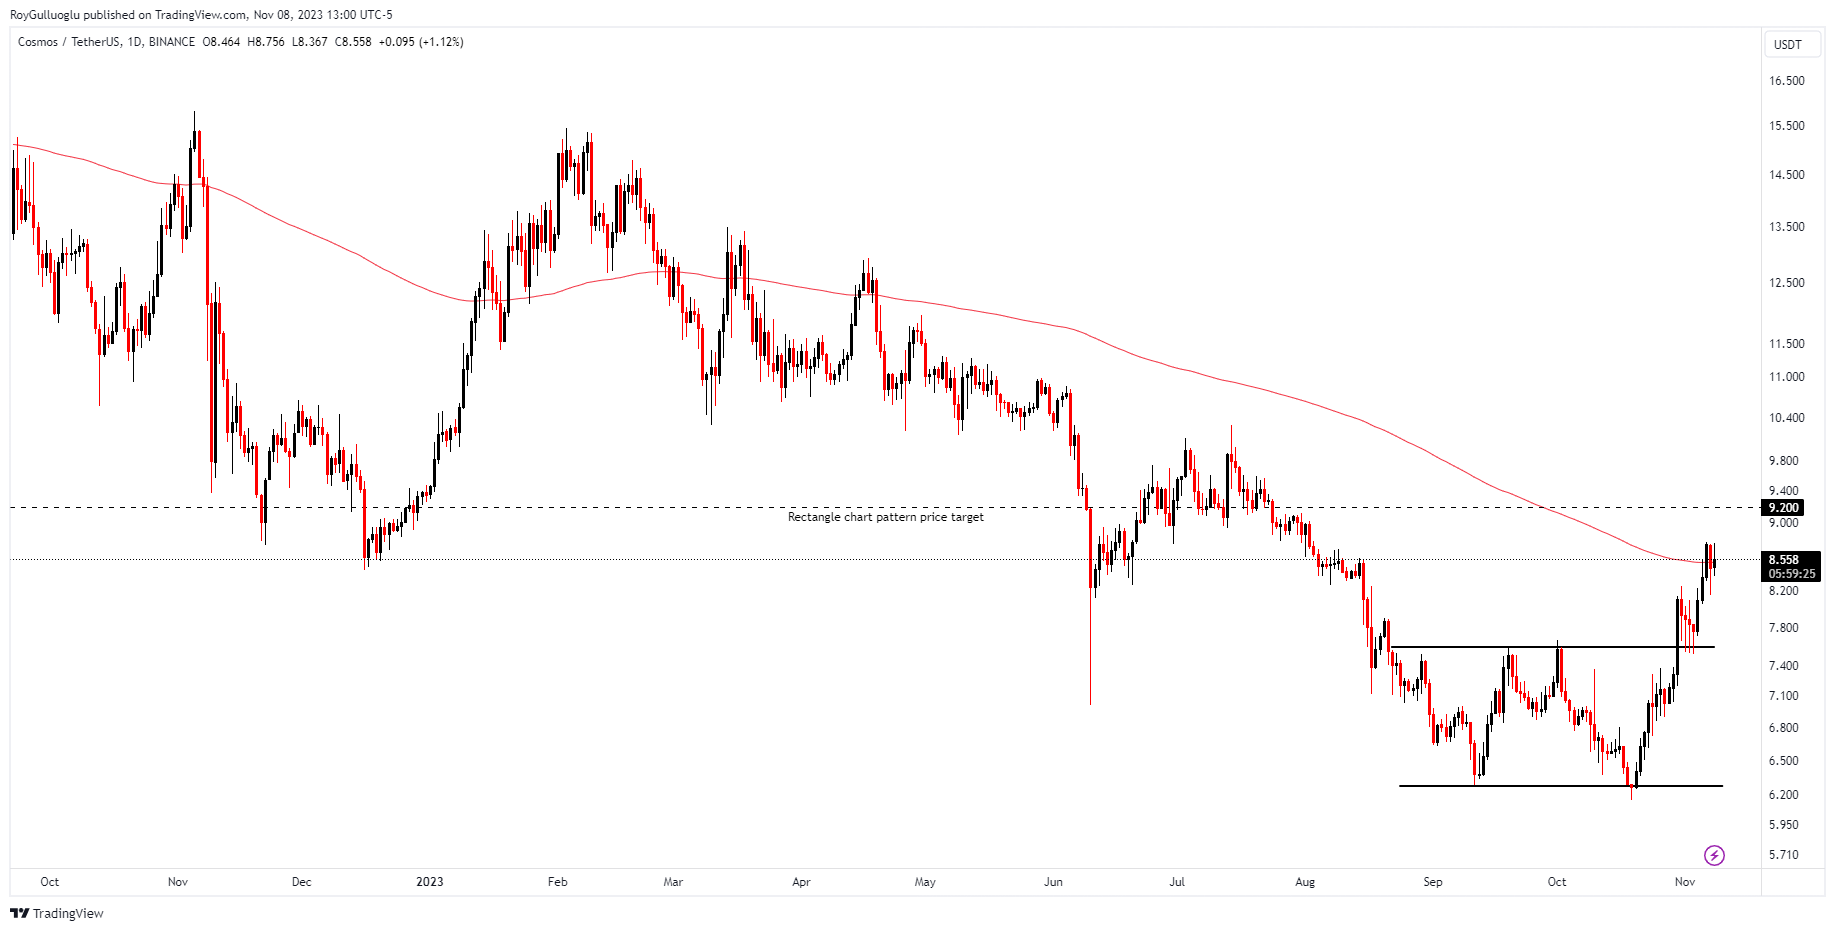
You can click the ATOMUSD ticker above to access the first report explaining the RATIONALE behind the trade idea.