

New setups
EURAUD - Short Idea

The above daily chart formed an approximately 2.5-month-long descending triangle chart pattern as a bearish reversal after an uptrend.
Within this pattern, the horizontal boundary at 1.632 levels acts as a support.
A daily close below 1.6157(%1 lower than the support) levels would validate the breakout from the 2.5-month-long descending triangle chart pattern.
Based on this chart pattern, the potential price target is 1.56 levels.
Downside potential may be anticipated for the EUR, particularly in currency pairs like EURAUD and EURNZD.
The hawkish(RBA held the rates steady on Monday) monetary policy positions in these currency crosses, along with the evolving dovish sentiment in ECB rate cut pricing(70% probability of Q1 rate cut), signal the potential for further declines.
A risk to consider in this trade idea is the potential exposure of China to the AUD. The HANG SENG index futures could be monitored to evaluate that risk.
SANDUSDT - Long Idea

The above daily chart formed an approximately 6-month-long H&S bottom chart pattern as a bullish reversal after a downtrend.
The horizontal boundary at 0.47 levels acts as a resistance within this pattern.
A daily close above 0.484 levels would validate the breakout from the 6-month-long H&S bottom chart pattern.
Based on this chart pattern, the potential price target is 0.775 levels.
ATOMUSDT - Long Idea

The above daily chart formed an approximately 6-month-long H&S bottom chart pattern as a bullish reversal after a downtrend.
Within this pattern, the horizontal boundary at 10 levels acts as a resistance.
A daily close above 10.3 levels would validate the breakout from the 6-month-long H&S bottom chart pattern.
Based on this chart pattern, the potential price target is 15.7 levels.
CHZUSDT - Long Idea

The above daily chart formed an approximately 6-month-long H&S bottom chart pattern as a bullish reversal after a downtrend.
The horizontal boundary at 0.085 levels acts as a resistance within this pattern.
A daily close above 0.08755 levels would validate the breakout from the 6-month-long H&S bottom chart pattern.
Based on this chart pattern, the potential price target is 0.134 levels.
KDAUSDT - Long Idea
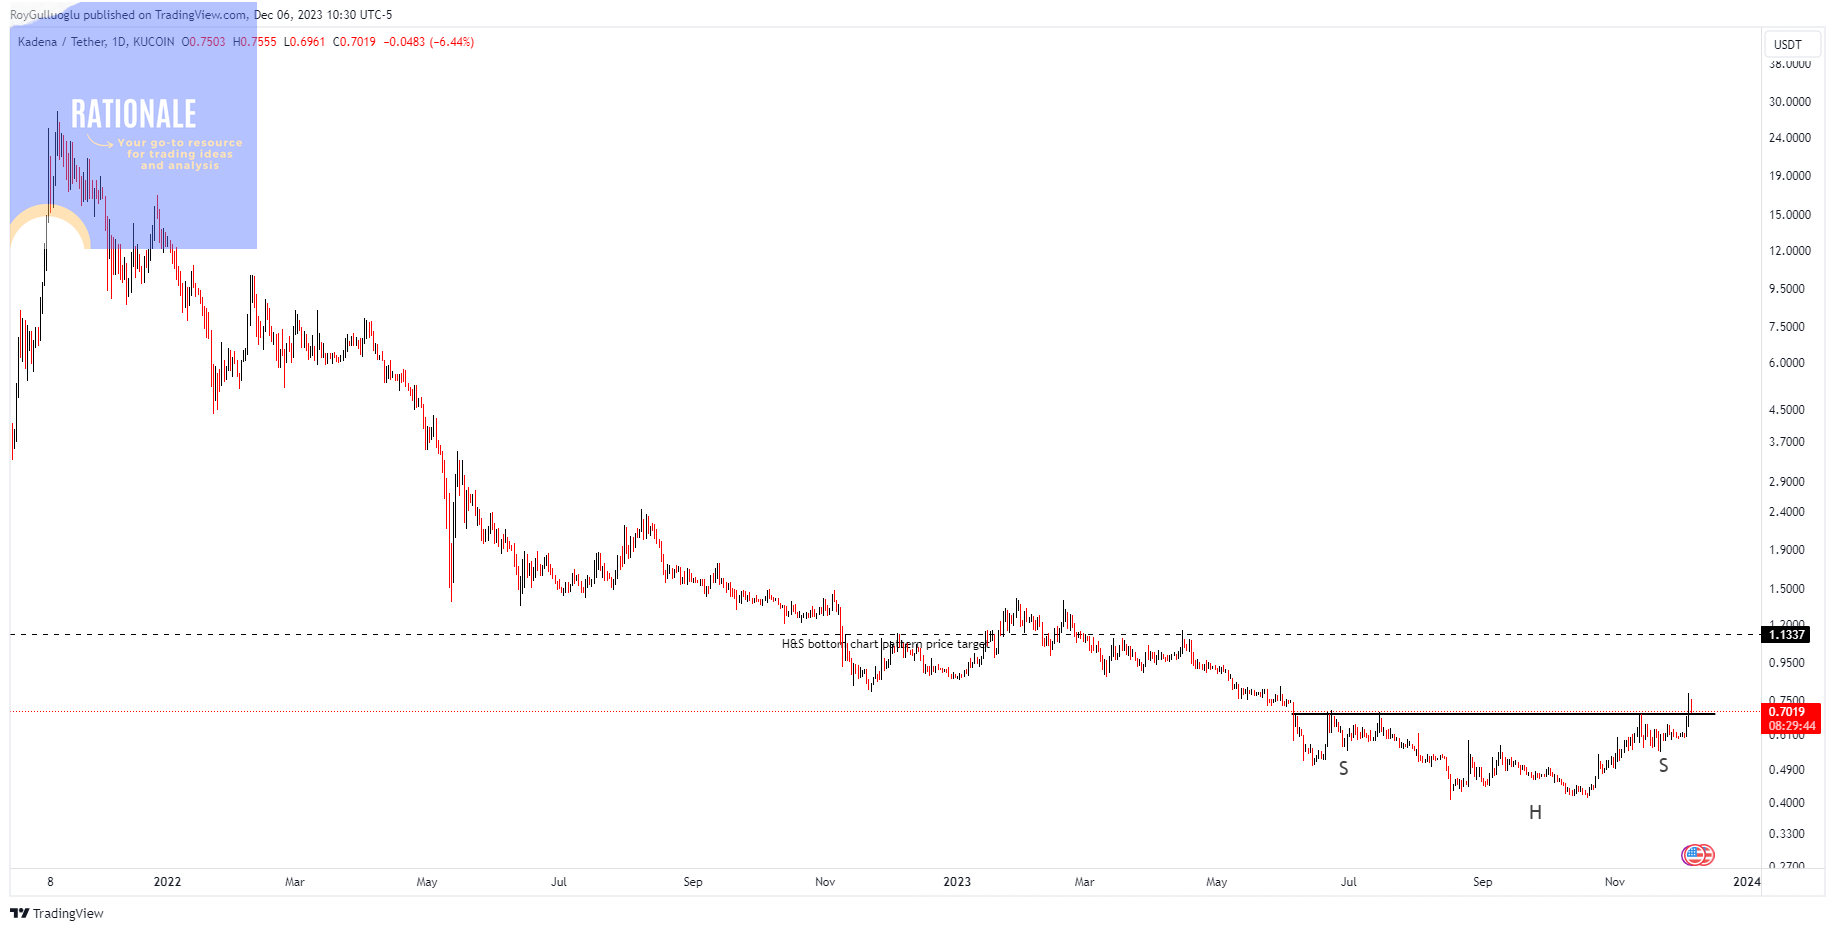
The above daily chart formed an approximately 6-month-long H&S bottom chart pattern as a bullish reversal after a downtrend.
The horizontal boundary at 0.69 levels acted as a resistance within this pattern.
A daily close above 0.71 levels validated the breakout from the 6-month-long H&S bottom chart pattern and now pulling back to the resistance level.
Based on this chart pattern, the potential price target is 1.133 levels.
Follow-ups
BTCUSDT - Long Idea

You can click the BTCUSDT ticker above to access the first report explaining the RATIONALE behind the trade idea.
Chart pattern price target is reached.
DENTUSDT - Long Idea

You can click the DENTUSDT ticker above to access the first report explaining the RATIONALE behind the trade idea.
XW1!(Wheat Futures)-Long Idea

You can click the XW1! ticker above to access the first report explaining the RATIONALE behind the trade idea.
KC1! - Long Idea

You can click the KC1! ticker above to access the first report explaining the RATIONALE behind the trade idea.