

New setups
MXNJPY-Long/Short Idea
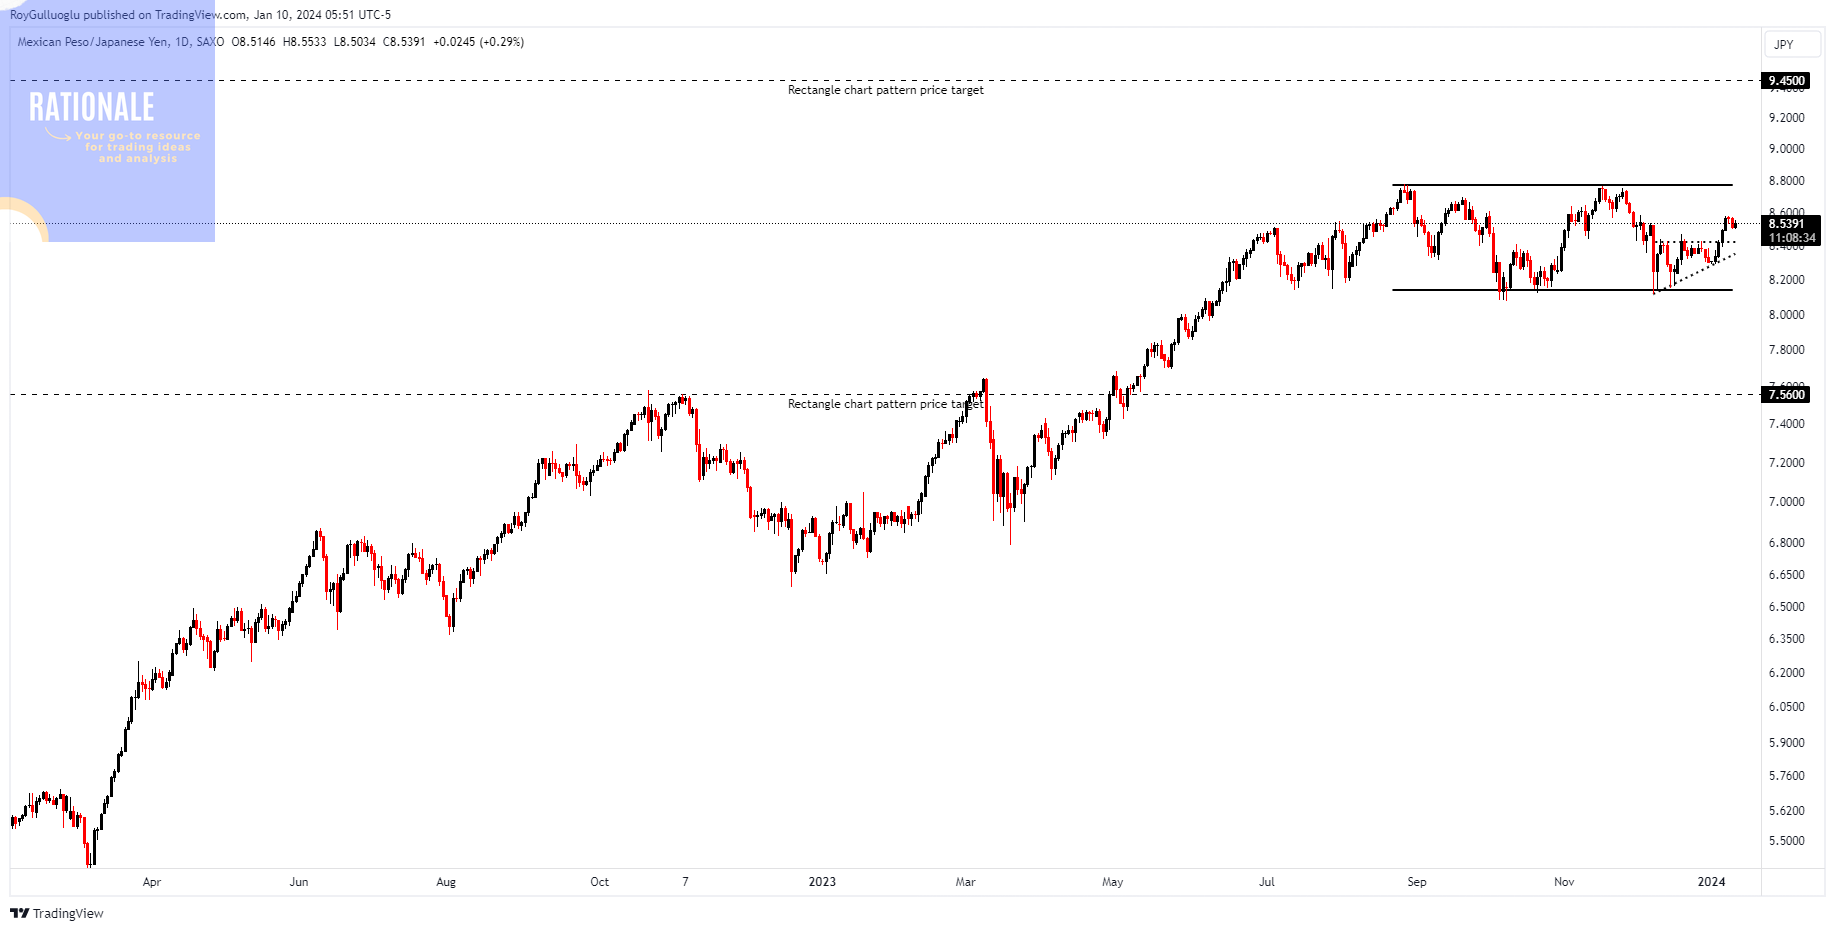
The above daily chart formed an approximately 3-month-long rectangle chart pattern.
Within this pattern, the horizontal boundary at 8.14 levels acts as strong support and 8.77 acts as resistance.
A daily close below 8.06 levels would validate the breakdown from the 3-month-long rectangle chart pattern.
A daily close above 8.86 levels would validate the breakdown from the 3-month-long rectangle chart pattern.
The potential price target, based on the bearish scenario, is 7.56 levels, and 9.45 levels based on the bullish scenario.
What could be the drivers of a bullish scenario?
The Mexican peso currently offers a 6.95% real rate based on the overnight rate of 10.5% with the given 4.3% CPI YOY.
Considering the -3.4% percent real rate offered by the Japanese Yen, MXN is favorable over JPY.
The general transition of global central banks from tight monetary policies to expansionary policies would be crucial in this trade as well.
As long as the global central banks stay at high levels of rates, the overnight rate offered by the Bank of Mexico would not decline especially considering the last higher reading of the CPI YoY. The “emerging economy” characteristics of Mexico would also support this idea.
What could be the drivers of a bearish scenario?
A potential hawkish policy shift from the Bank of Japan. It is important to monitor Japan's service inflation closely, as the current levels of service inflation and wage growth in the country do not warrant a shift towards a more hawkish stance by the BoJ at this point.
Should the winds of a loose economic policy begin to blow earlier than anticipated, the Bank of Mexico may respond swiftly, given that they currently provide the highest real interest rate by a significant margin. They have relatively ample room for easing measures.
ETFMG Alternative Harvest ETF-(MJ/ARCA)-Long Idea
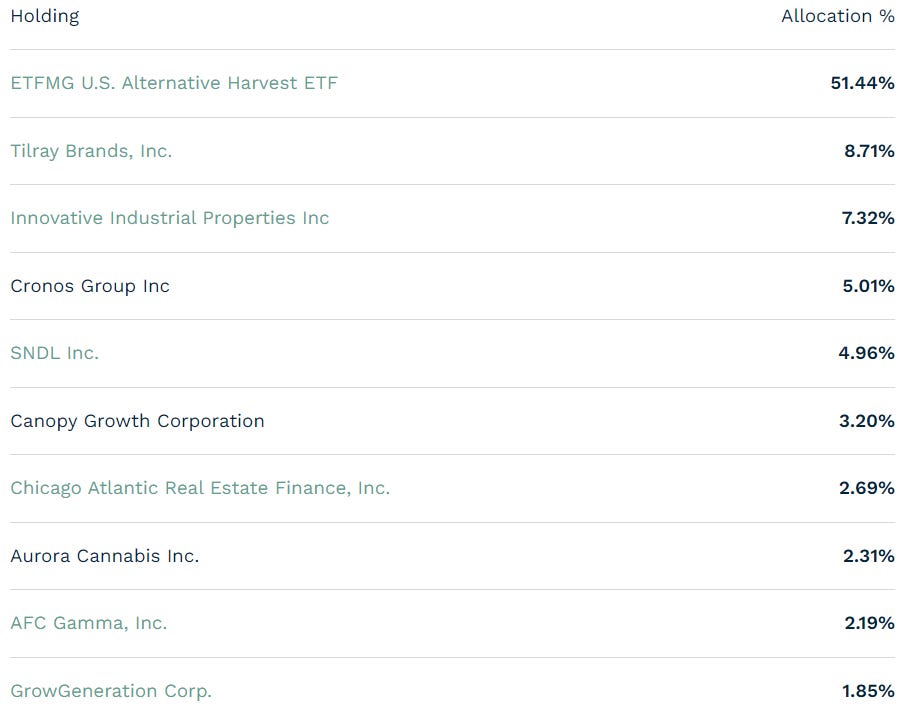
MJ is the first cannabis-focused ETF to trade in the US. The fund tracks an index of stocks across the globe that are engaged in the legal cultivation, production, marketing, or distribution of cannabis products for either medical or nonmedical purposes. The index identifies companies that legally derive more than half their revenue from cannabis-related activities.
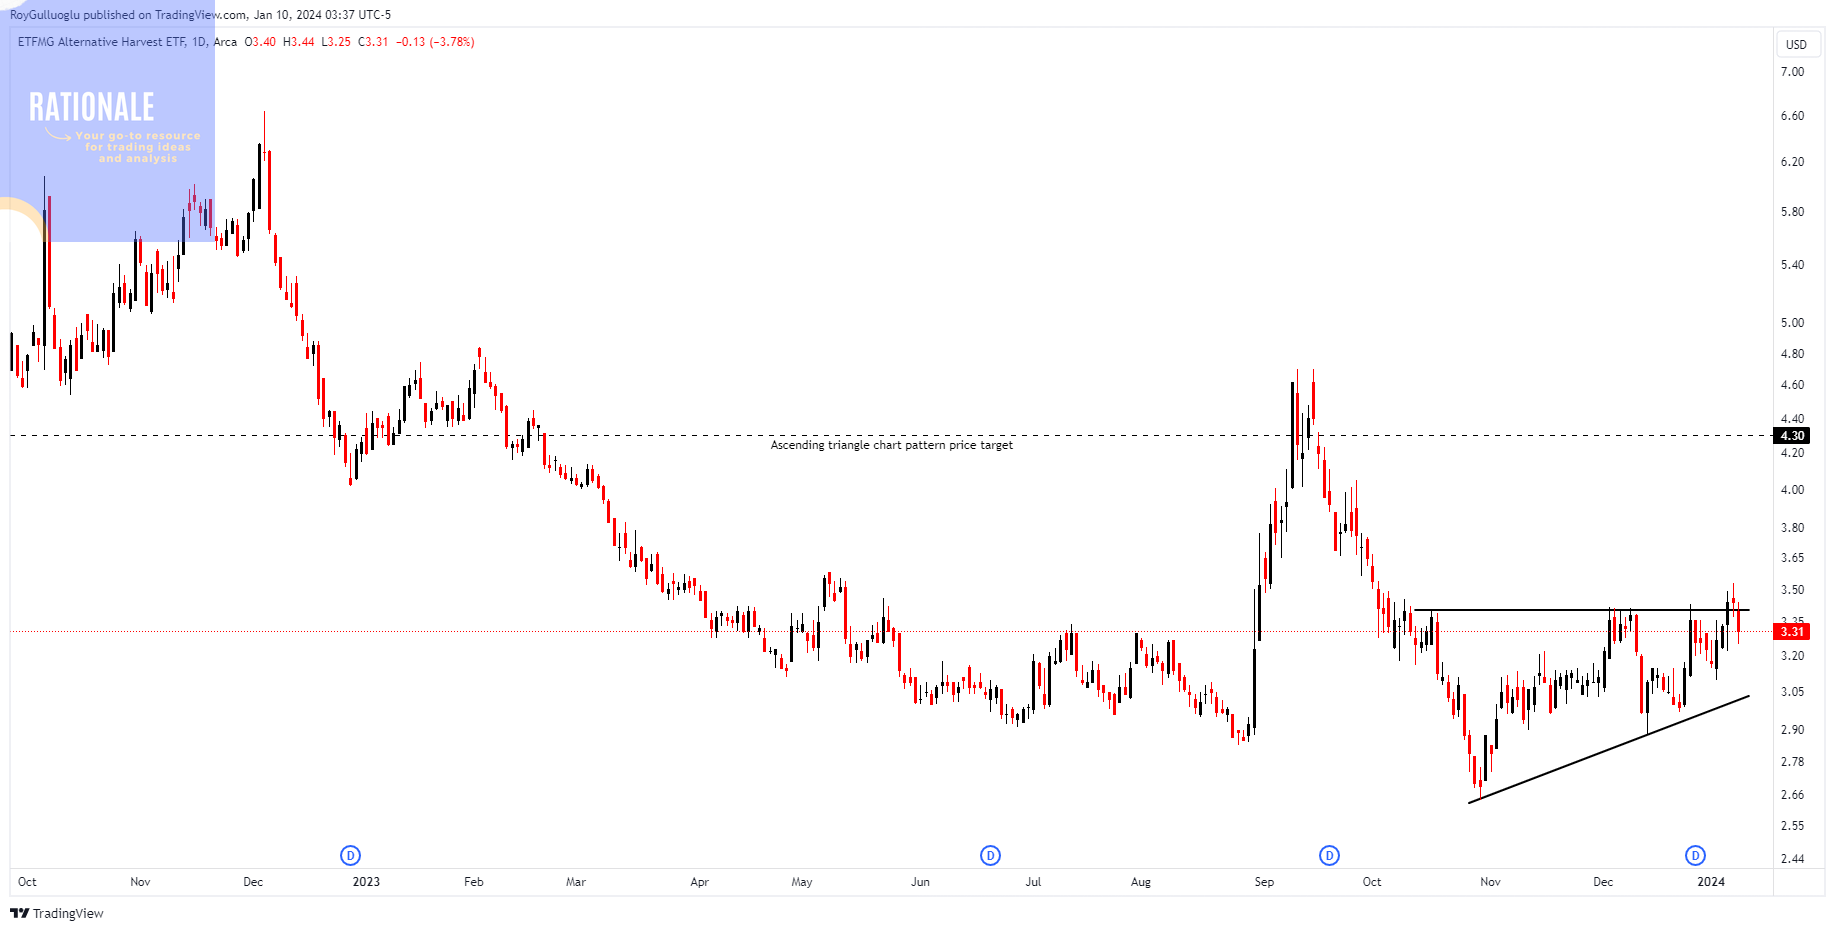
The above daily chart formed an approximately 2-month-long ascending triangle chart pattern as a bullish reversal after a downtrend.
Within this pattern, the horizontal boundary at 3.4 levels acts as a resistance.
A daily close above 3.5 levels would validate the breakout from the 2-month-long ascending triangle chart pattern.
Based on this chart pattern, the potential price target is 4.3 levels.
Top 10 holdings
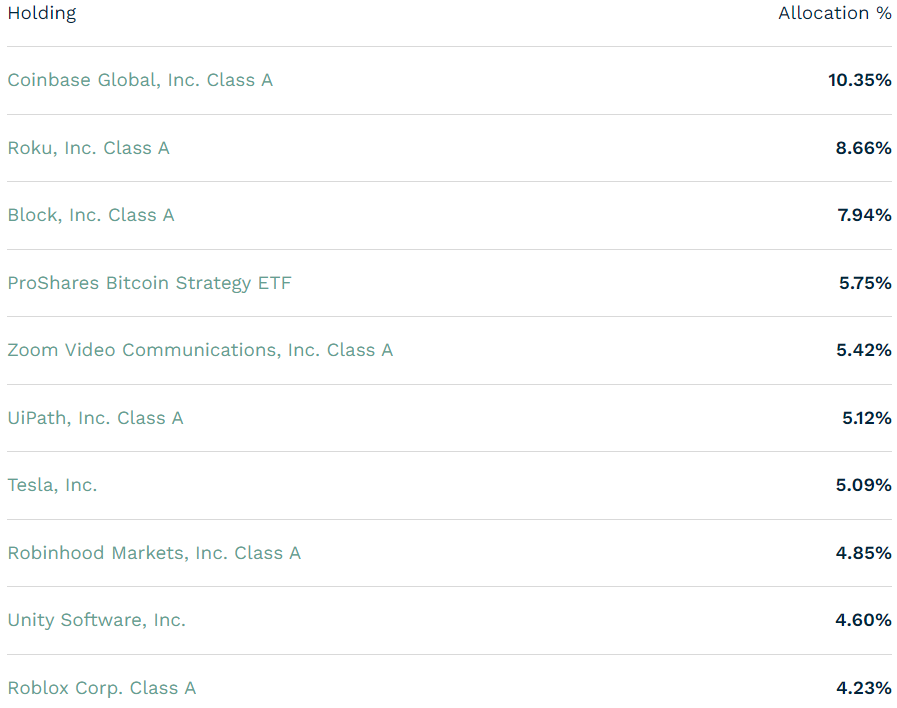
ARK Next generation Internet ETF-(ARKW/ARCA)-Long Idea
ARKW fund's managers are charged with the responsibility of pinpointing companies they believe represent the next wave of Internet evolution. In general, the managers of ARKW seem to concentrate on prominent trends like the Internet of Things, cloud computing, digital currencies, and wearable technology.
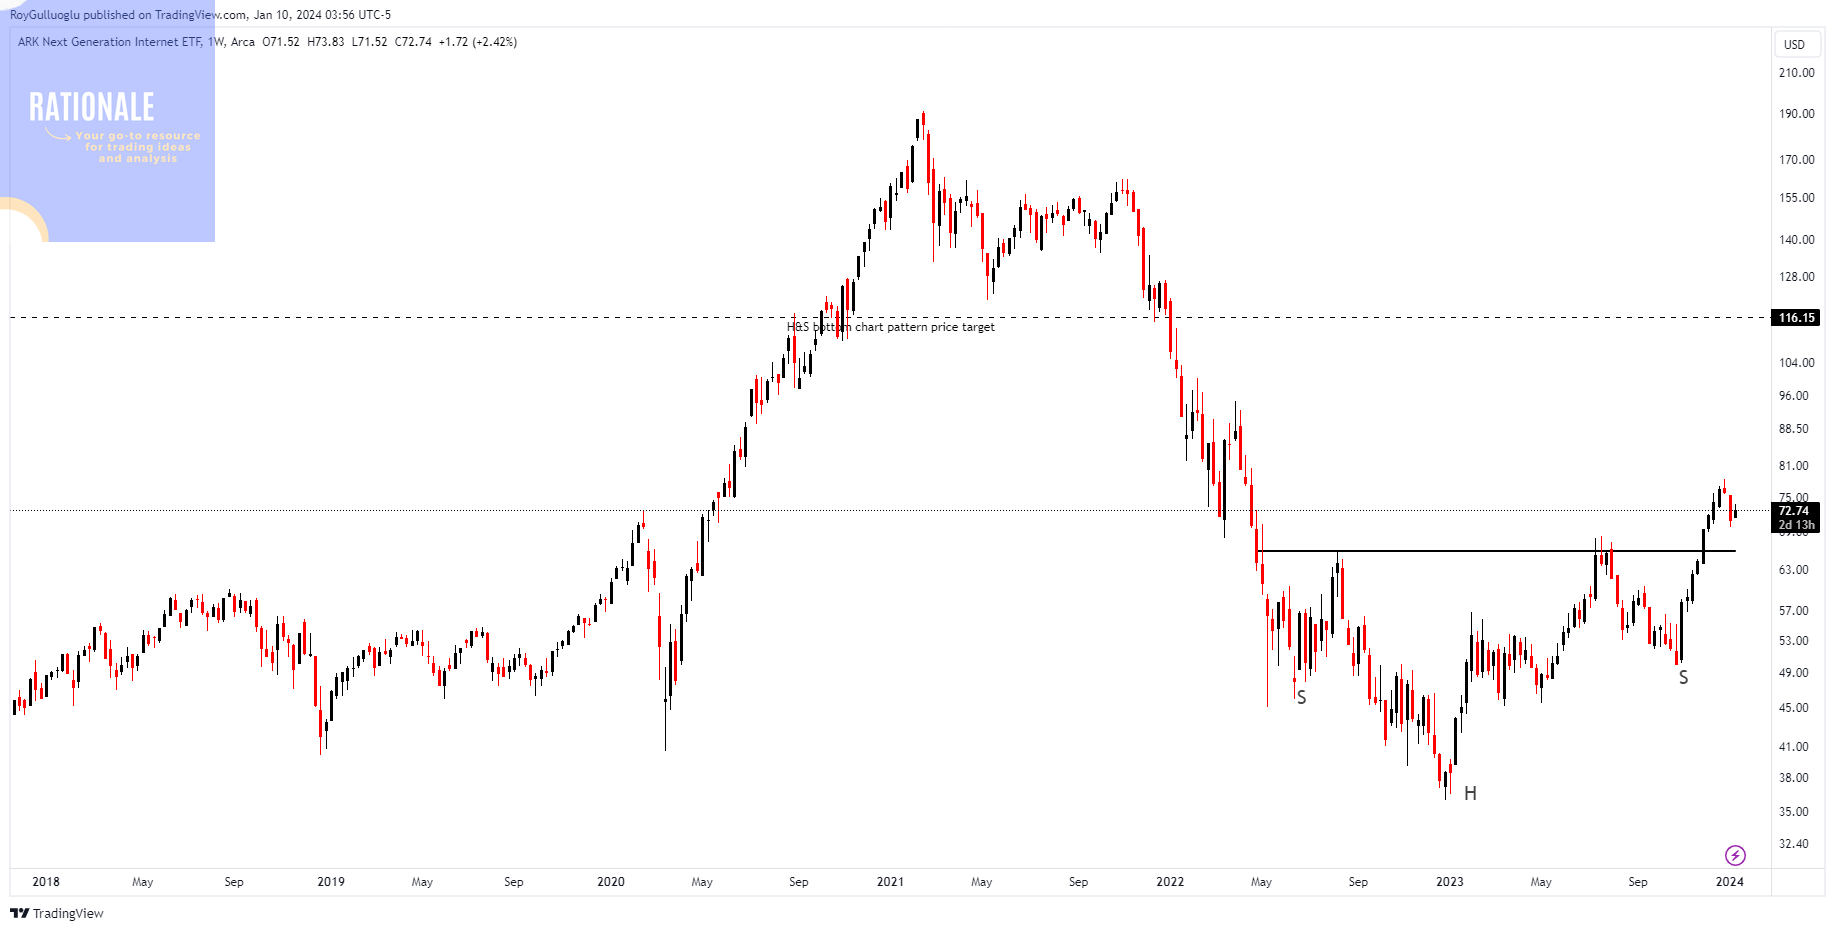
The above weekly chart formed an approximately 21-month-long H&S bottom chart pattern as a bullish reversal after a downtrend.
Within this pattern, the horizontal boundary at 65.76 levels acted as a resistance.
A daily close above 67.73 levels validated the breakout from the 21-month-long H&S bottom chart pattern. The price has broken out of the chart pattern and pulled back.
Based on this chart pattern, the potential price target is 116.15 levels.
Top 10 holdings
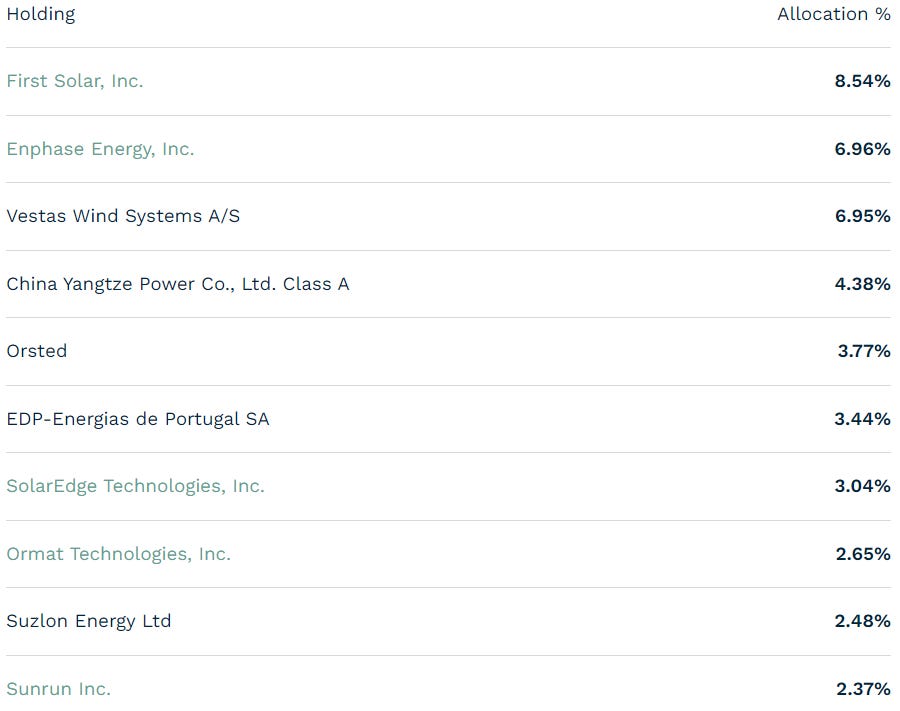
iShares Global Clean Energy ETF-(ICLN/NASDAQ)-Long Idea
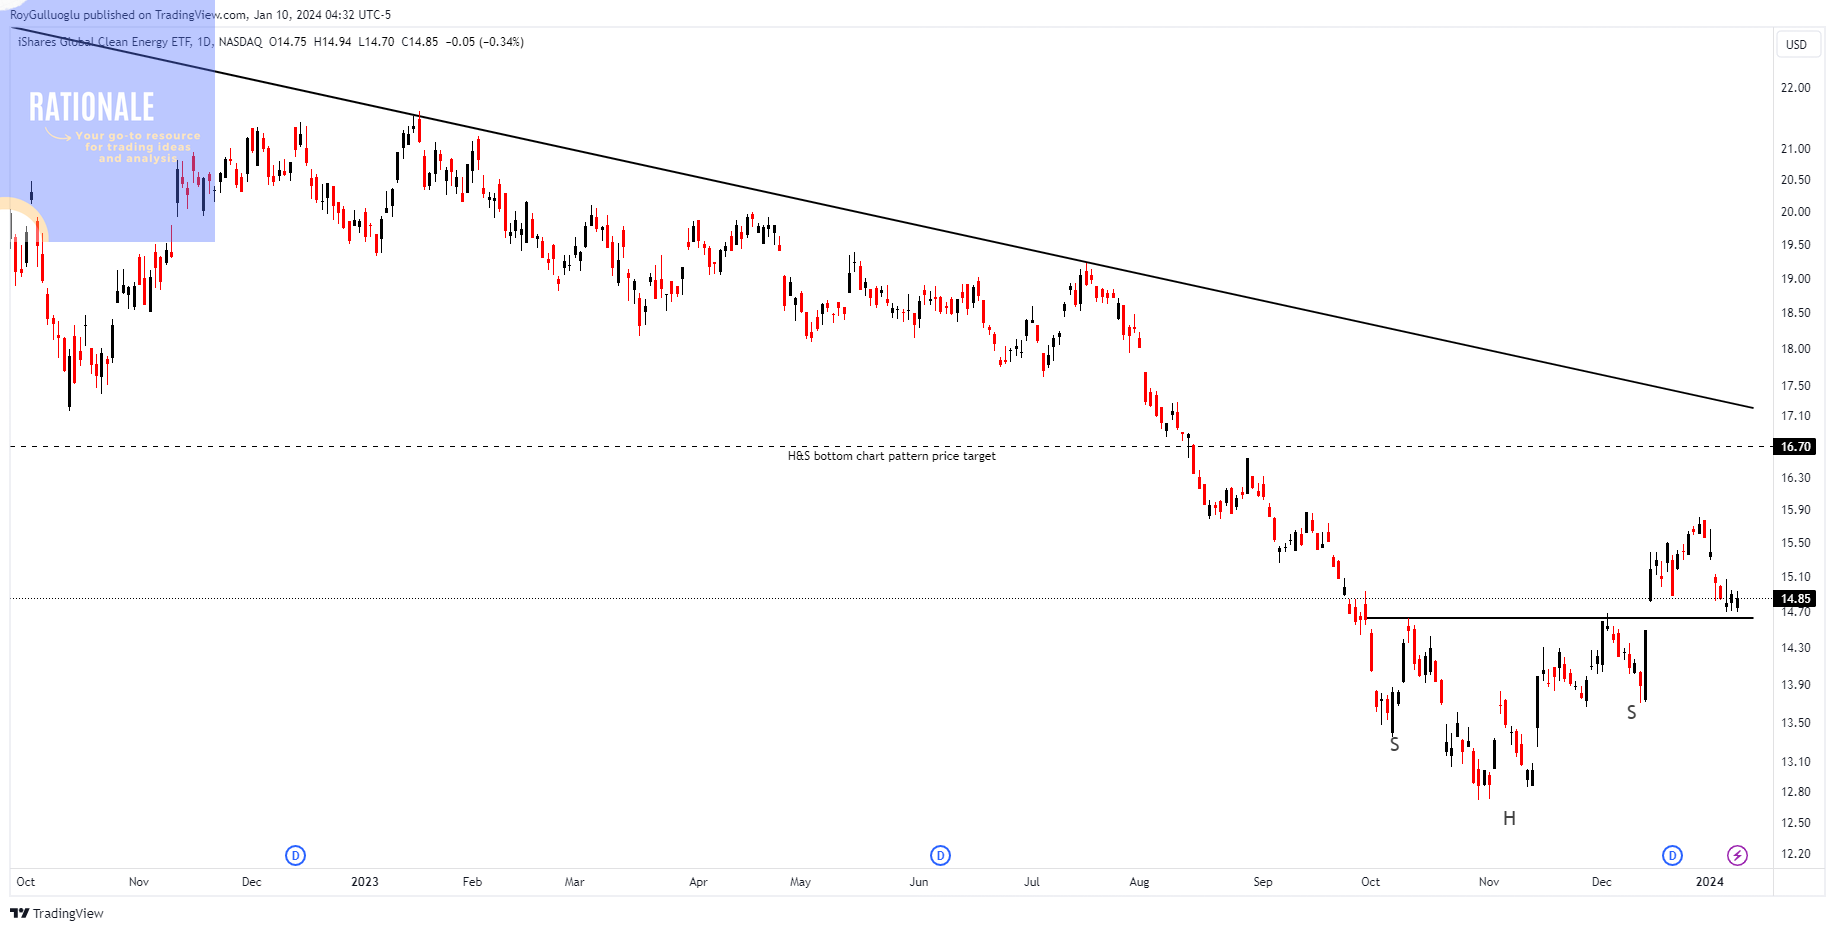
ICLN allocates funds to worldwide companies in the clean energy sector, encompassing biofuels, ethanol, geothermal, hydroelectric, solar, and wind industries. In addition to investing in energy-producing entities, ICLN also includes companies engaged in the development of technology and equipment integral to these processes.
The above daily chart formed an approximately 2-month-long H&S bottom chart pattern as a bullish reversal after a downtrend.
Within this pattern, the horizontal boundary at 14.63 levels acted as a resistance.
A daily close above 15.06 levels validated the breakout from the 2-month-long H&S bottom chart pattern. The price has broken out of the chart pattern and pulled back.
Based on this chart pattern, the potential price target is 16.7 levels.
Top 10 holdings
XLMUSDT - Long Idea
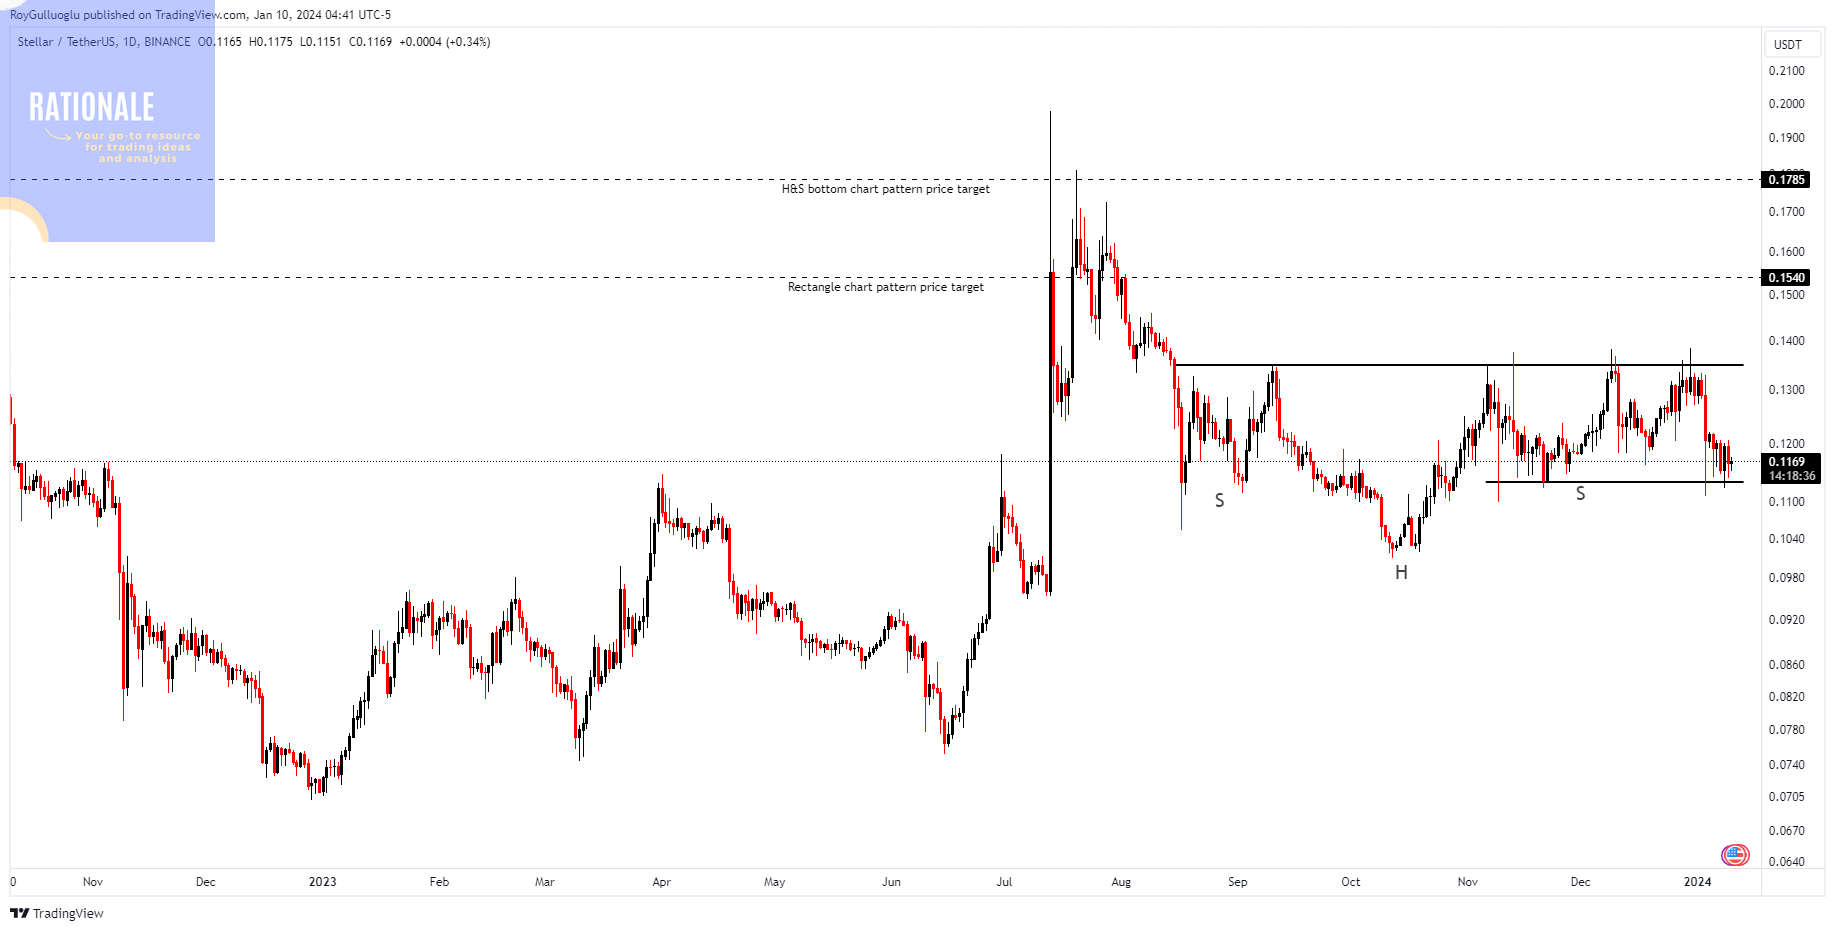
The above daily chart formed an approximately 5-month-long H&S bottom chart pattern as a bullish reversal after a downtrend.
The horizontal boundary at 0.135 levels acts as a resistance within this pattern.
A daily close above 0.139 levels would validate the breakout from the 5-month-long H&S bottom chart pattern.
Based on this chart pattern, the potential price target is 0.1785 levels.
Also, the right shoulder of the chart pattern formed a 2-month-long rectangle chart pattern with a potential target of 0.154 levels.
Follow-ups
SNXUSDT - Long Idea
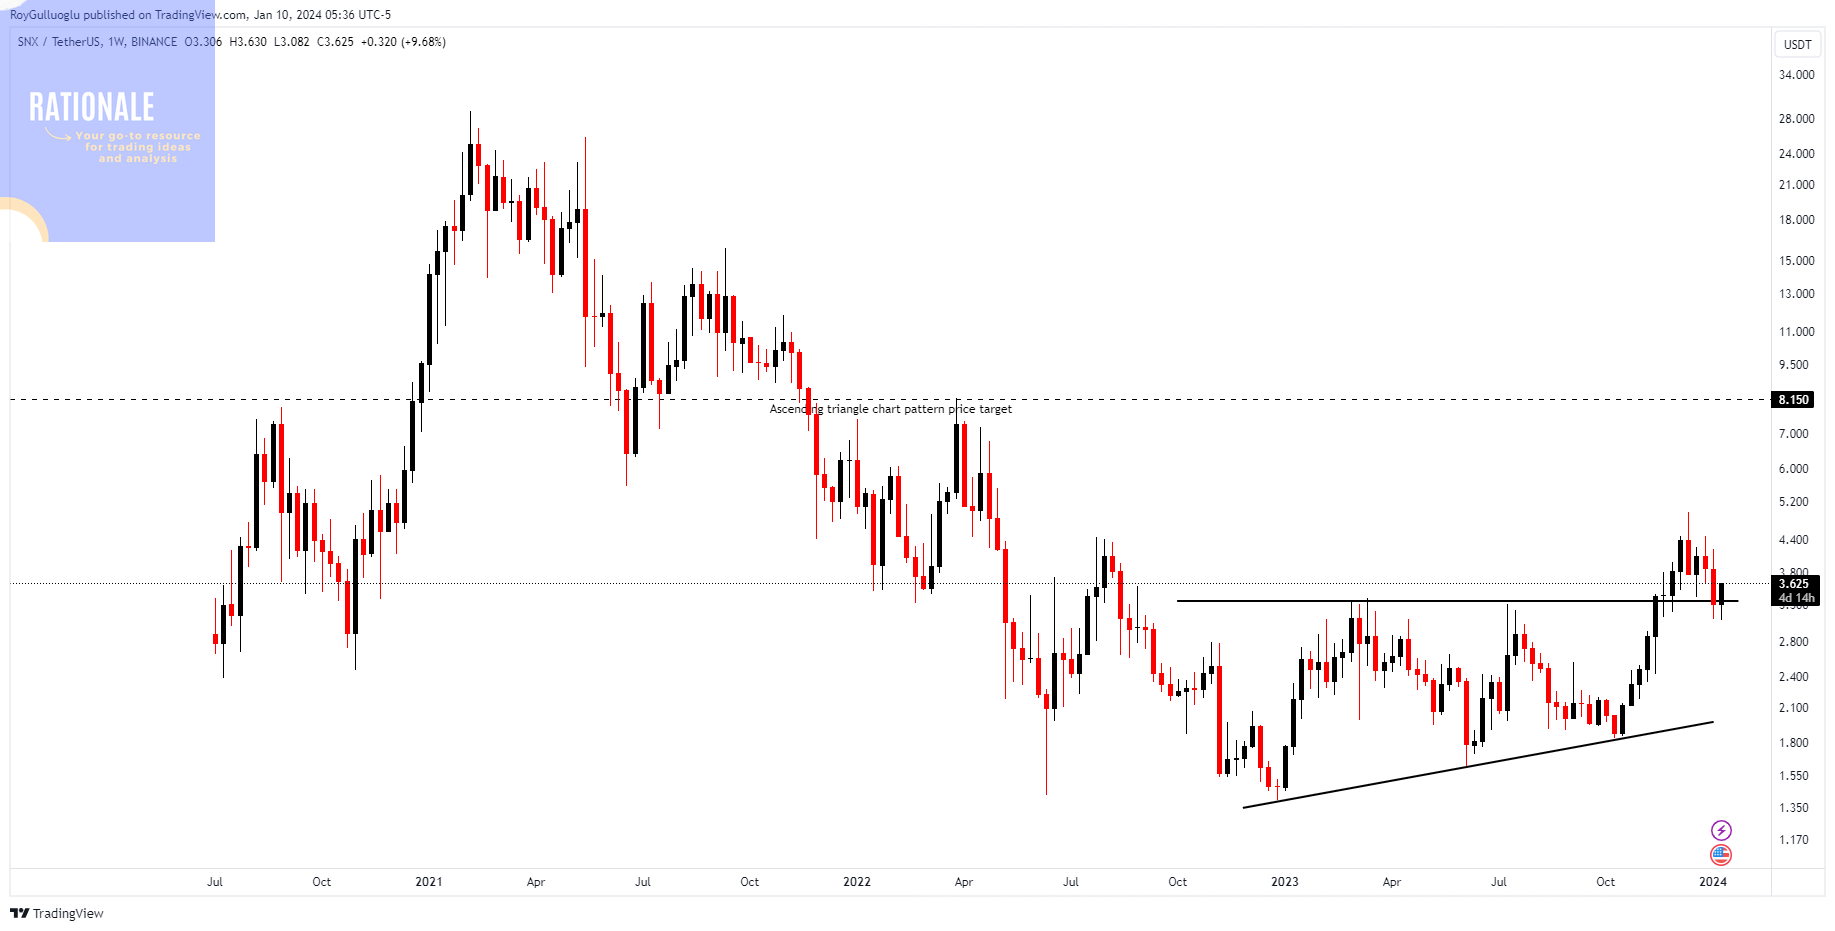
You can click the SNXUSDT ticker above to access the first report explaining the RATIONALE behind the trade idea.
The price pulled back to the resistance level of the chart pattern and resumed its movement.