

New setups
KC1! - Long Idea
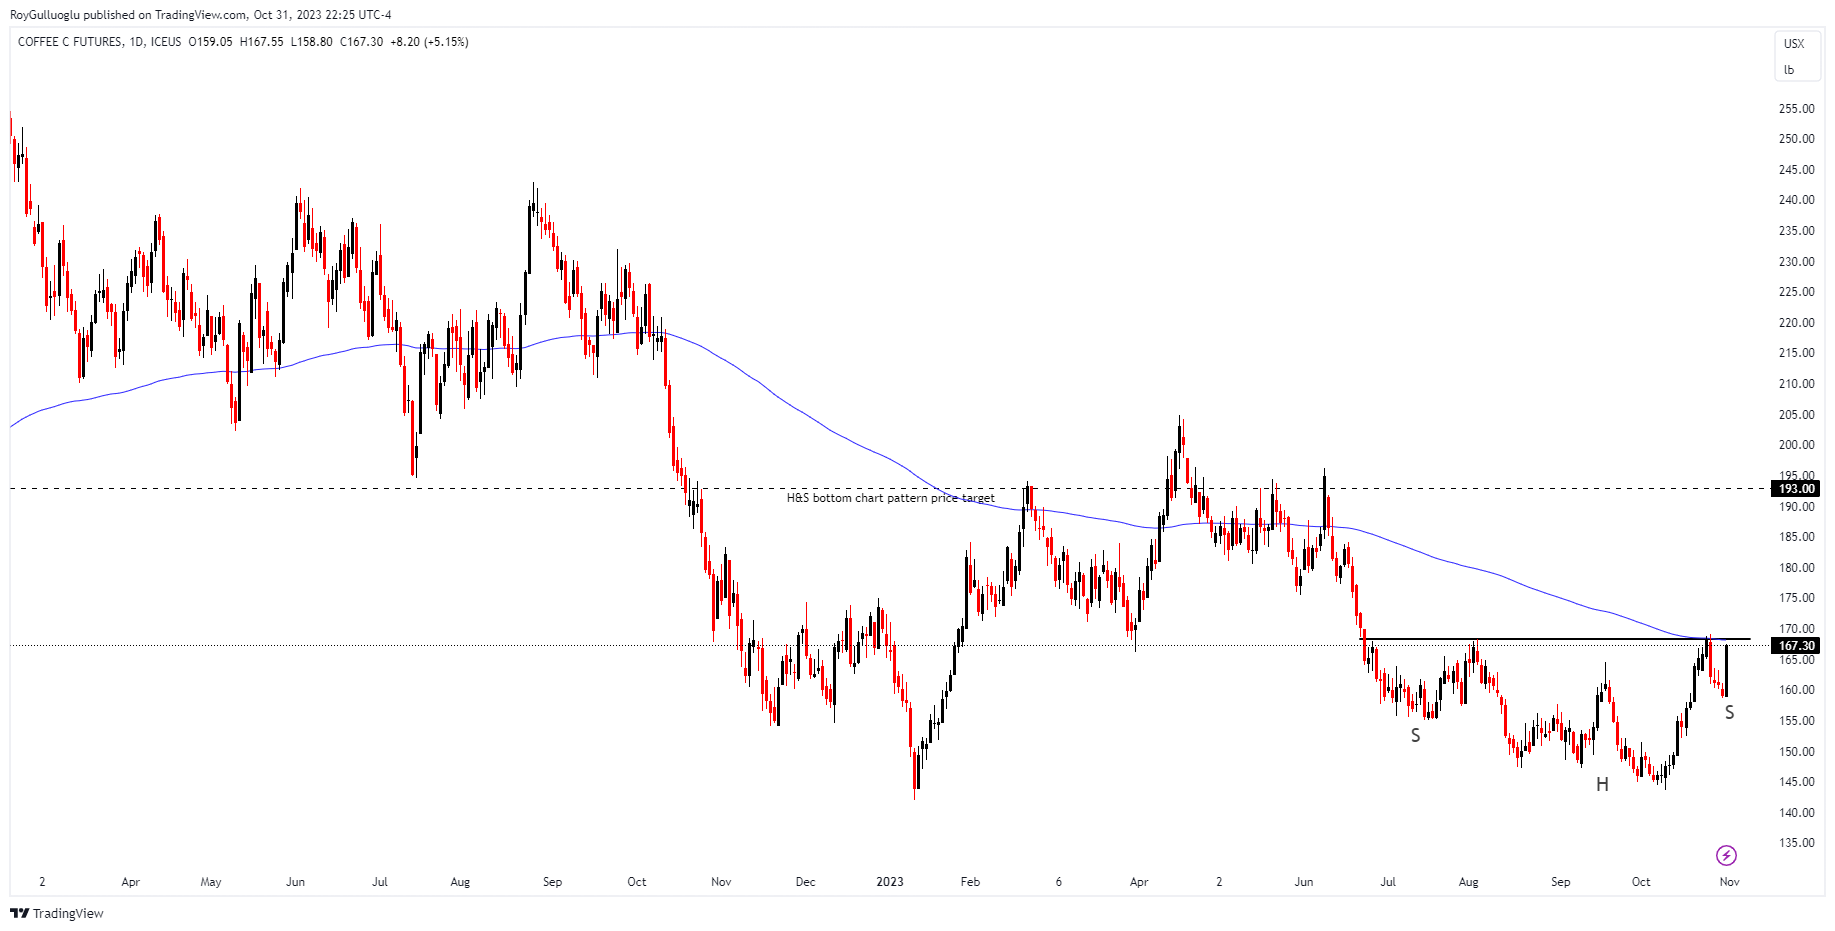
The above weekly chart formed an approximately 3-month-long rectangle chart pattern as a bullish continuation after an uptrend.
Within this pattern, the horizontal boundary at 168.25 levels acts as strong resistance.
A daily close above 173.3 levels would validate the breakout from the 3-month-long rectangle chart pattern. A potential breakout would also lead the price to move above the 200-day EMA.
Based on this chart pattern, the potential price target is 193 levels.
The primary factor influencing the price movement is the limited coffee supply. On October 30, ICE-certified exchange stocks hit a one-year low of 390,135 bags.
Also, the widening premium of the front month to the next contract (March) is indicative of the scarcity in the supply. When there is a limited supply of a commodity, it creates a sense of urgency and increased demand among market participants. This heightened demand is often reflected in the front-month futures contract because it represents the most immediate delivery.
ATOMUSDT - Long Idea
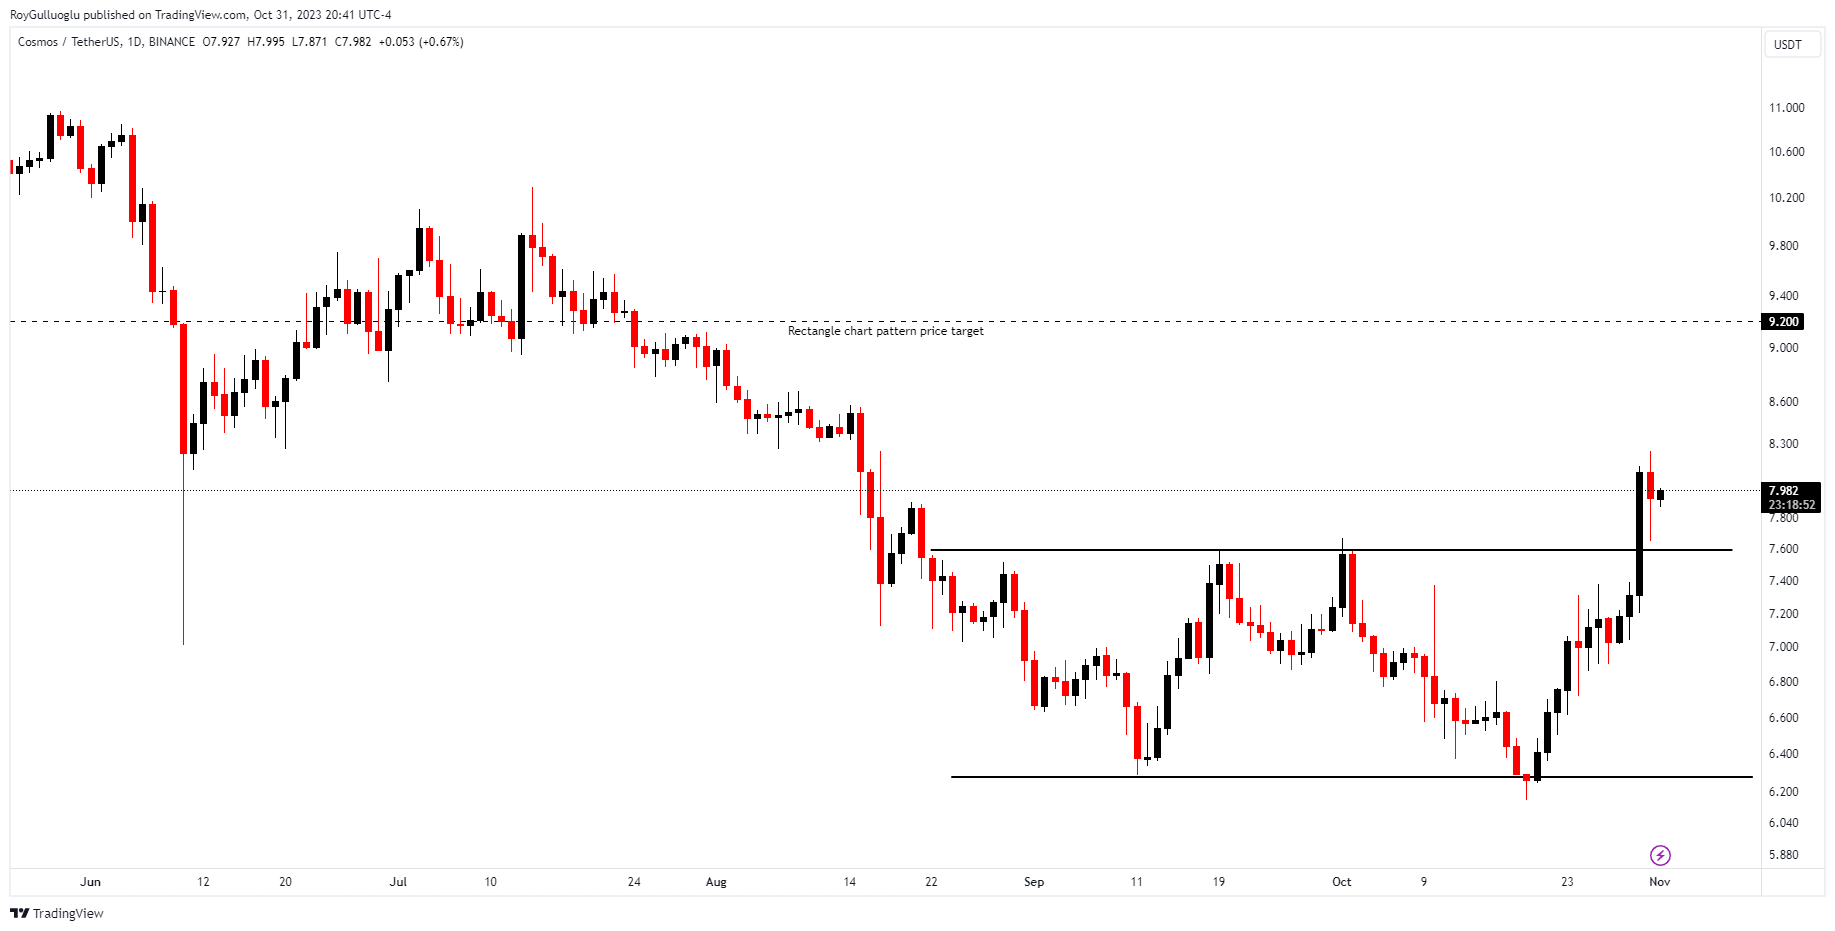
The above daily chart formed an approximately 2-month-long rectangle chart pattern as a bullish reversal after a downtrend.
Within this pattern, the horizontal boundary at 7.59 levels acted as strong resistance.
A daily close above 7.8177 levels validated the breakout from the 2-month-long rectangle chart pattern.
Based on this chart pattern, the potential price target is 9.2 levels.
BANDUSDT - Long Idea
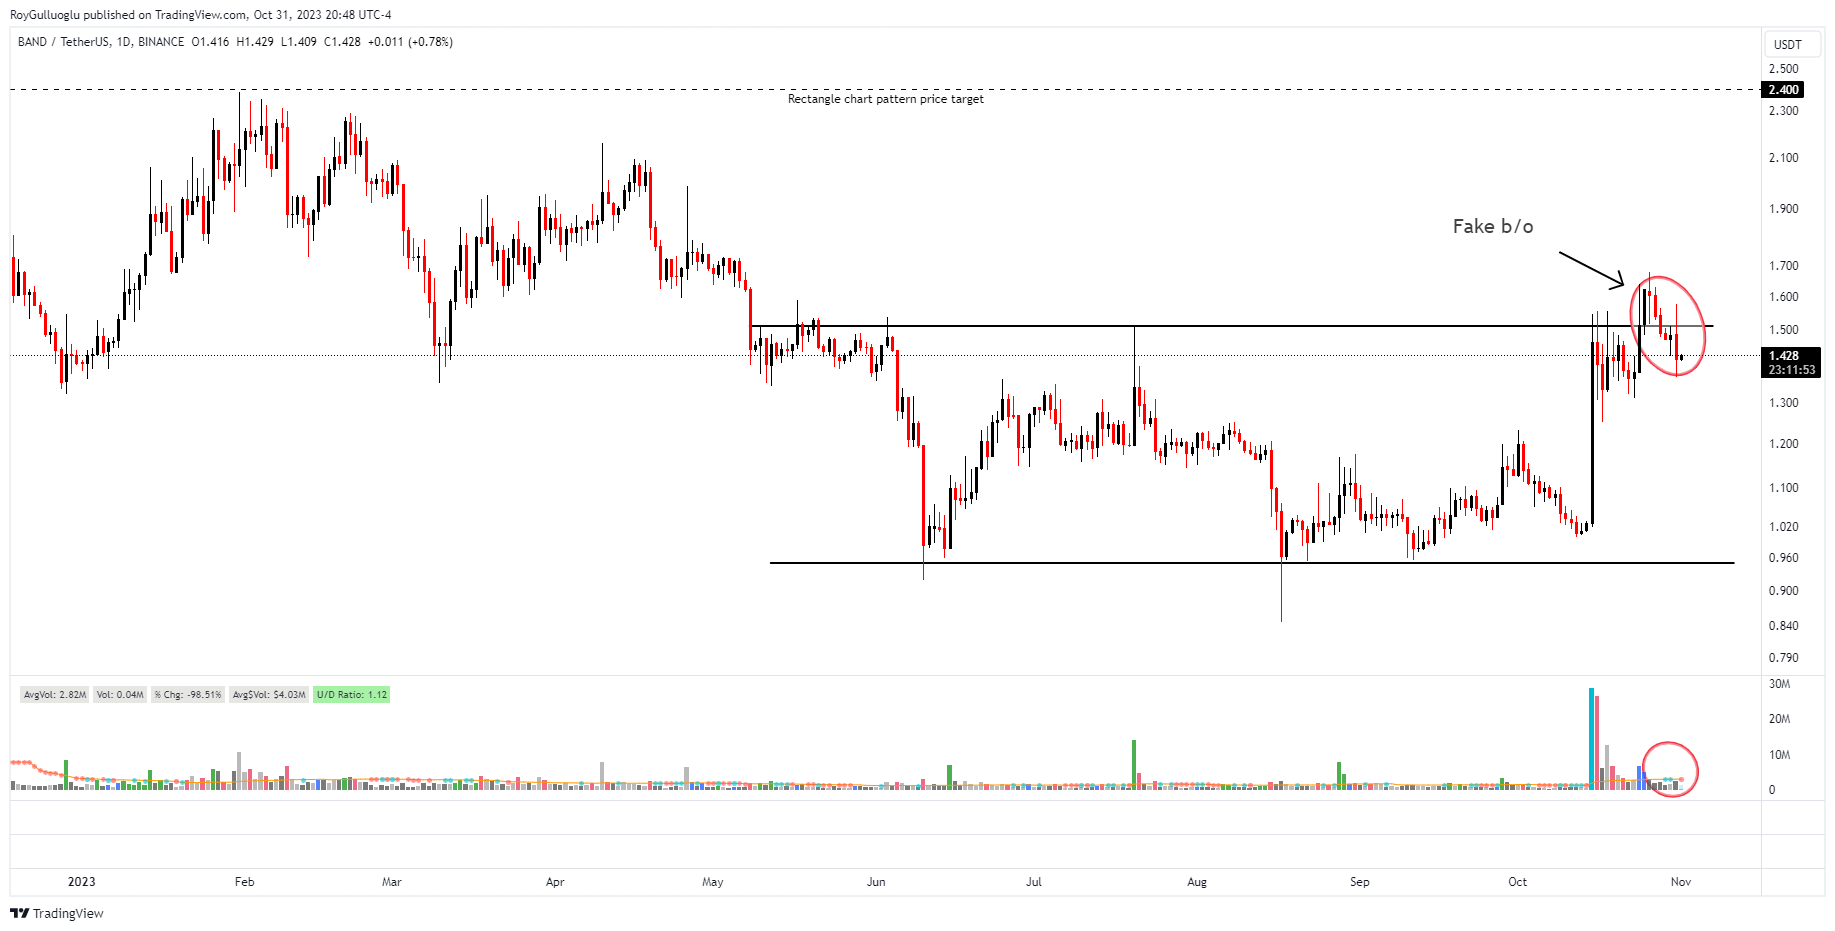
The above daily chart formed an approximately 5-month-long rectangle chart pattern as a bullish reversal after a downtrend.
Within this pattern, the horizontal boundary at 1.51 levels acts as strong resistance.
A daily close above 1.5553 levels validated the breakout from the 5-month-long rectangle chart pattern but the breakout failed.
The observed price decrease marked with a circle, accompanied by lower-than-average negative volume, suggests that there is no evidence of an oversupply. It may be worthwhile to consider re-entering the market if a new breakout occurs.
Based on this chart pattern, the potential price target is 2.4 levels.
Follow-ups
MXNJPY - Long/Short Idea
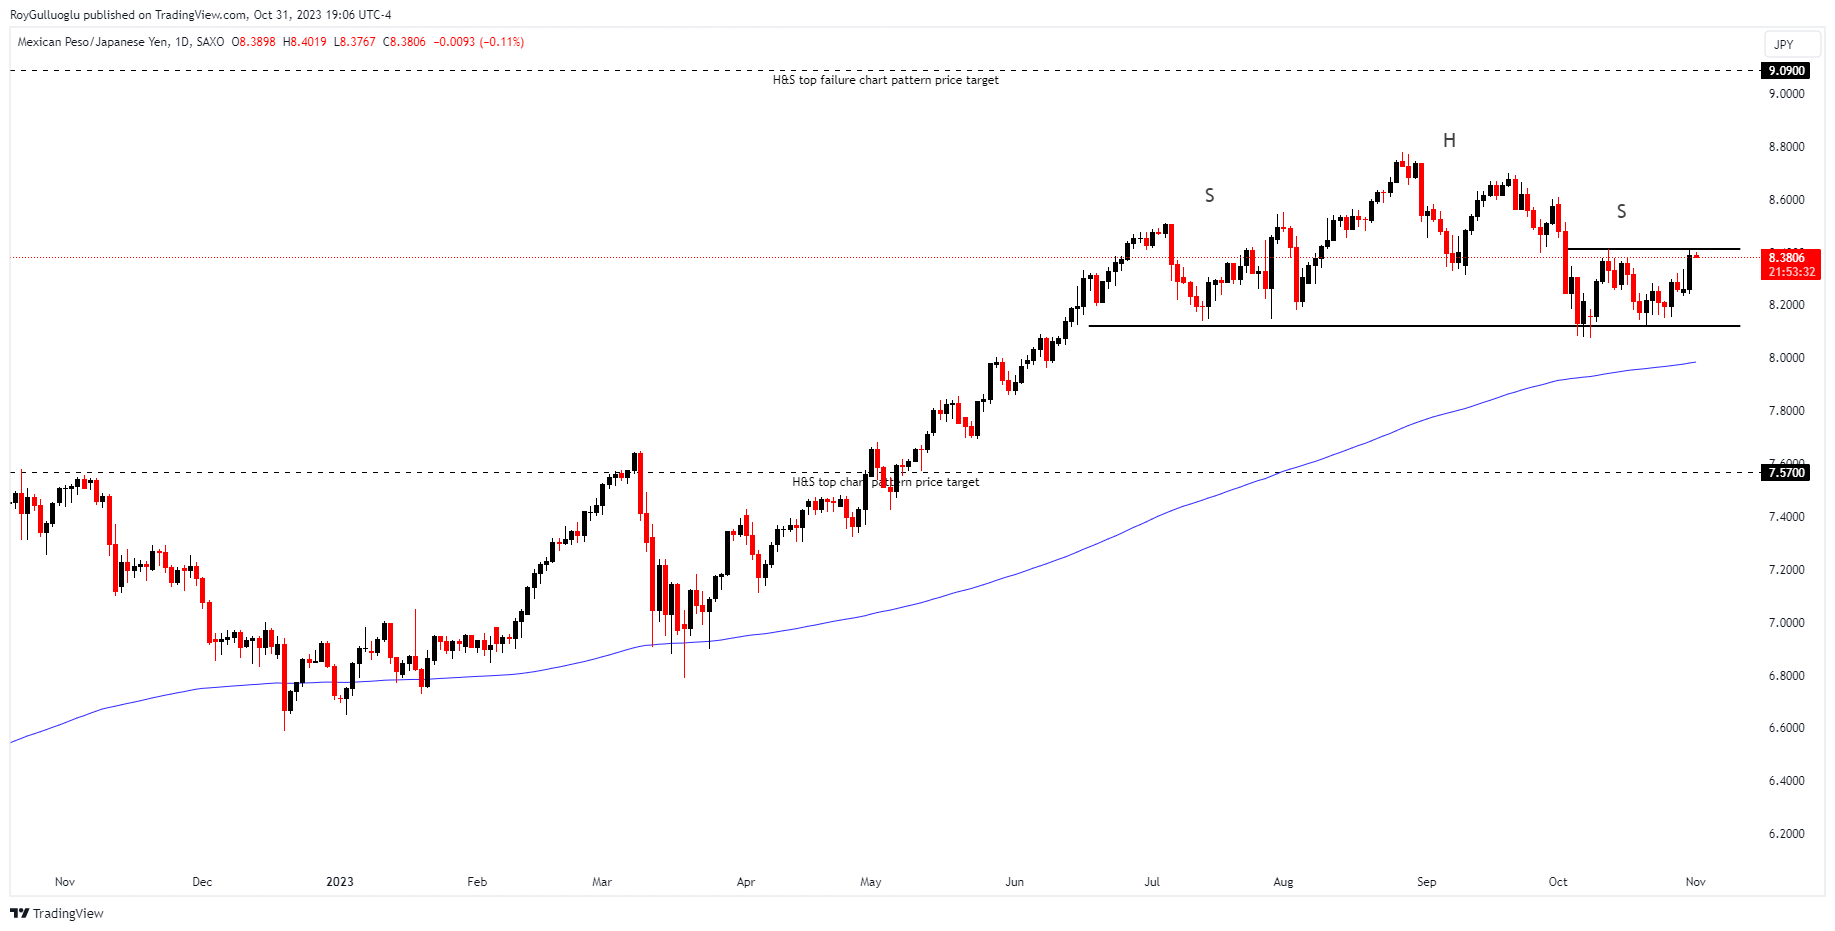
You can click on the MXNJPY ticker above to access the first report explaining the RATIONALE behind the trade idea.
The above daily chart formed an approximately 3-month-long H&S top chart pattern as a bearish reversal after an uptrend.
When the price cannot manage to break down the H&S top neckline, and then move to the highest point of the right shoulder, we may start to consider an H&S top chart pattern failure scenario where 8.41 levels act as resistance.
A daily close above 8.4941 levels would validate the breakout from the 3-month-H&S top chart pattern failure scenario.
Based on this chart pattern, the potential price target is 9.09 levels.
As previously noted, the BoJ's decision on yield curve control holds significant importance in the context of this trading concept.
On Tuesday, the market had anticipated a potential shift in the BoJ's yield curve control policy, which could have led to an appreciation of the JPY's value. However, the BoJ ultimately opted to maintain its existing policy stance except for verbal guidance in yield curve control, keeping interest rates stable without making any substantial changes. The outcome was an increase in the USDJPY exchange rate beyond the 150 level.
From the BoJ's perspective, their inflation target is met through a 3% wage inflation rate, but they seek to observe a corresponding movement in price increases. They are monitoring the responsiveness of service inflation to wage inflation, but they remain unconvinced.
The outcome of wage negotiations in Japan in 2024 will exert a significant influence on the BoJ's decision-making. The results are scheduled for announcement in March, and the BoJ plans to evaluate them for a month before taking action during the April meeting.
NQ1! - Short Idea
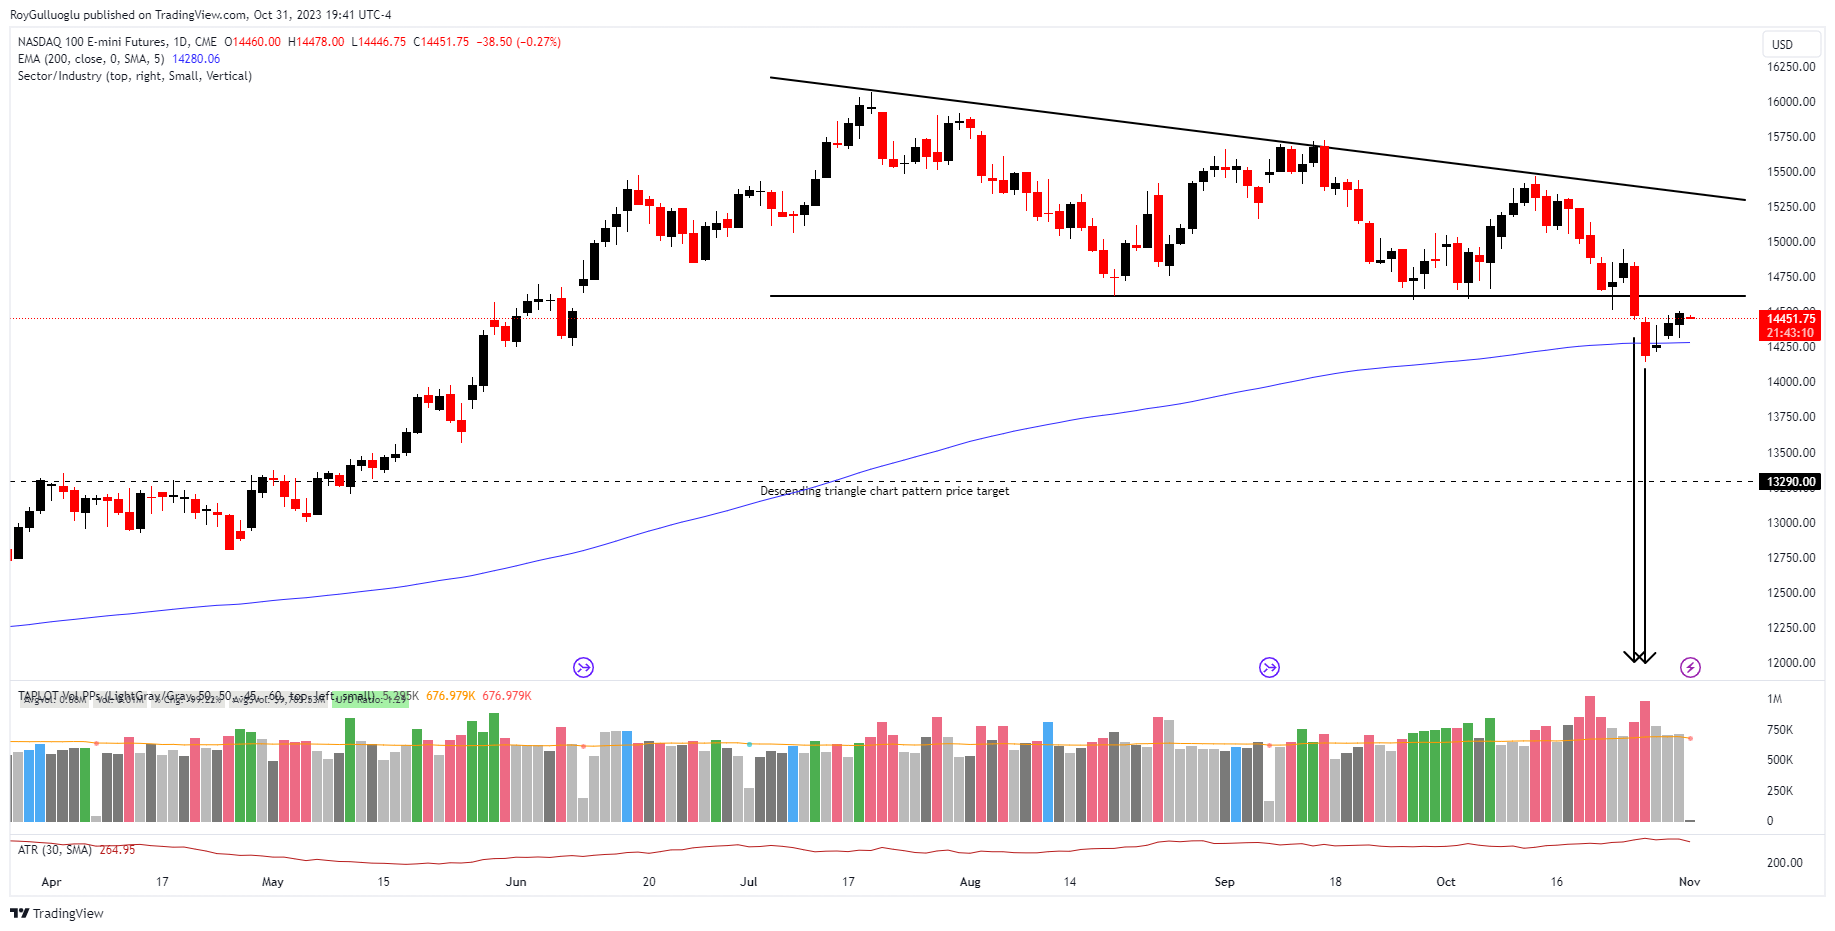
You can click on the NQ1! ticker above to access the first report explaining the RATIONALE behind the trade idea.
The price is pulling back towards the horizontal boundary of the descending triangle chart pattern.
We have seen 2 daily close below the 200-day EMA also as you can see in the attached graph the selling volumes of those two days are higher than the 50-day average volume.
CADCHF - Long/Short Idea
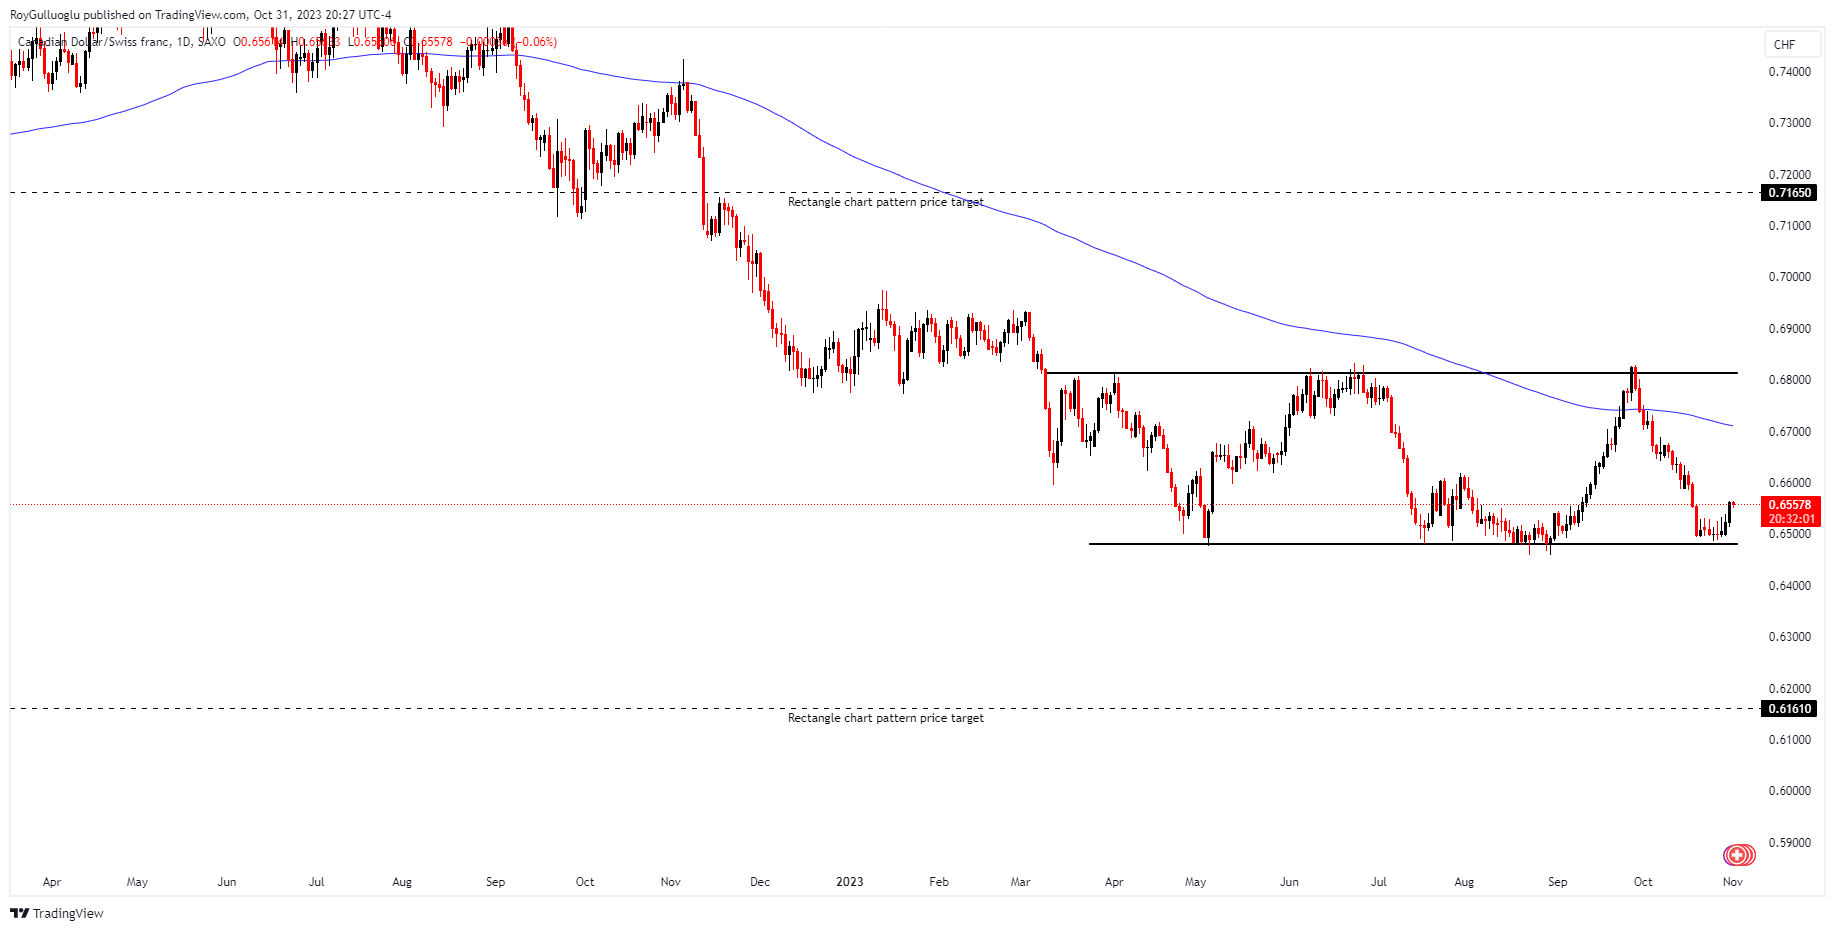
You can click on the CADCHF ticker above to access the first report explaining the RATIONALE behind the trade idea.
Shorting CAD against CHF is not just a technical decision but a reflection of the fundamental nature of these currencies. CAD is considered a risk-on currency due to its strong connection to oil prices, driven by Canada's role as a major oil exporter. On the other hand, CHF is a risk-off currency associated with gold and sought after as a safe haven during uncertain times. This makes CAD/CHF a play on economic growth or recession. In times of global economic growth, CAD may outperform as oil demand rises, while in economic downturns or high-risk aversion periods, CHF may gain strength.
Current geopolitical factors are another essential consideration. These concerns can significantly impact the CAD/CHF exchange rate. For instance, ongoing conflicts in oil-producing regions could disrupt production, causing a supply-side shock that raises oil prices. This would likely boost the CAD/CHF rate. Additionally, during times of heightened global uncertainty, gold often serves as a safe-haven asset, as it does currently.
In conclusion, although I find the technical view of CAD/CHF appealing, it's important to stress the significance of considering these fundamental factors and monitoring geopolitical developments closely. These factors could greatly influence the currency pair's performance.
XRPUSDT - Long Idea
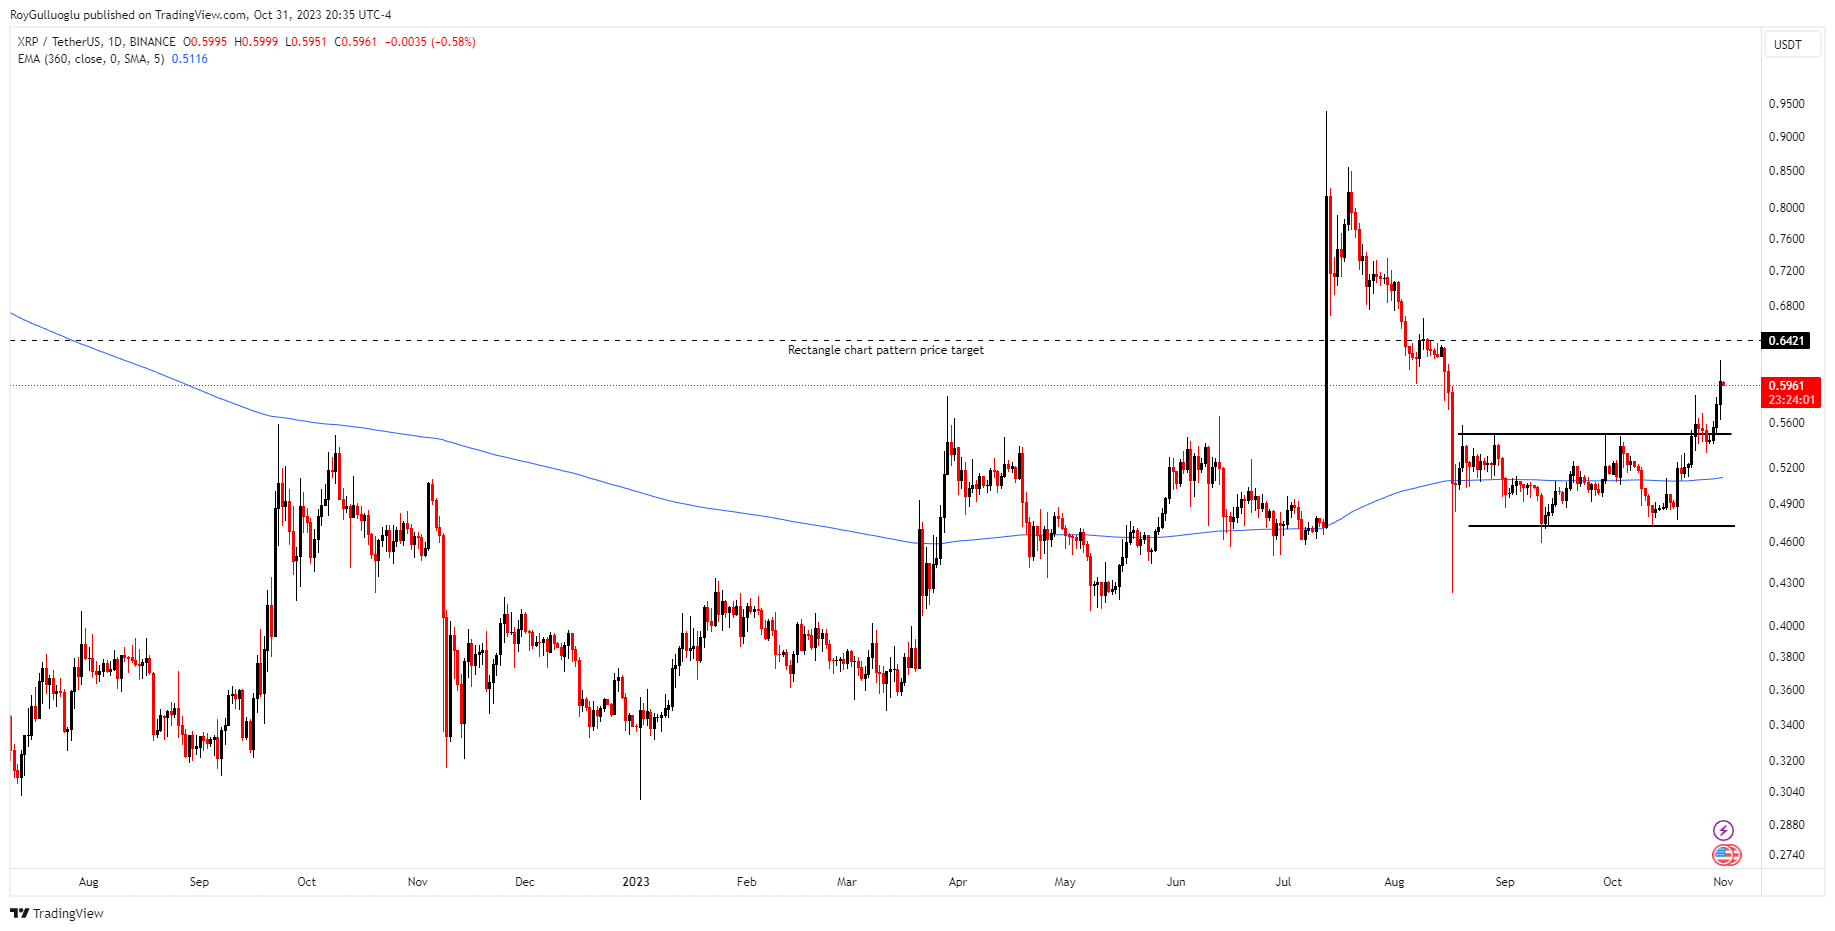
You can click the XRPUSDT ticker above to access the first report explaining the RATIONALE behind the trade idea.