

New setups
BTCUSDT - Long Idea
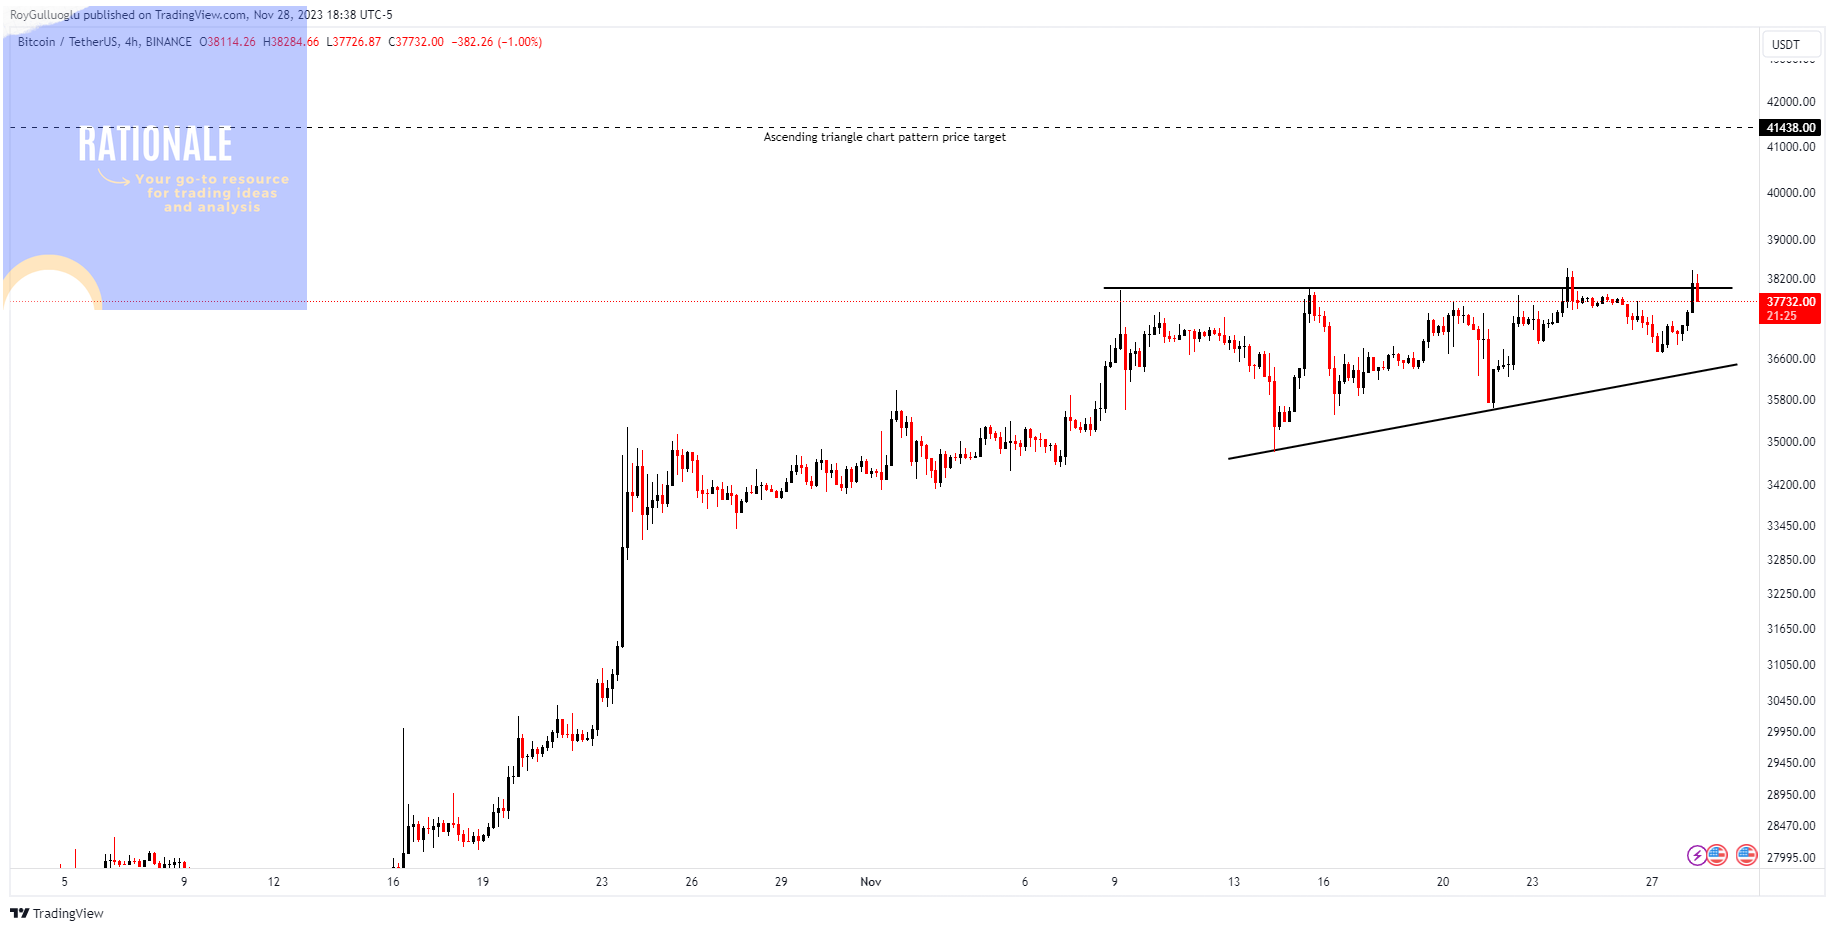
The above 4H chart formed an ascending triangle chart pattern as a bullish continuation after an uptrend.
Within this pattern, the horizontal boundary at 38000 levels acts as strong resistance.
A daily close above 39140 levels would validate the breakout.
The potential price target, based on this chart pattern, is 41440 levels.
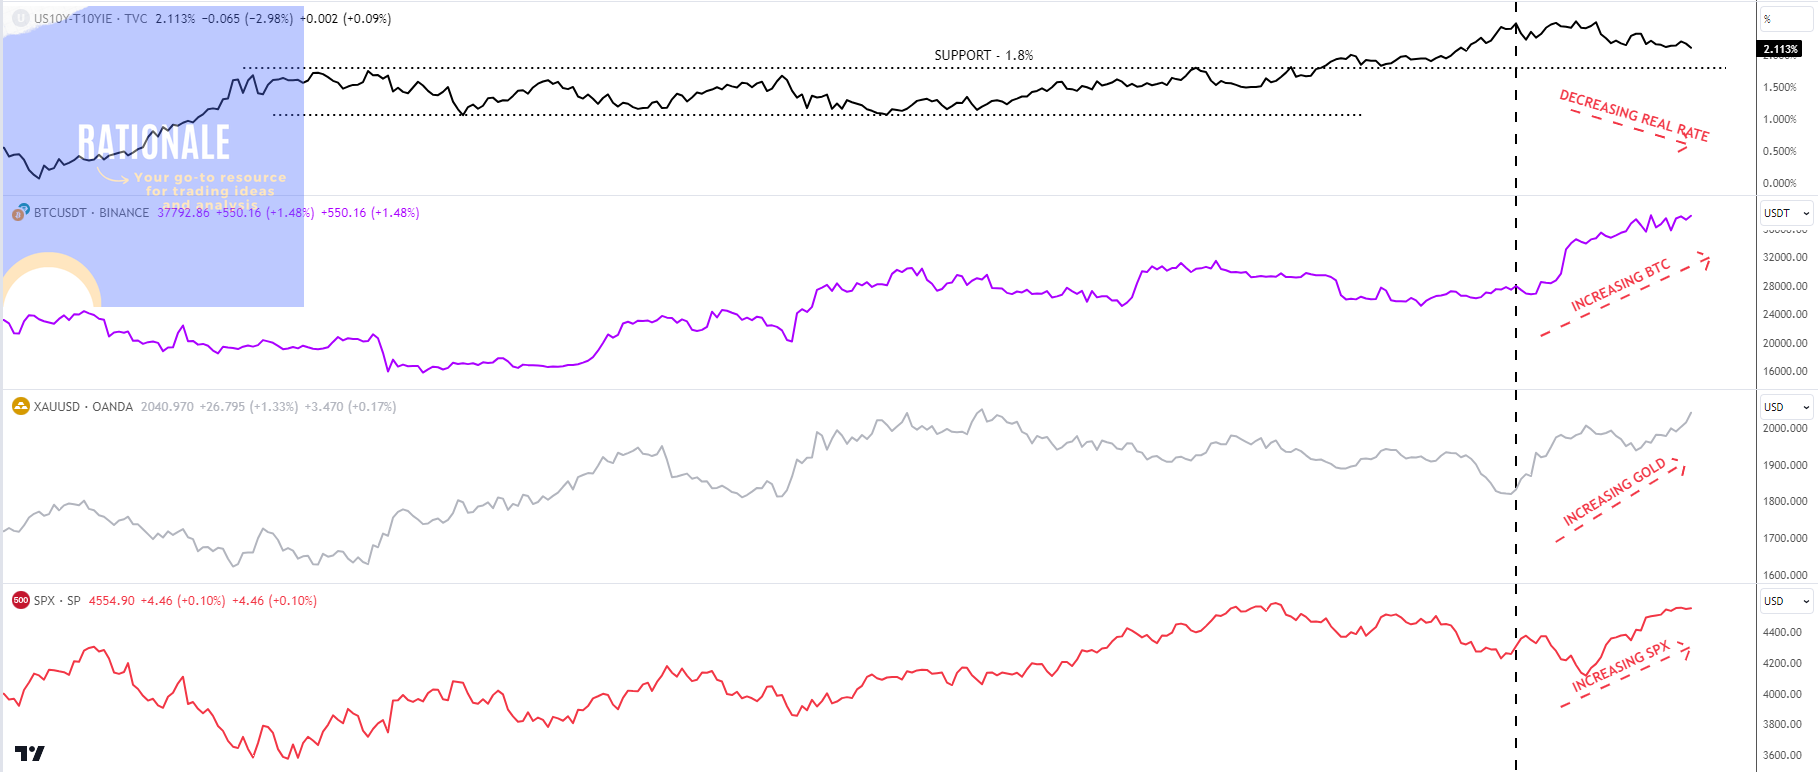
The above chart shows the impact of the real rates(the top one) to respectively BTC, GOLD, and SPX.
Expecting the decline of the real rates until 1.8% support levels seems reasonable. Until then, there is an upside room for the above instruments.
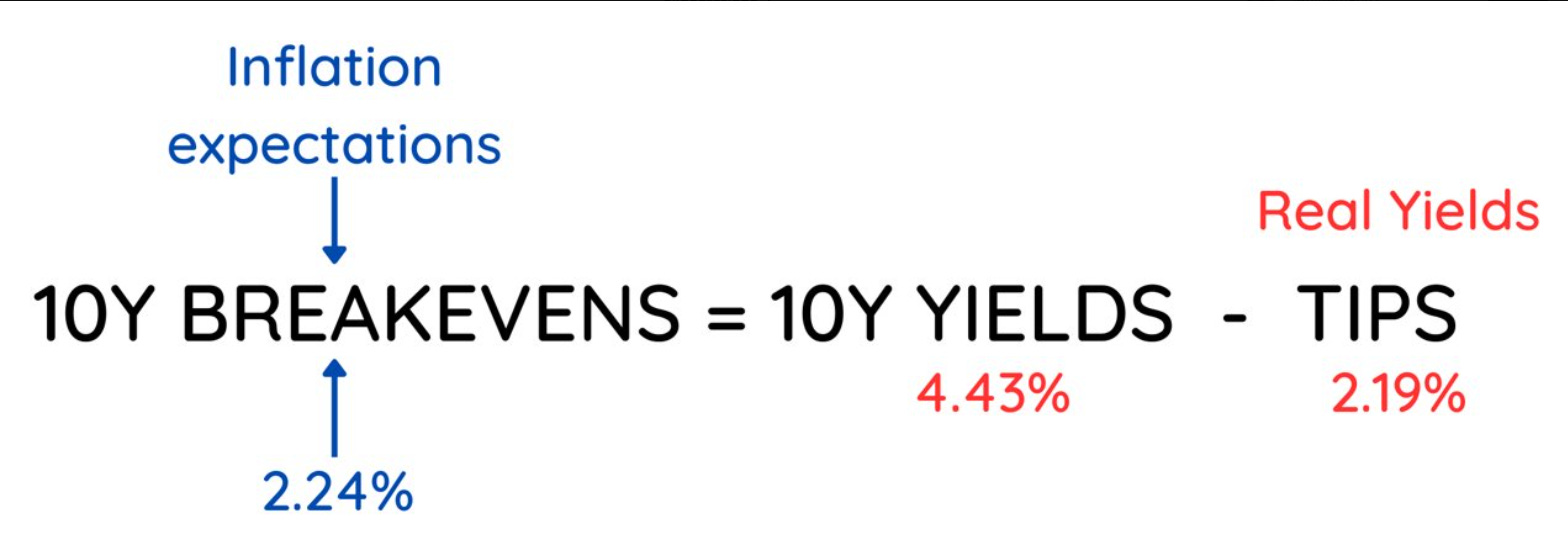
Real rates= US10Y yield - Inflation expectations.

So, recently we have been witnessing that both US10Y yields and inflation expectations are declining. As the pace of decrease in inflation expectations keeps being higher than the decline in the US 10Y yield, we would expect to see a further decline in real rates.
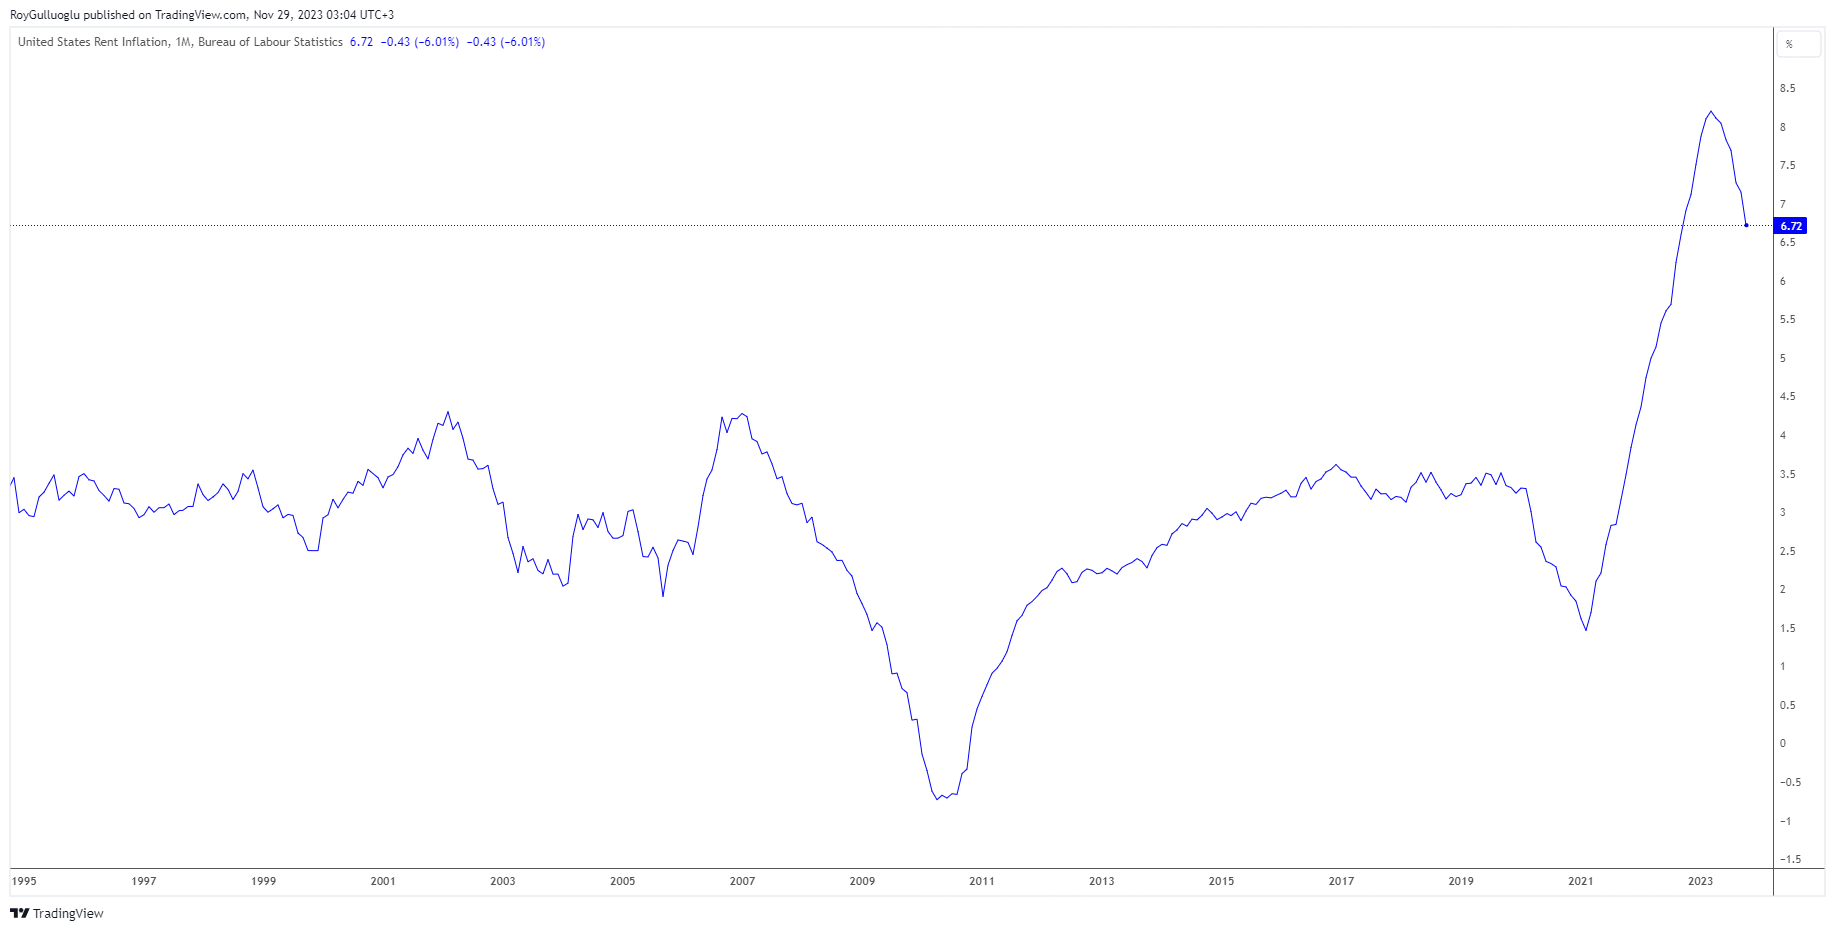
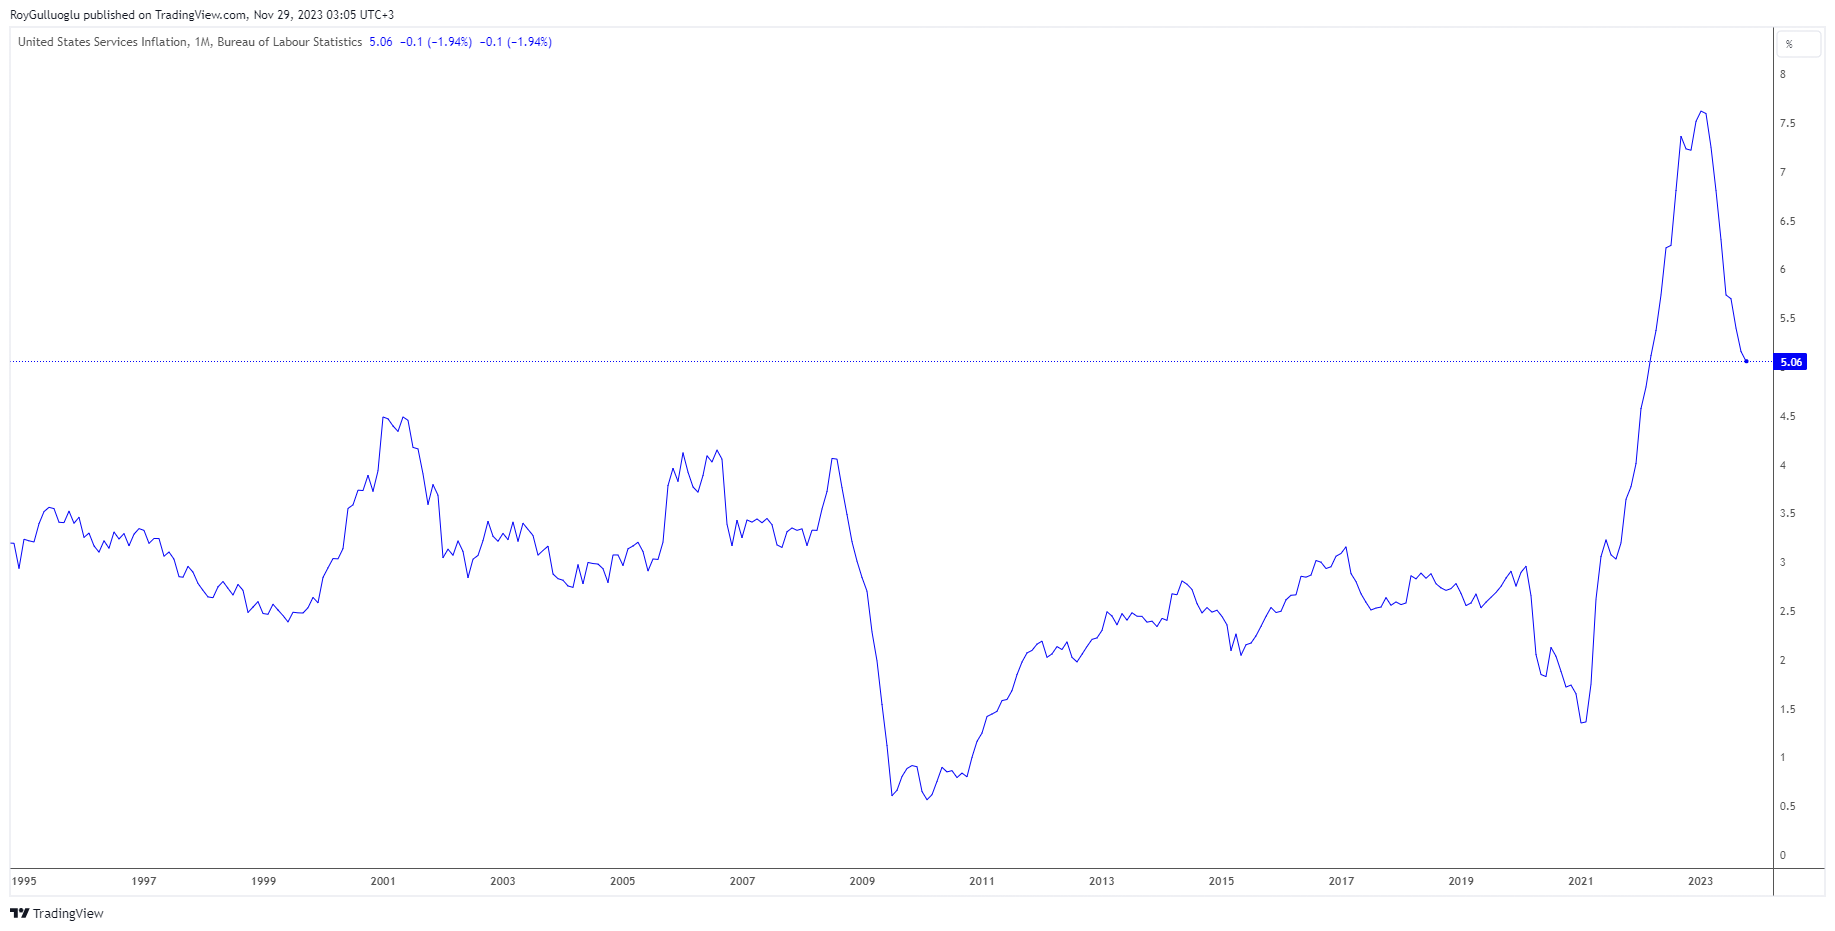
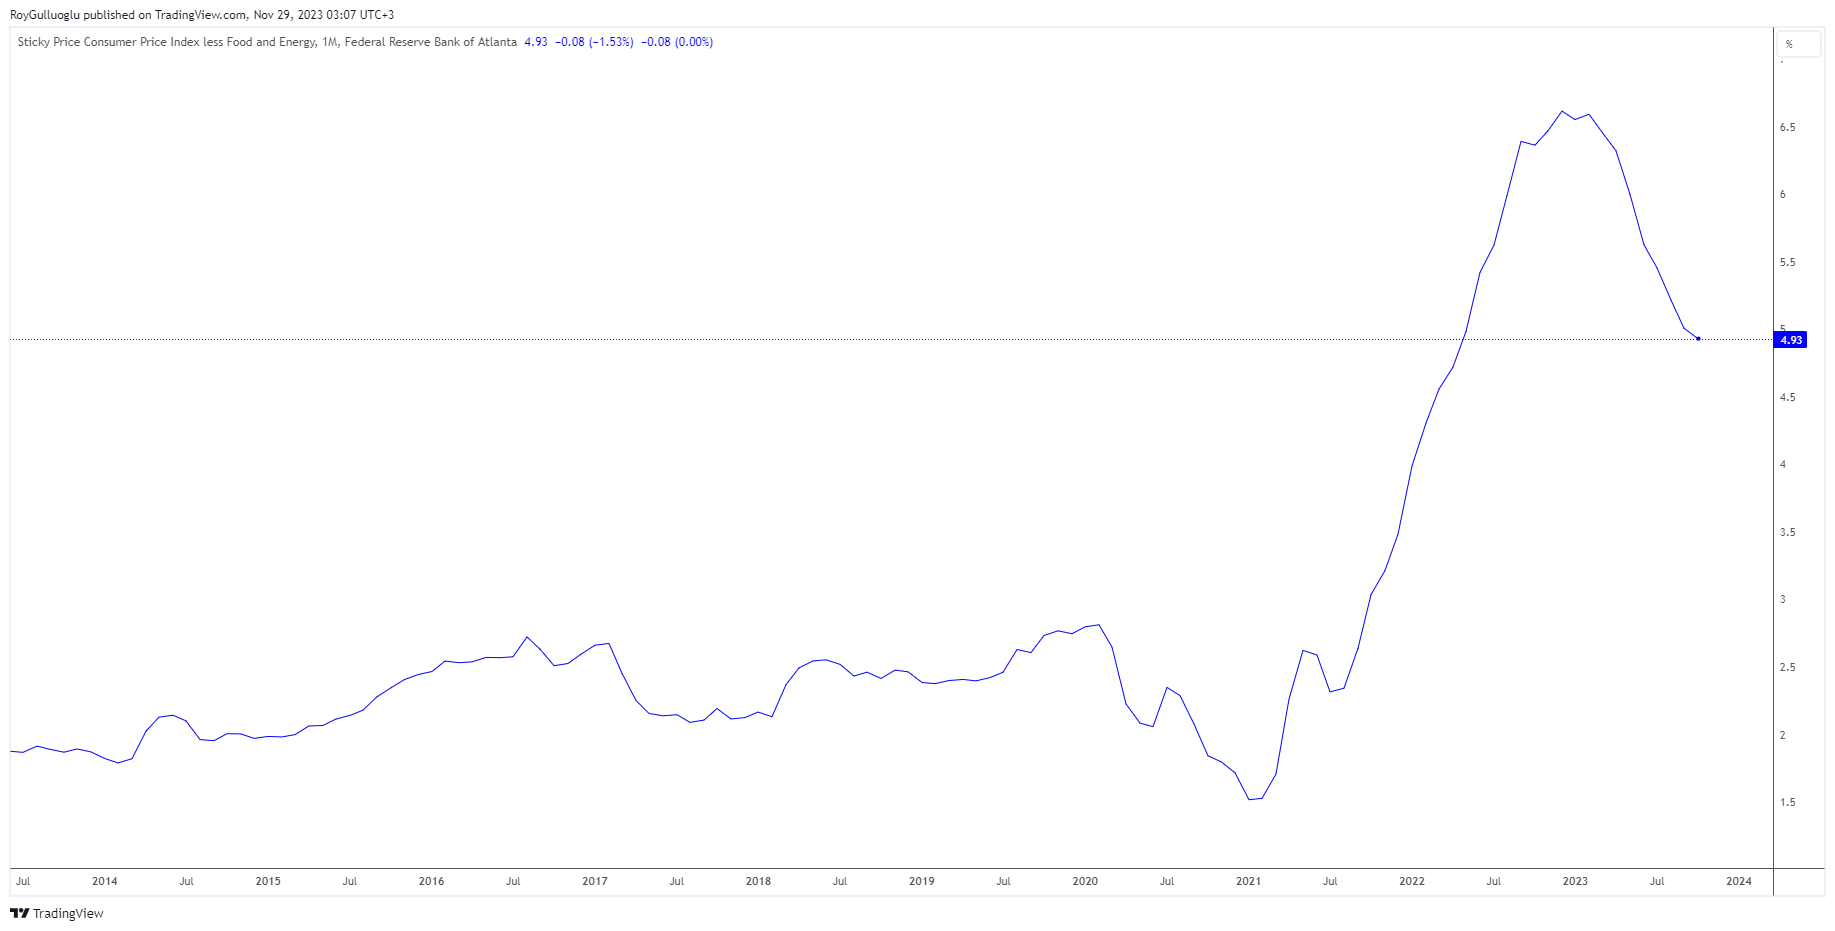
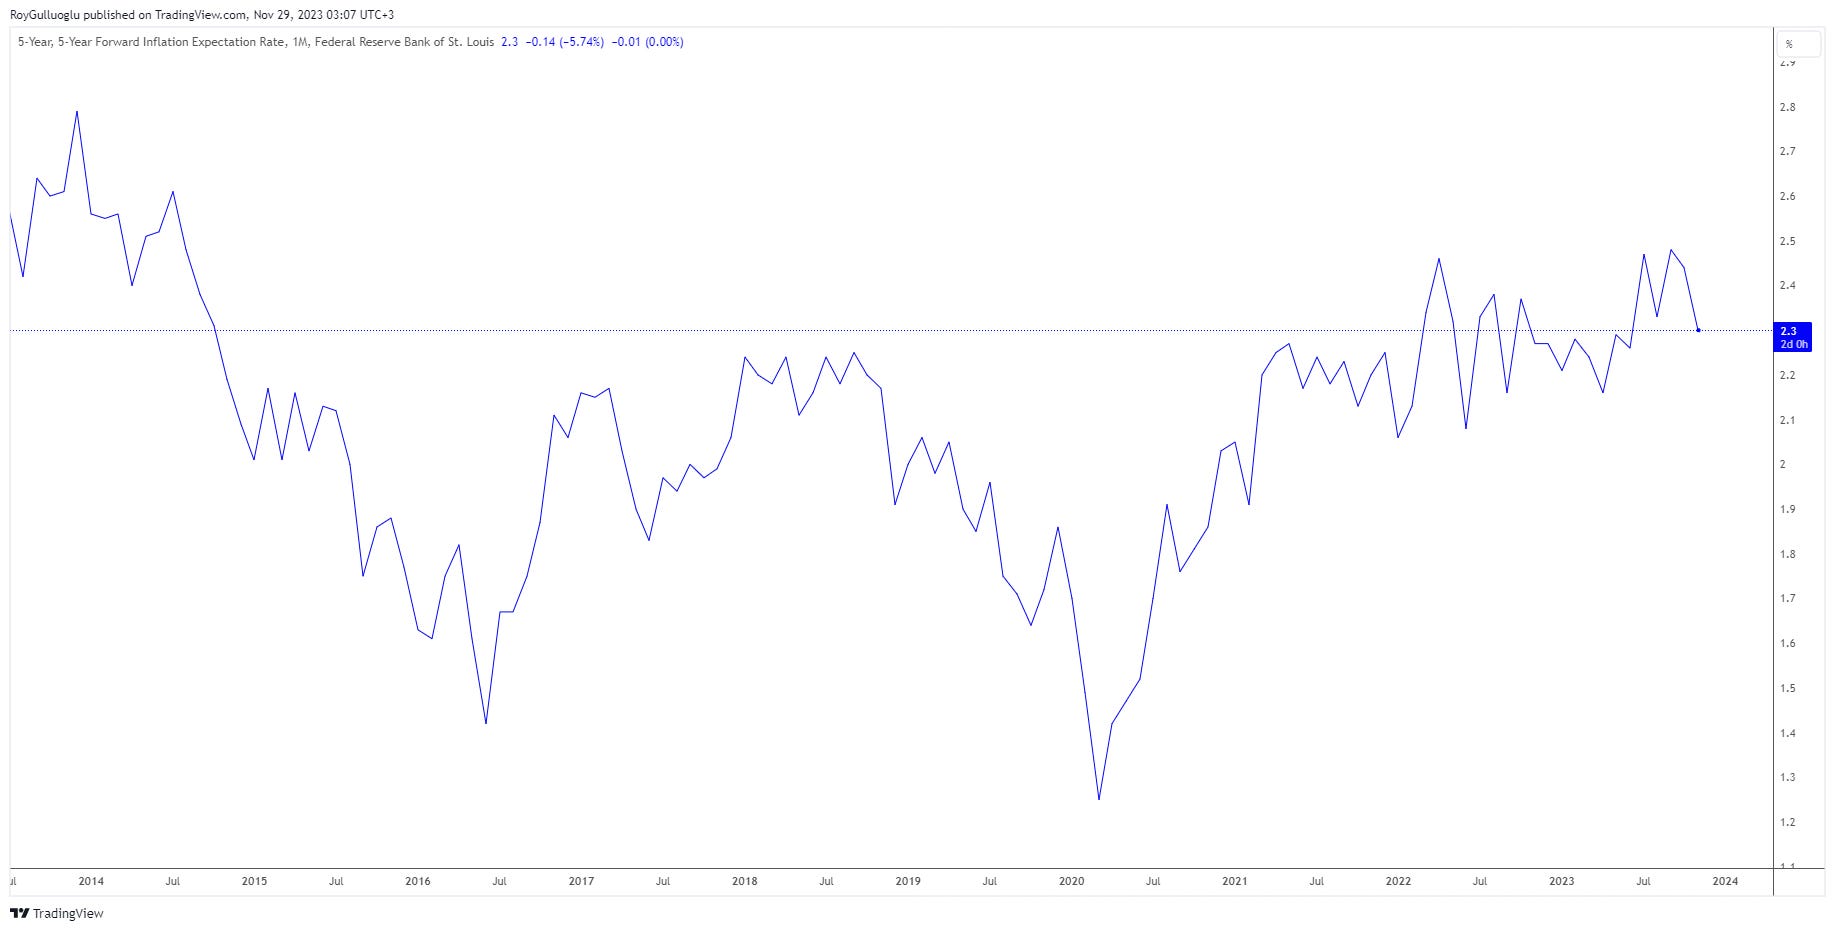
Few data supporting the improvement in inflation(decrease in inflation expectations):
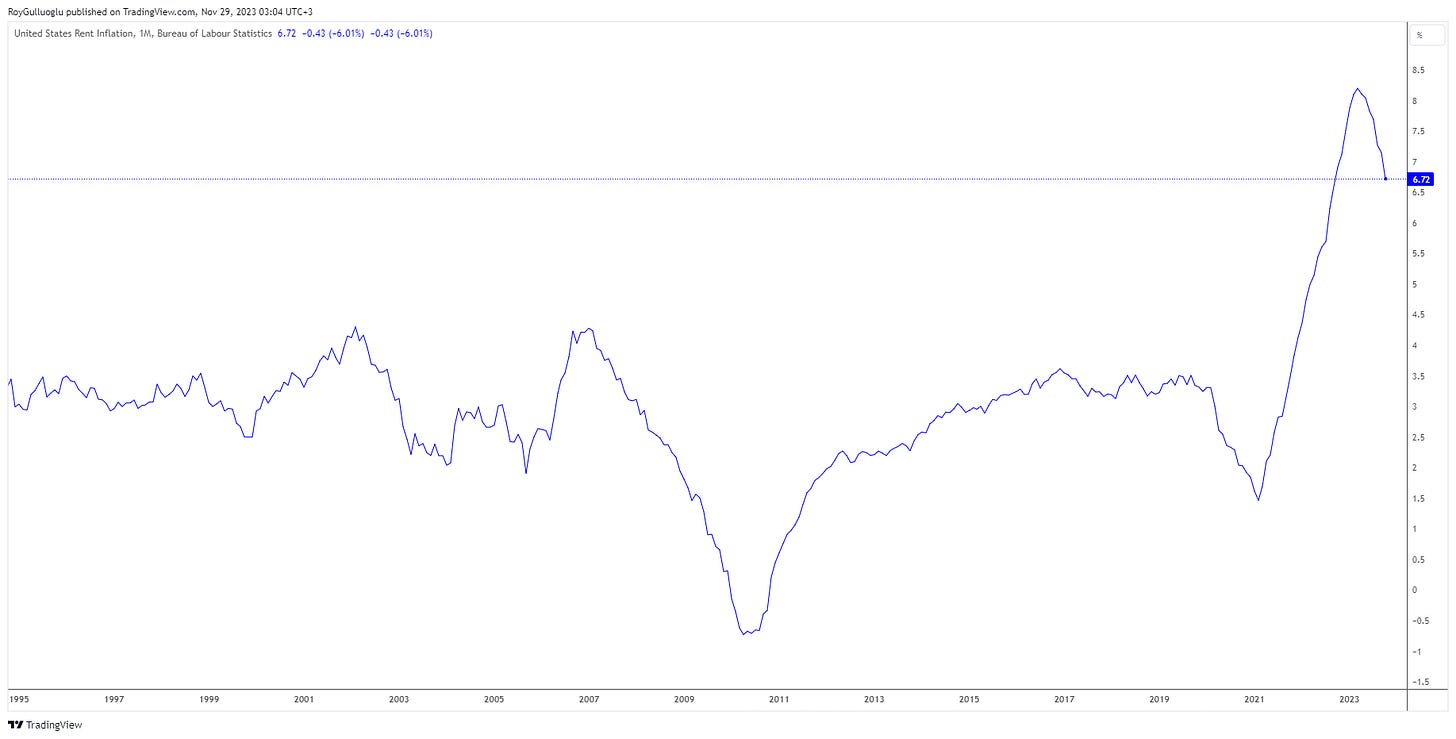
US RENT INFLATION 
US SERVICE INFLATION 
ATLANTA FED CORE STICKY CONSUMER PRICE INDEX 
ST LOUIS FED 5-YEAR, 5-YEAR FORWARD INFLATION EXPECTATION RATE
KNCUSDT - Long Idea
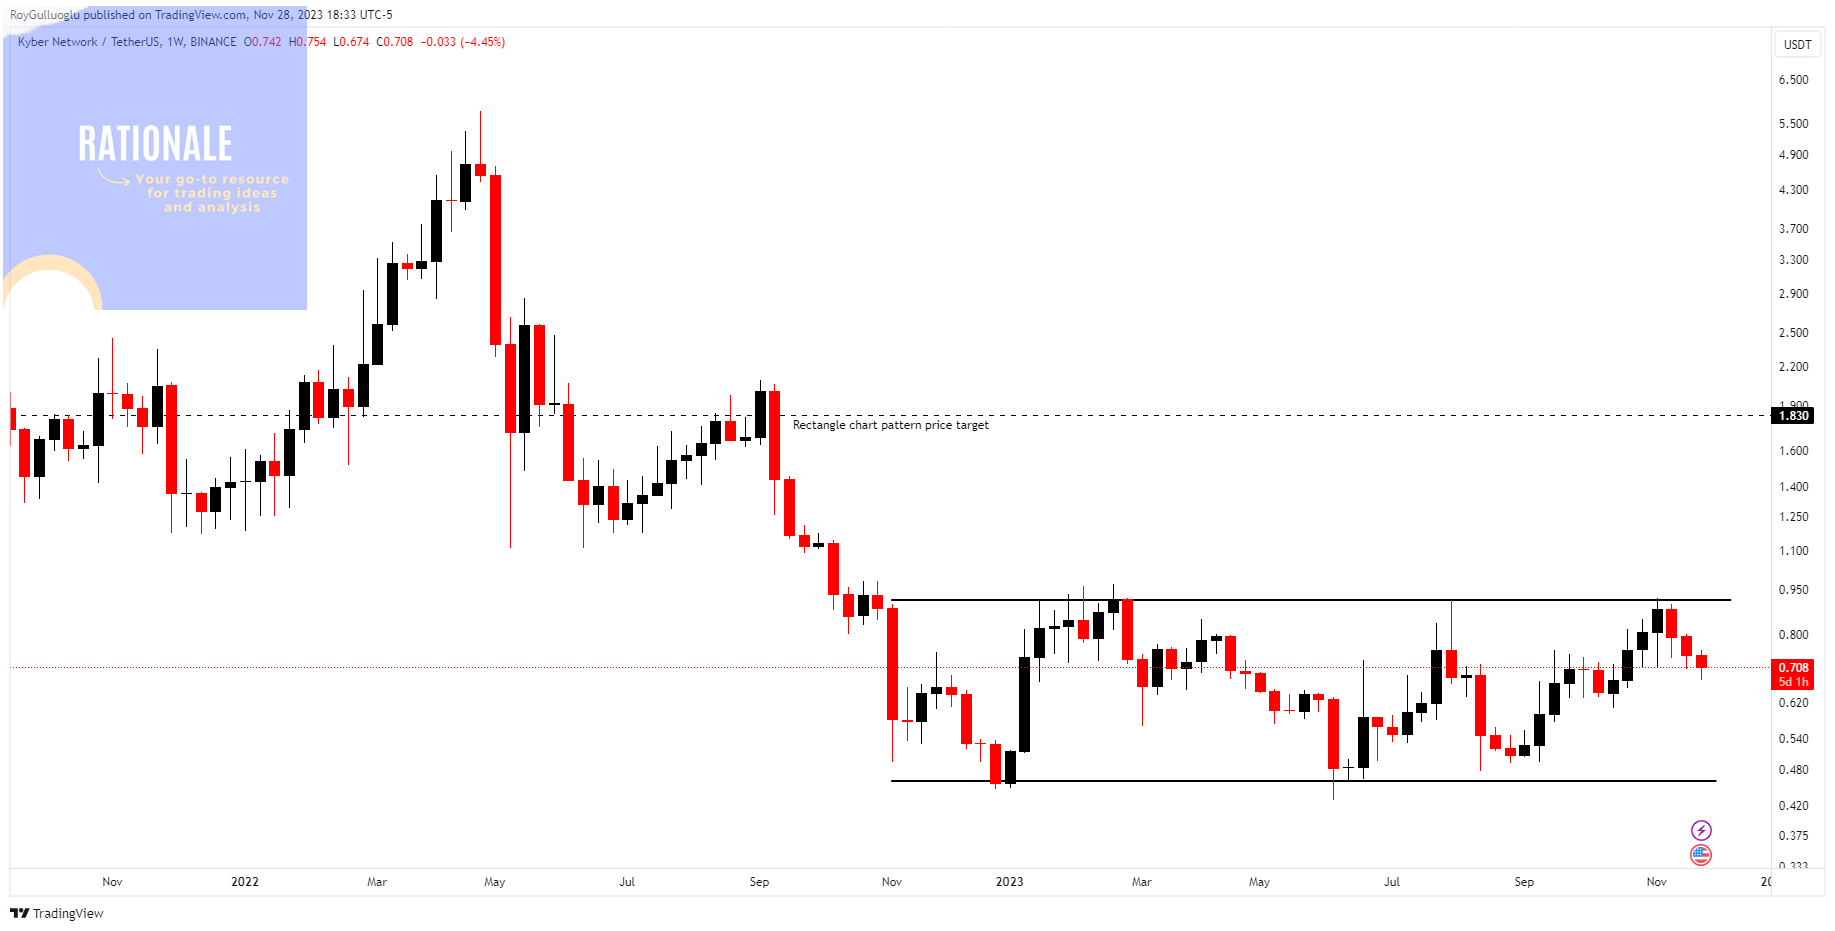
The above weekly chart formed an approximately 11-month-long rectangle chart pattern as a bullish reversal after a downtrend.
Within this pattern, the horizontal boundary at 0.912 levels acts as strong resistance.
A daily close above 0.939 levels would validate the breakout from the 11-month-long rectangle chart pattern.
The potential price target, based on this chart pattern, is 1.83 levels.
SNXUSDT - Long Idea
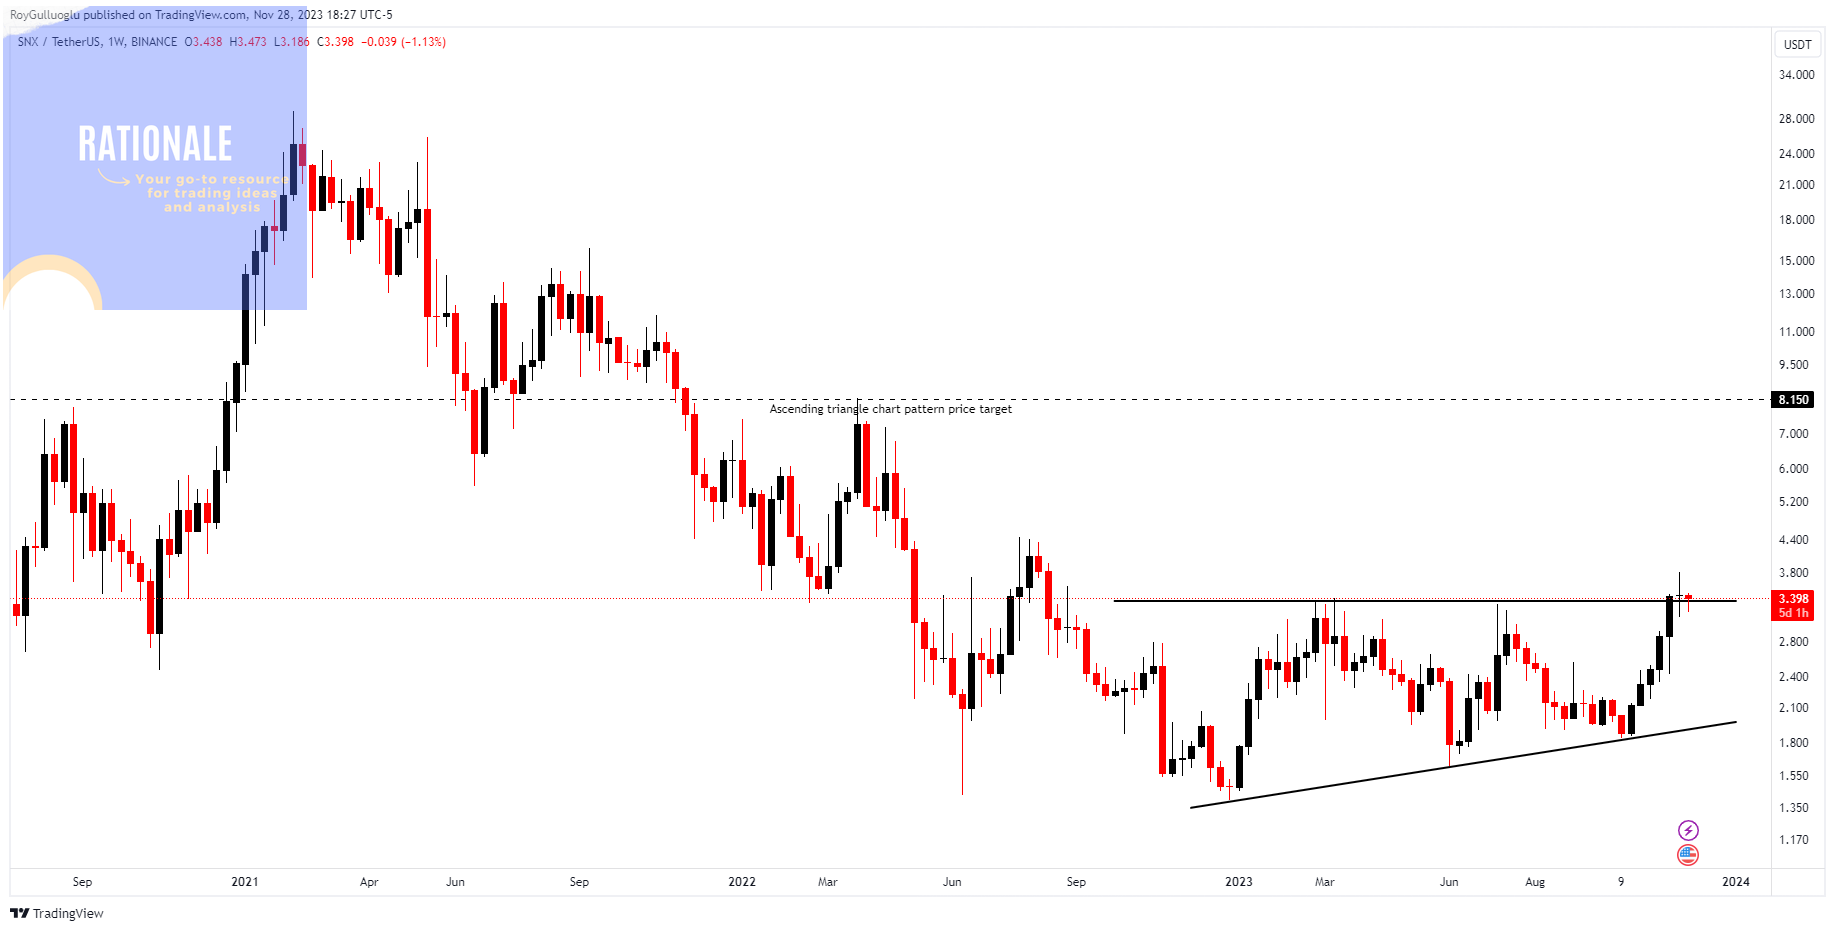
The above weekly chart formed an approximately 11-month-long ascending triangle chart pattern as a bullish reversal after a downtrend.
Within this pattern, the horizontal boundary at 3.348 levels acts as strong resistance.
A daily close above 3.448 levels would validate the breakout from the 11-month-long rectangle chart pattern.
The potential price target, based on this chart pattern, is 8.15 levels.
DENTUSDT - Long Idea
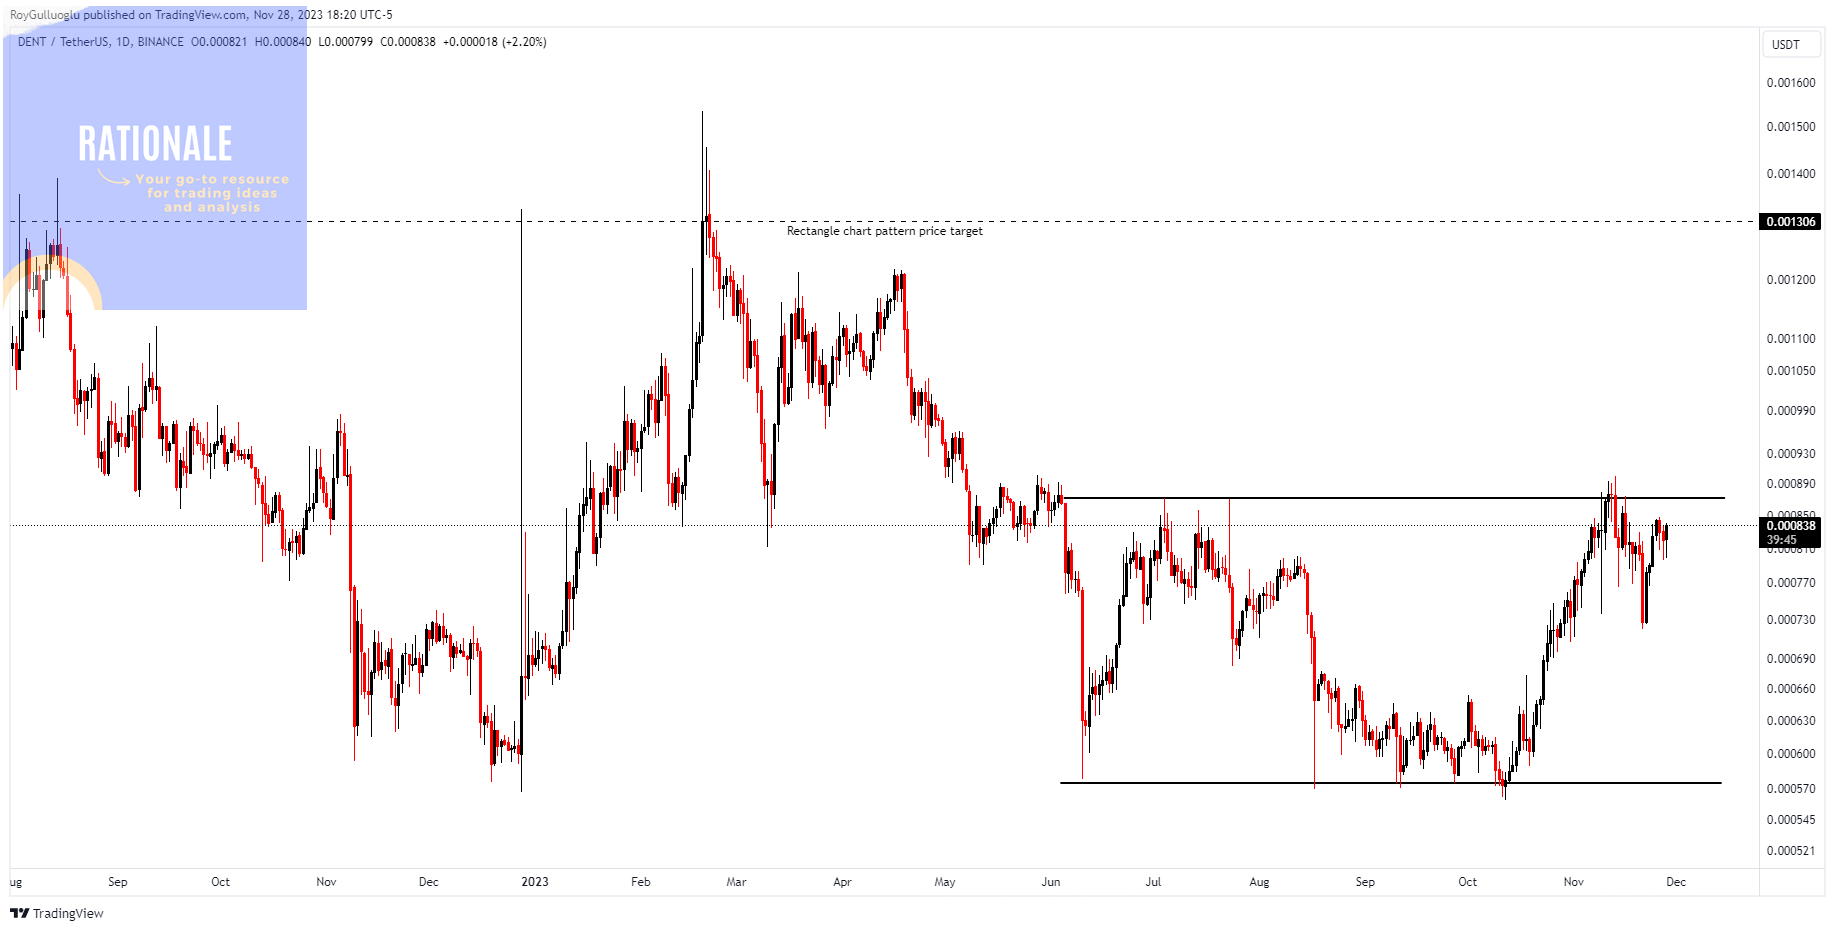
The above daily chart formed an approximately 5-month-long rectangle chart pattern as a bullish reversal after a downtrend.
Within this pattern, the horizontal boundary at 0.00087 levels acts as strong resistance.
A daily close above 0.000896 levels would validate the breakout from the 5-month-long rectangle chart pattern.
The potential price target, based on this chart pattern, is 0.001306 levels.
USDJPY - Short Idea
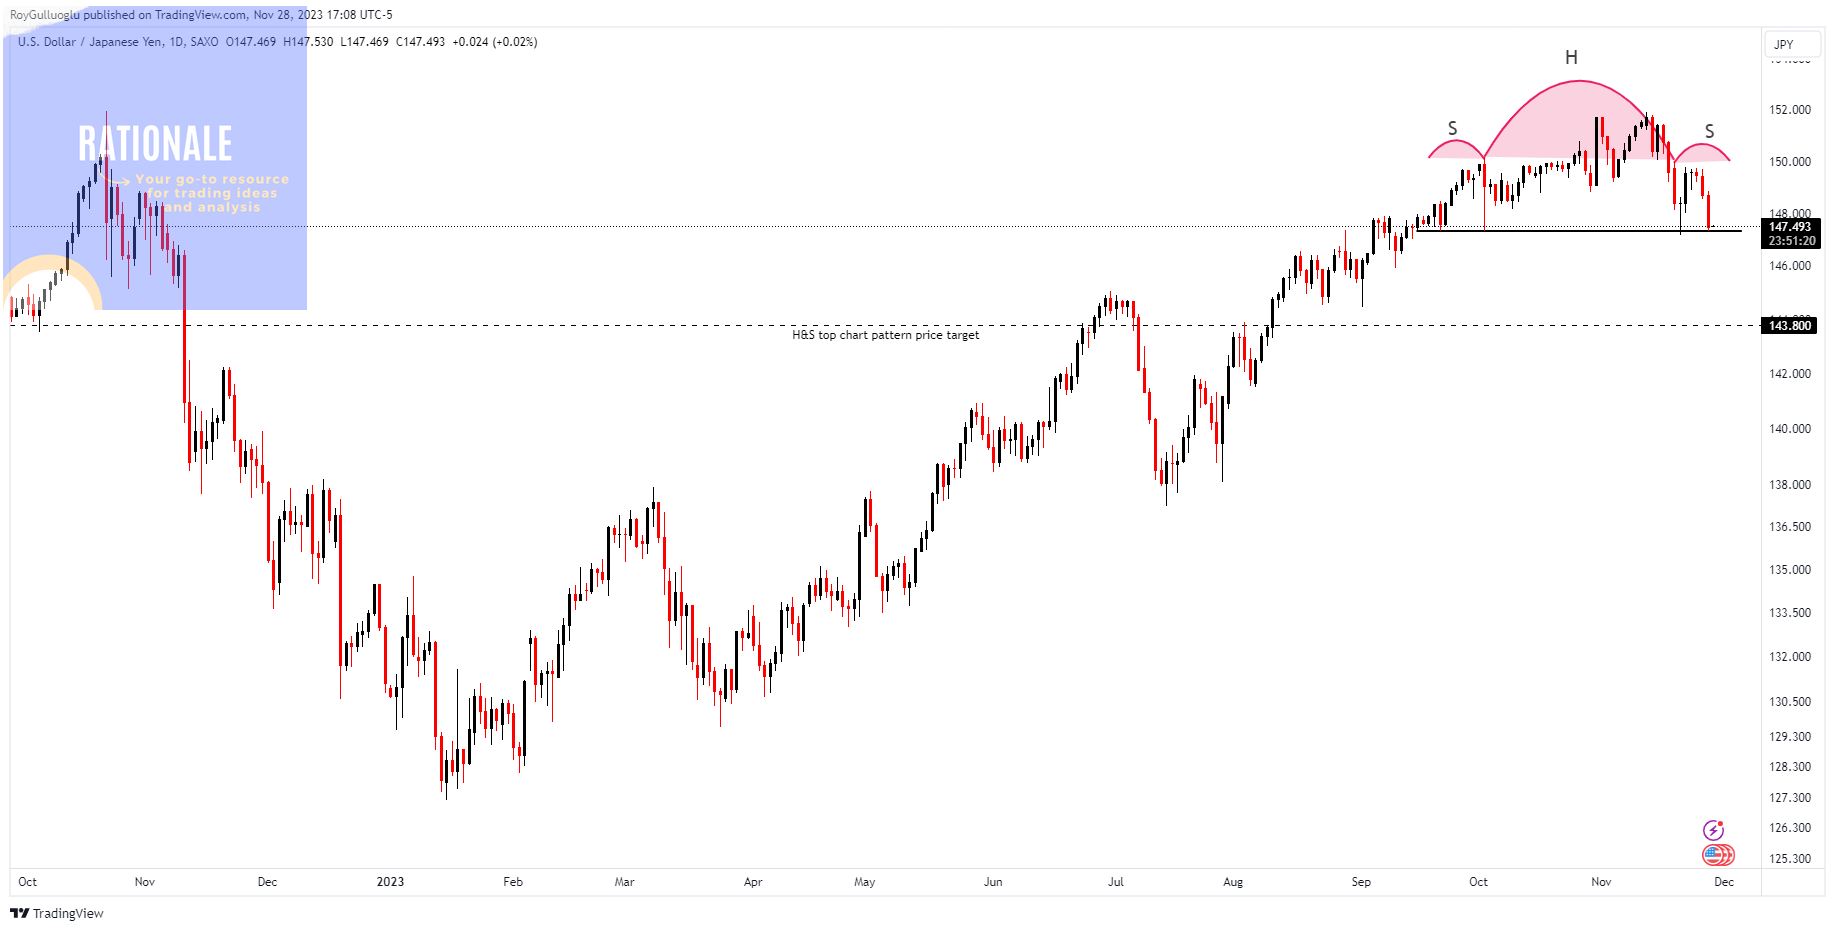
The above weekly chart formed an approximately 2-month-long H&S top chart pattern as a bearish reversal after an uptrend.
Within this pattern, the horizontal boundary at 147.3 levels acts as a support.
A daily close below 146.3 levels would validate the breakout from the 2-month-long H&S top chart pattern.
Based on this chart pattern, the potential price target is 143.8 levels.
A lower-than-expected US home sales and details showing the household's ongoing anticipation of recession over the next year in the CB consumer confidence data supported the decline in USD this week so far.
As we see more data suggesting restrictive Fed policy is having an effect, especially on rate-sensitive sectors like real estate, we might see more reversal plays on USD-denominated pairs.
Potential pricing of the hawkish shift of BoJ (presumably after March 2024) would also be in line with the attached trade idea.
XW1!(Wheat Futures)-Long Idea
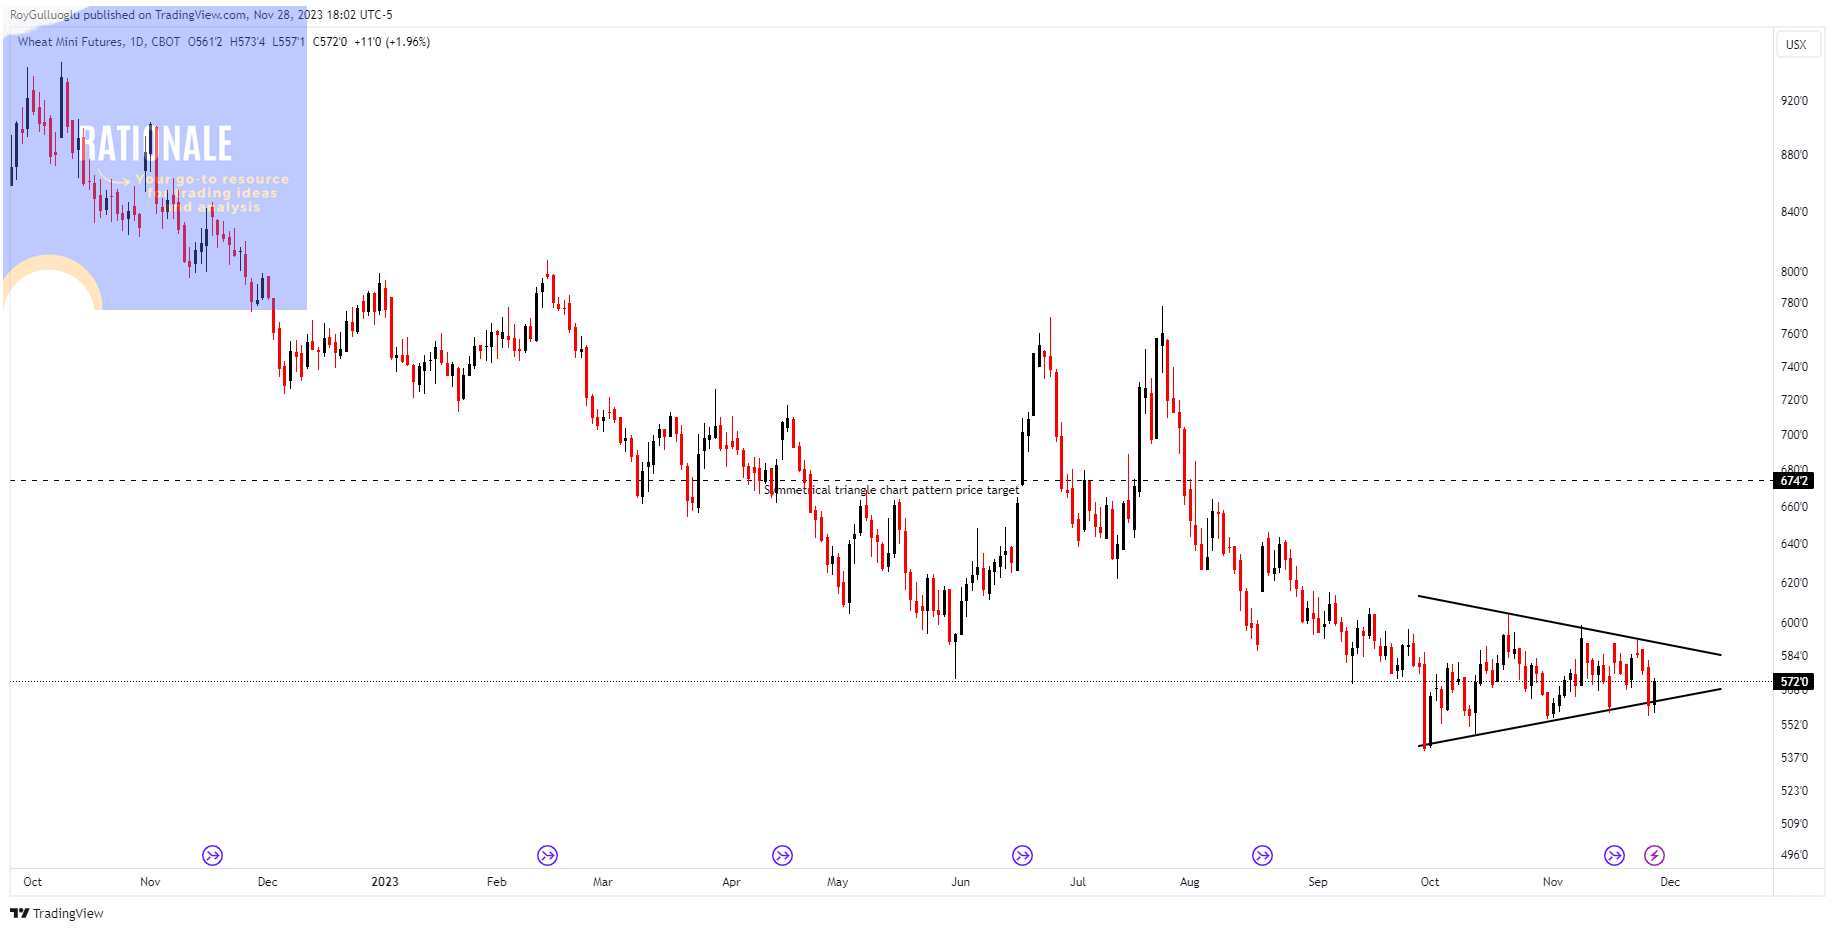
The above daily chart formed an approximately 1.5-month-long symmetrical triangle chart pattern as a bullish reversal after a downtrend.
A daily close above 600 levels would validate the breakout from the 1.5-month-long symmetrical triangle chart pattern.
Based on this chart pattern, the potential price target is 674.2 levels.
Follow-ups
KC1! - Long Idea
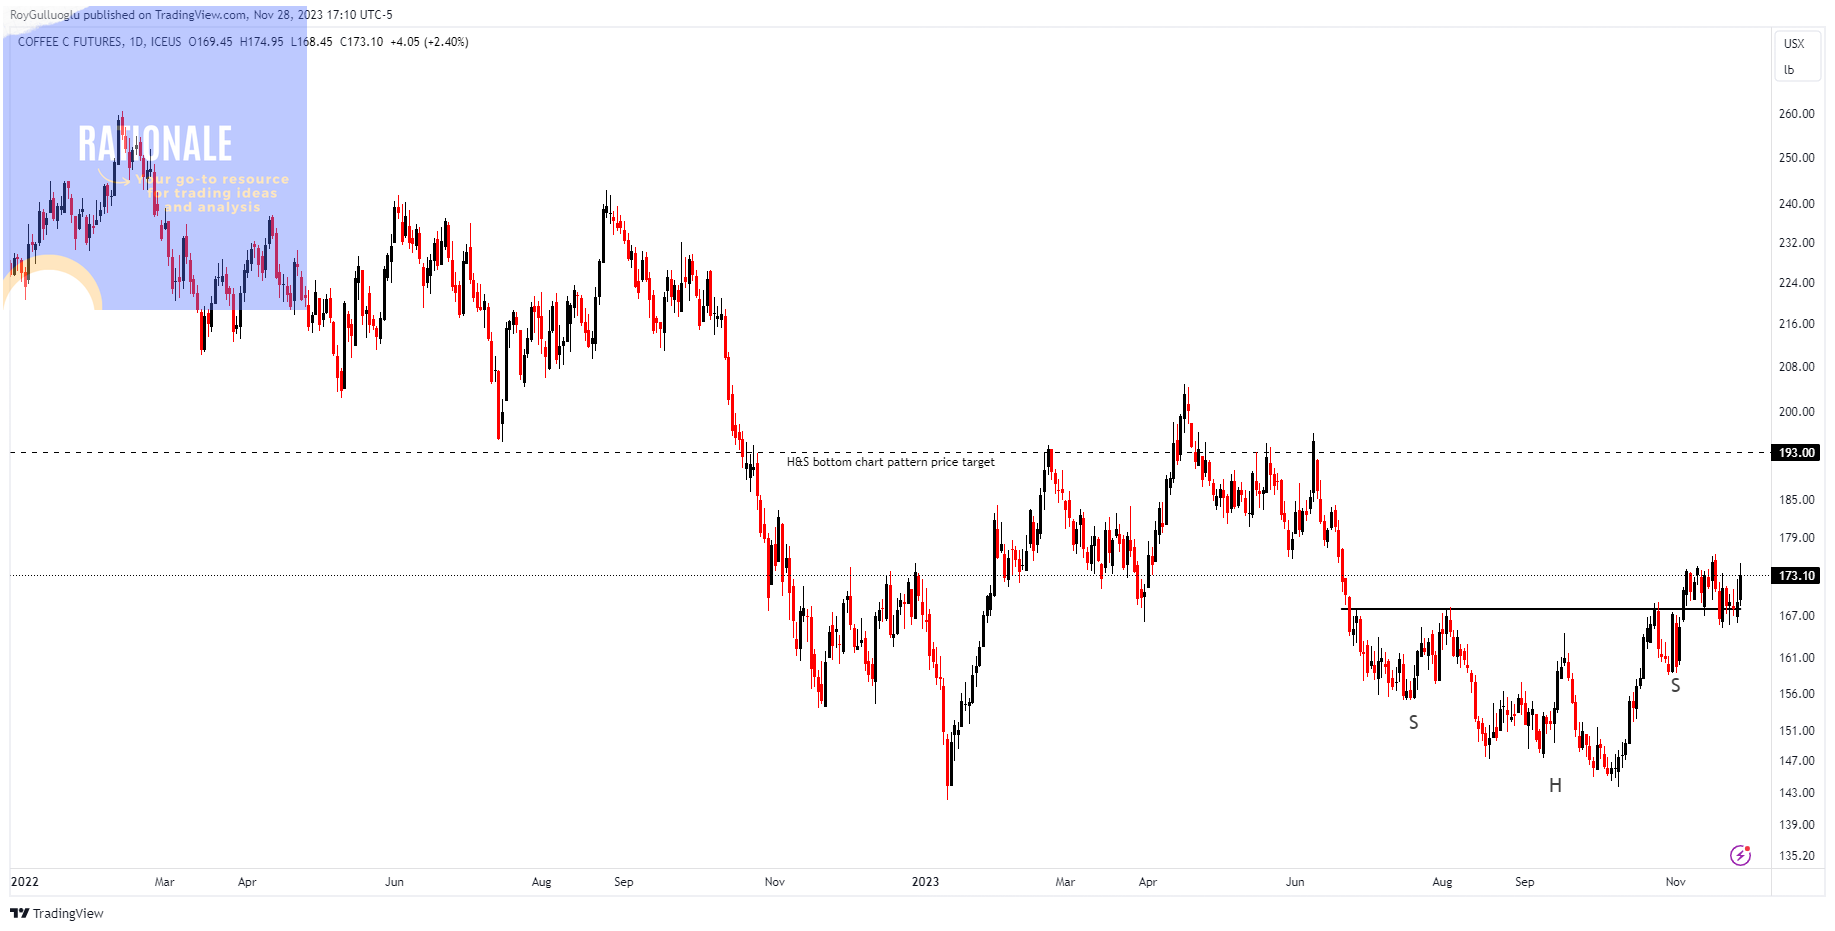
You can click the KC1! ticker above to access the first report explaining the RATIONALE behind the trade idea.
MXNJPY - Long/Short Idea
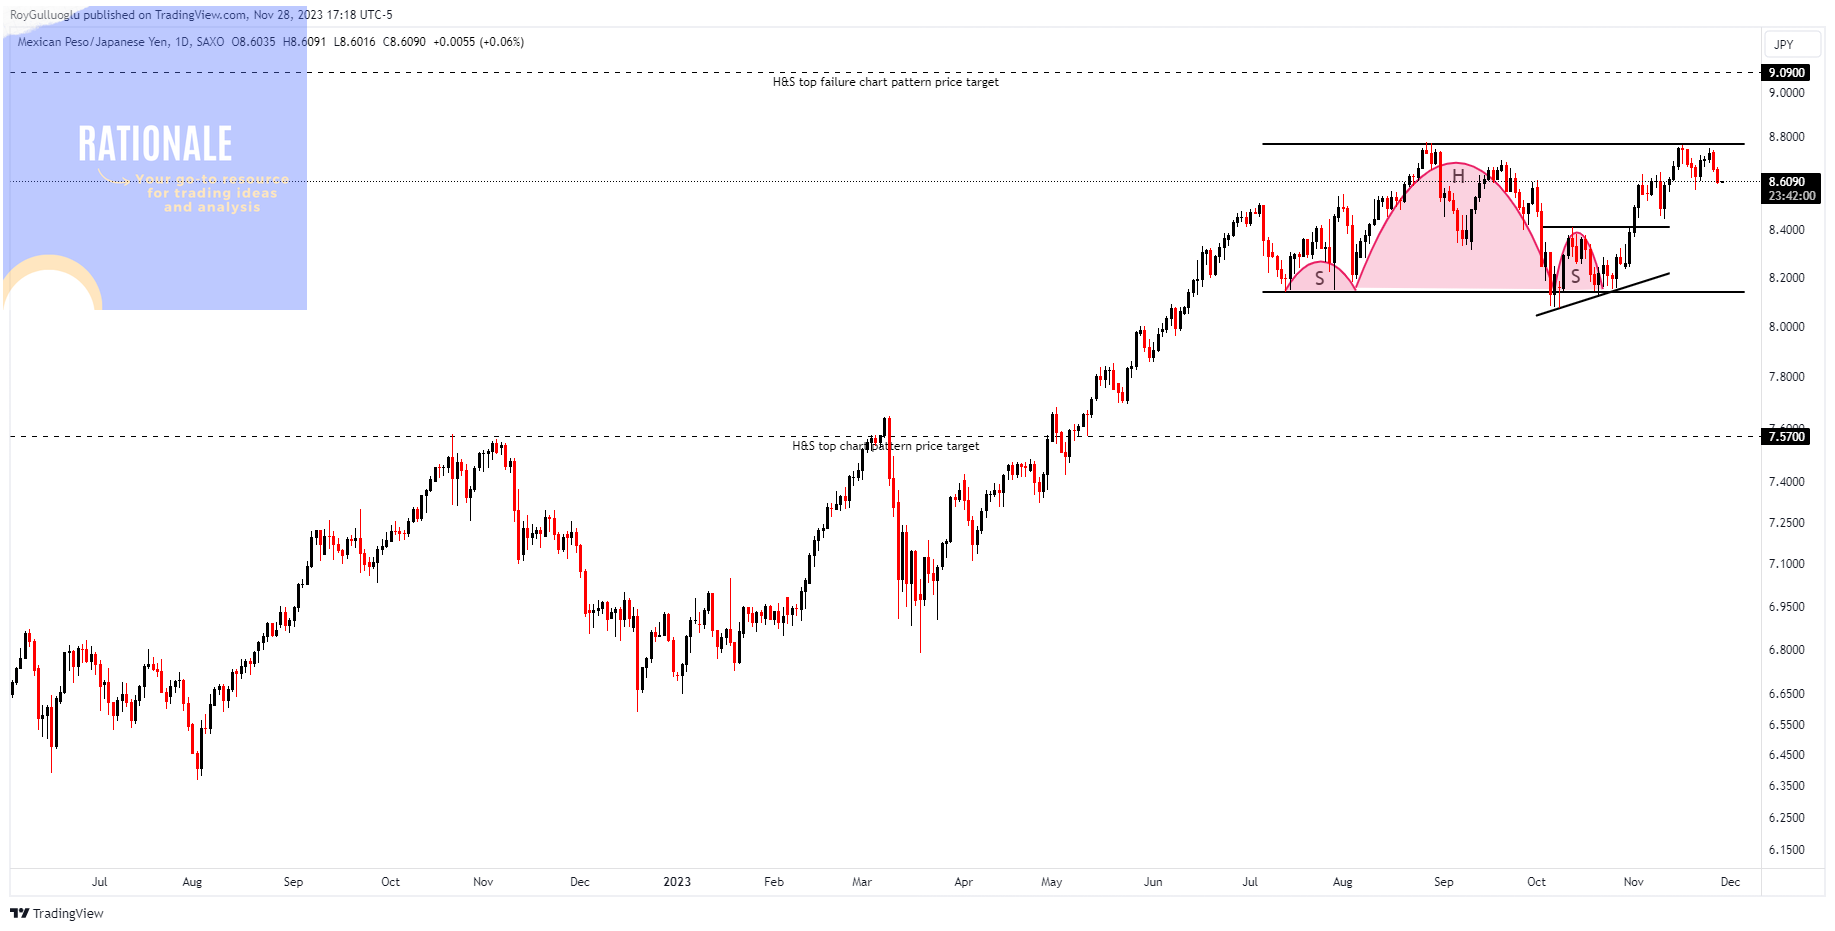
You can click on the MXNJPY ticker above to access the first report explaining the RATIONALE behind the trade idea.
The H&S top failure as a bullish continuation chart pattern is in action.
Within this pattern, the horizontal boundary at 8.4 levels acted as strong support.
A daily close above 8.48 levels validated the breakout from the 3-month-long H&S top chart pattern.
The potential price target, based on this chart pattern, is 9.09 levels.