

New setups
XAUUSD-Long Idea
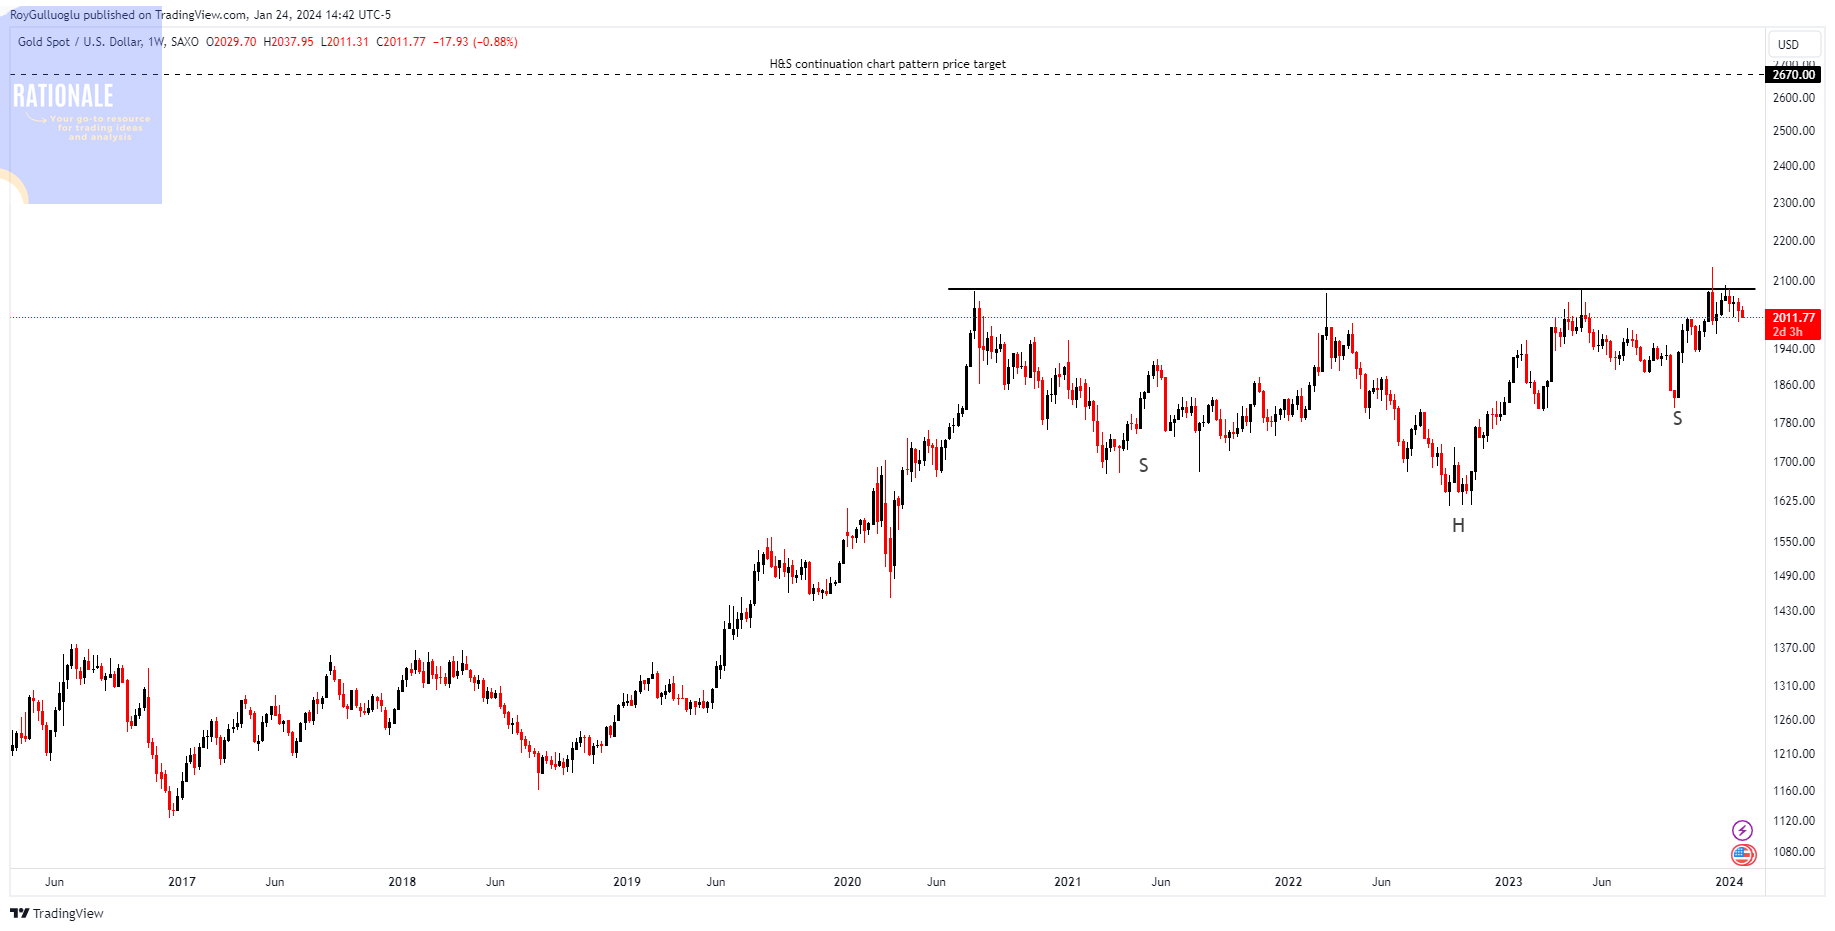
The above weekly chart formed an approximately 45-month-long H&S continuation chart pattern.
Within this pattern, the horizontal boundary at 2080 levels acts as a resistance.
A daily close above 2140 levels would validate the breakout from the 45-month-long H&S continuation chart pattern.
Based on this chart pattern, the potential price target is 2670 levels.
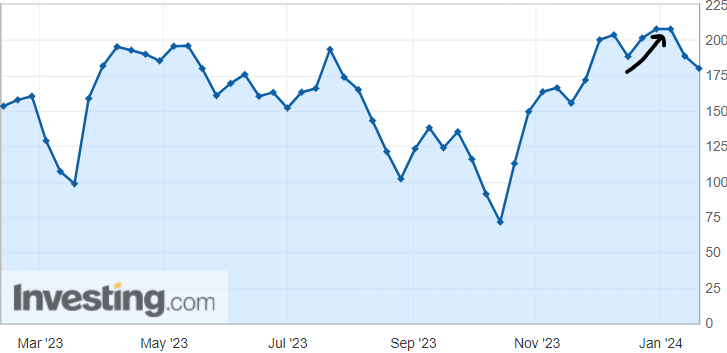
CFTC Gold speculative net positions:

As you can see in the above cftc gold non-commercial net positions chart, the arrow shows the uptrend of the speculative positioning starting from October 2023 which supports the recent strength of the gold.
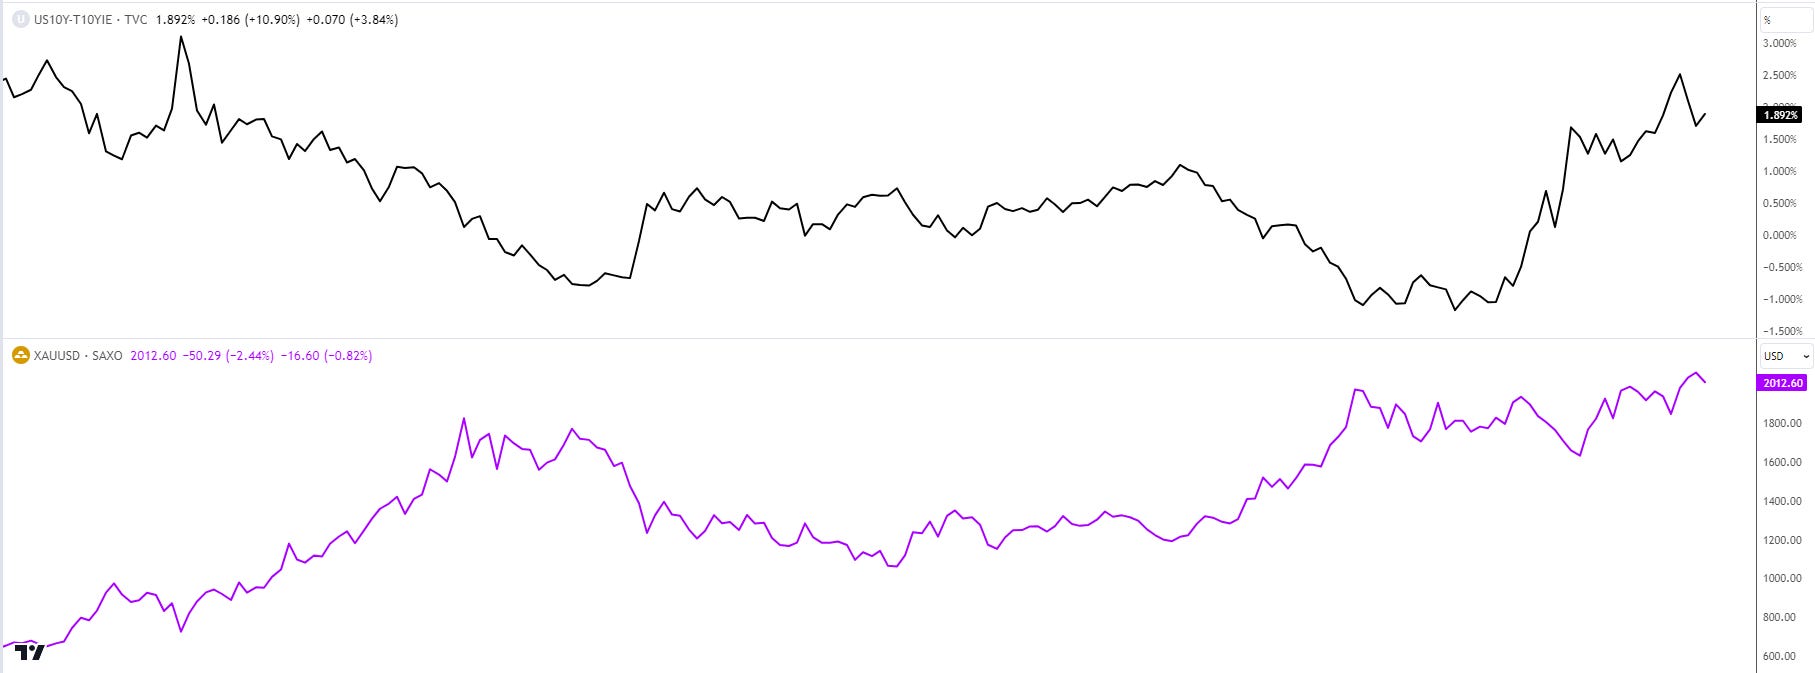
Another important indicator of gold is real rates which are calculated by subtracting 10Y breakevens from the 10Y nominal yields.
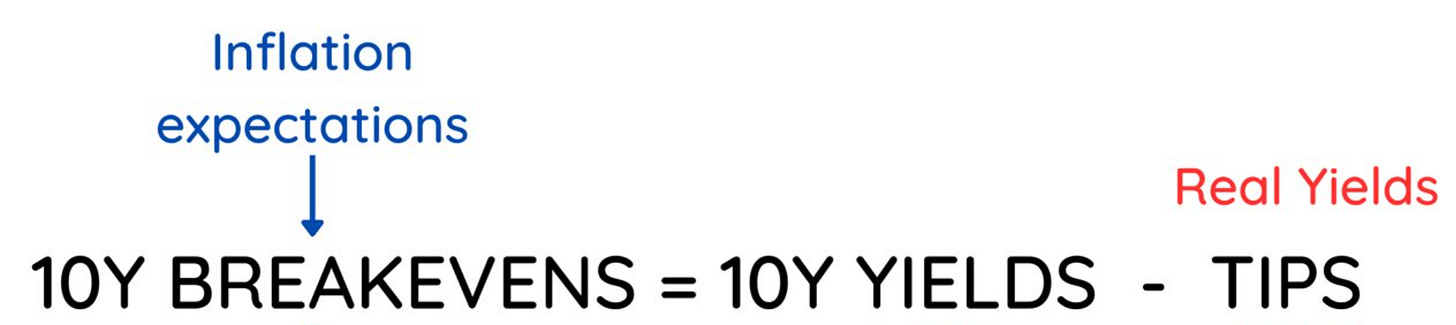
Please click on the picture and visit the associated link to reach the tweet that I have covered the relationship between 10Y breakevens and inflation expectations Any decline in the real rates would push investors to seek alternative investment tools and the ones looking for a safe bet like treasuries would prefer gold due to its characteristics of being a risk-off bet.
Considering the upcoming agenda of central banks we would expect the rates to come lower as well as the inflation expectations as a result of the tightening policies. You can see the adverse relationship between real rates and gold in the chart below.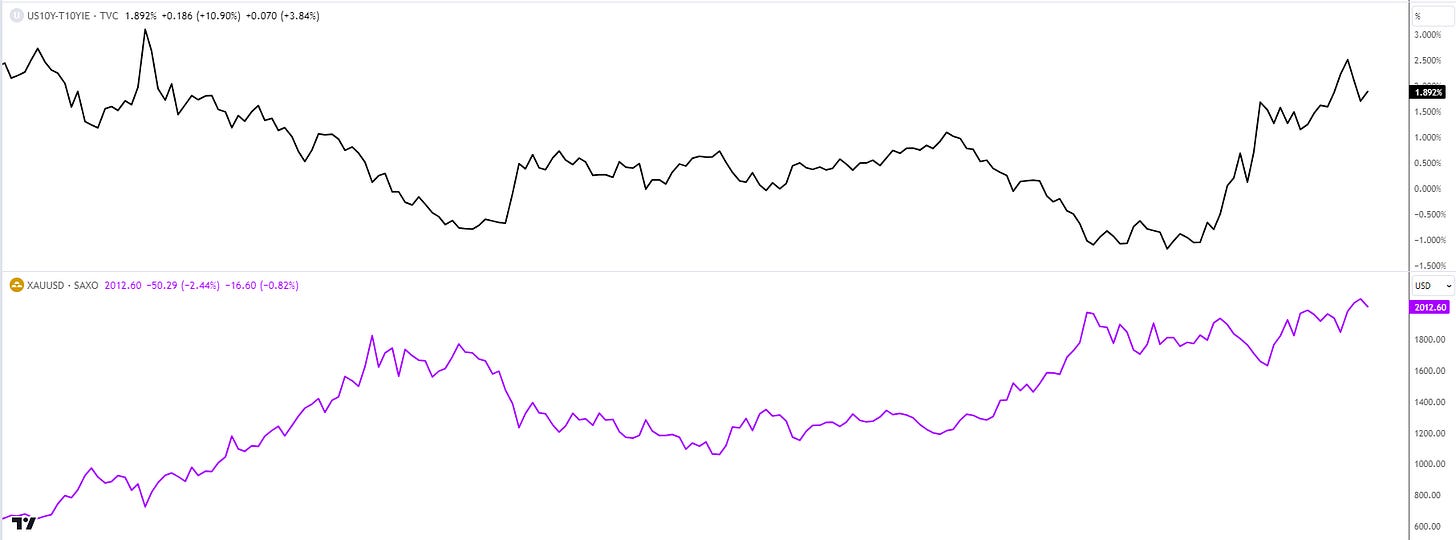
How do real yields fall?
Recession prospects drive 10y bonds (risk-off pricing), yield falls. If the FED controls inflation, the second leg, inflation expectations, remains stable or falls. The important issue here is that the 1st leg of the equation (10y yield) falls more than the 2nd leg (inf exp). To see lower real rates, the distortion on the growth side should be higher than the progress on the inflation side. Considering recent inflation data which partially pushed the first rate cut expectations from March to May, we might expect this scenario to become real.The last point that I want to emphasize is the SPDR Gold Trust ETF [GLD] Net Flows :
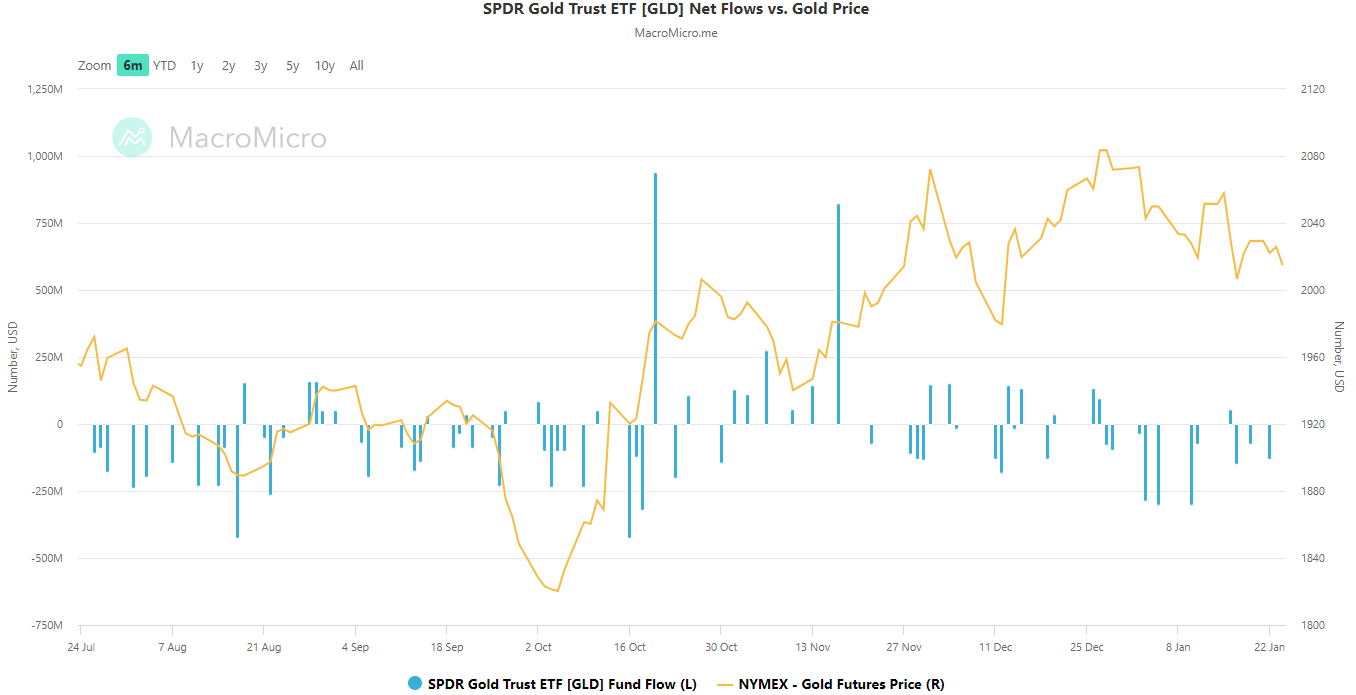
The net negative flow that occurred in early January was high and has been on a declining trend. As the net inflows into Gold ETFs become positive, we anticipate a positive trend in spot gold prices.


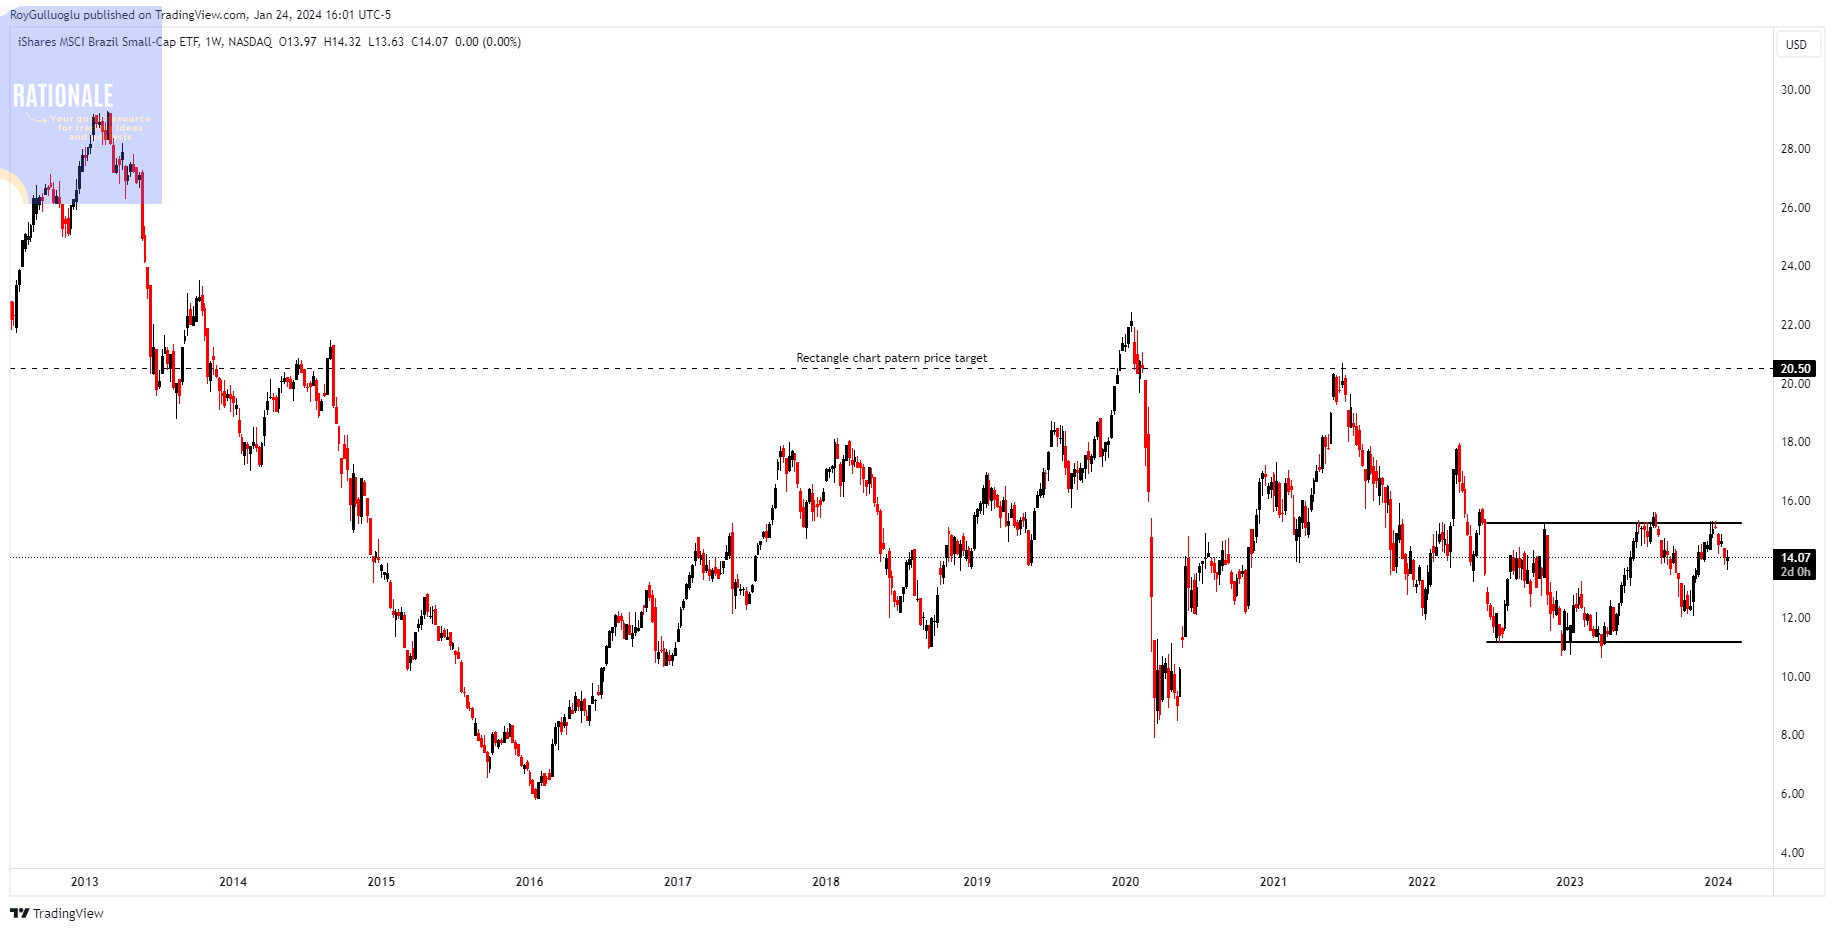
iShares MSCI Brazil Small Cap ETF-(EWZS/ARCA)-Long Idea
EWZS is essentially a bet on the sectors that dominate the Brazilian small-cap market. That being said, it still invests in a variety of different sectors, giving it a broader classification.
The above daily chart formed an approximately 3-month-long rectangle chart pattern as a bullish reversal after a downtrend.
Within this pattern, the horizontal boundary at 15.21 levels acts as a resistance.
A daily close above 15.66 levels would validate the breakout from the 3-month-long rectangle chart pattern.
Based on this chart pattern, the potential price target is 20.5 levels.
Top 10 holdings

GBPUSD-Long Idea
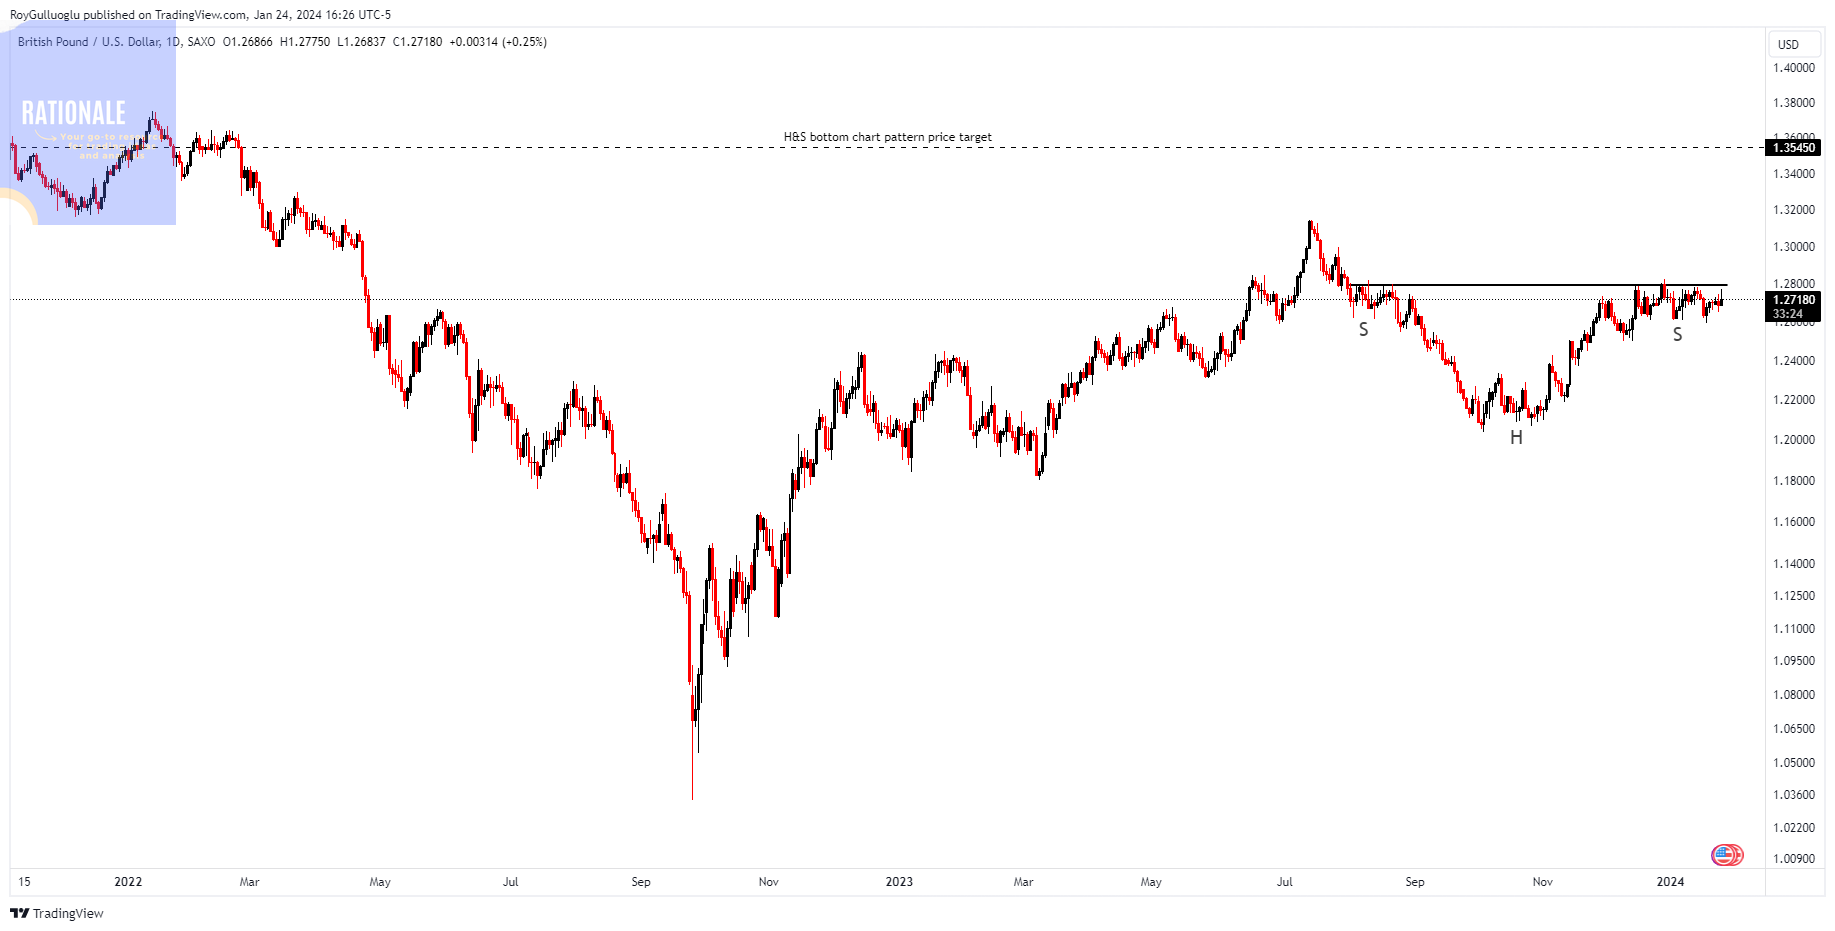
The above daily chart formed an approximately 4-month-long H&S bottom chart pattern.
Within this pattern, the horizontal boundary at 1.2795 levels acts as a resistance.
A daily close above 1.292 levels would validate the breakout from the 2-month-long ascending triangle chart pattern.
Based on this chart pattern, the potential price target is 1.3545 levels.
The most important risk of this trade idea is the weakness in consumer confidence following a retail sales miss has the potential to worsen recession risks. This might put pressure on BoE and make them move faster on rate cuts than peers. That would would support the bearish scenario for the GBP.
Follow-ups
ETHUSDT- Long Idea
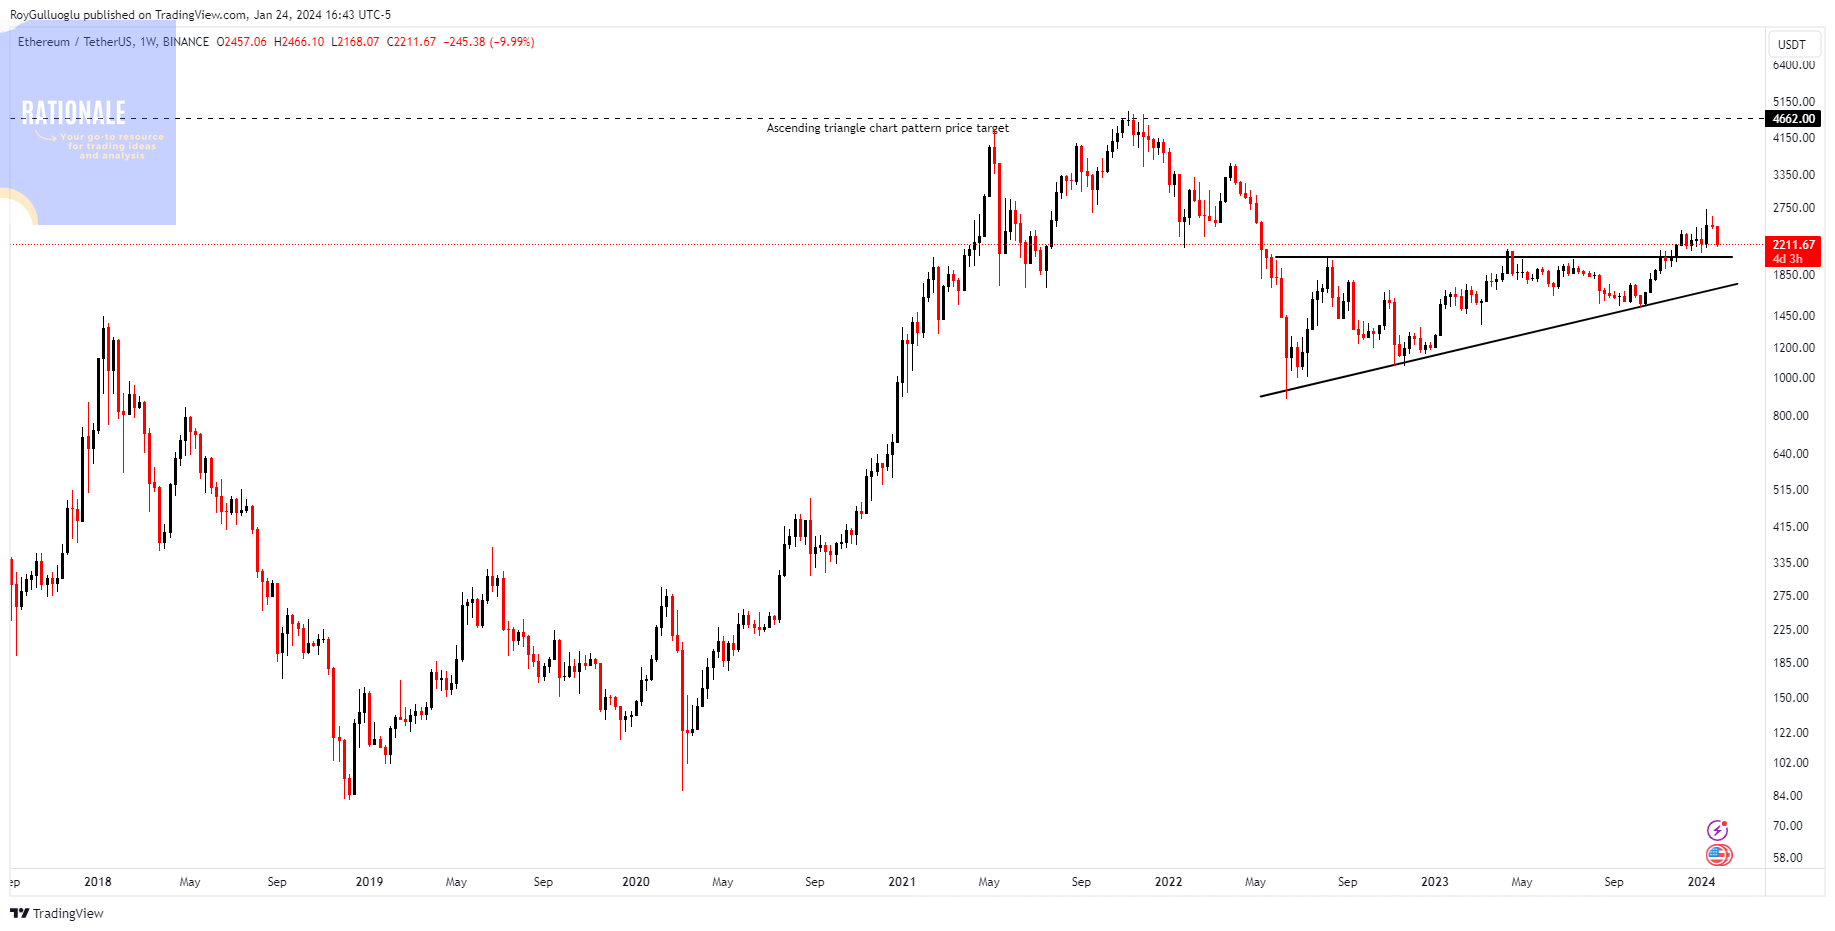
You can click the ETHUSDT ticker above to access the first report explaining the RATIONALE behind the trade idea.
The price pulled back to the resistance level of the chart pattern and resumed its movement.