

Trade Ideas Fx-Futures-Etf-Crypto
XU0301!(BIST), GBPCHF, EURJPY, QQQ(NASDAQ)

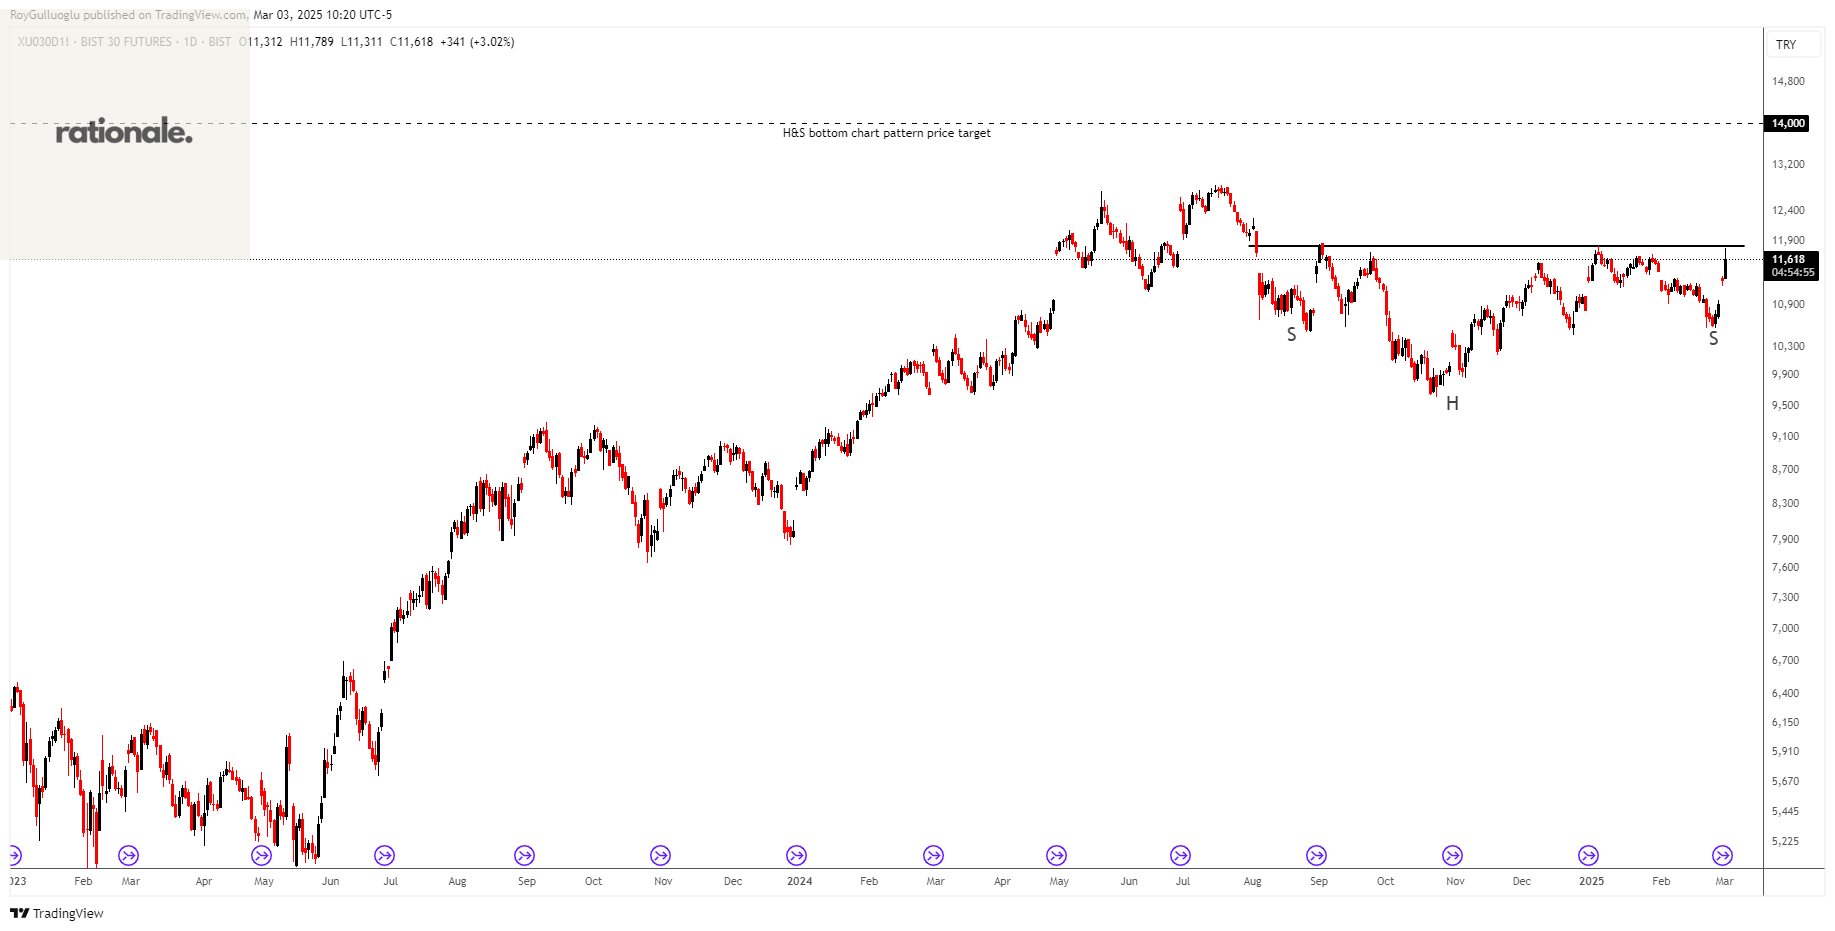
XU0301!(BIST 30 Futures)-Long Idea
The iShares 1-3 Year Treasury Bond ETF seeks to track the investment results of an index composed of U.S. Treasury bonds with remaining maturities between one and three years.
The above daily chart formed an approximately 5-month-long H&S bottom chart pattern as a bullish reversal after a downtrend.
The horizontal boundary at 11826 levels acts as a resistance within this pattern.
A daily close above 12180 levels would validate the breakdown from the 5-month-long H&S bottom chart pattern.
Based on this chart pattern, the potential price target is approximately 14000 levels.
GBPCHF-Long Idea
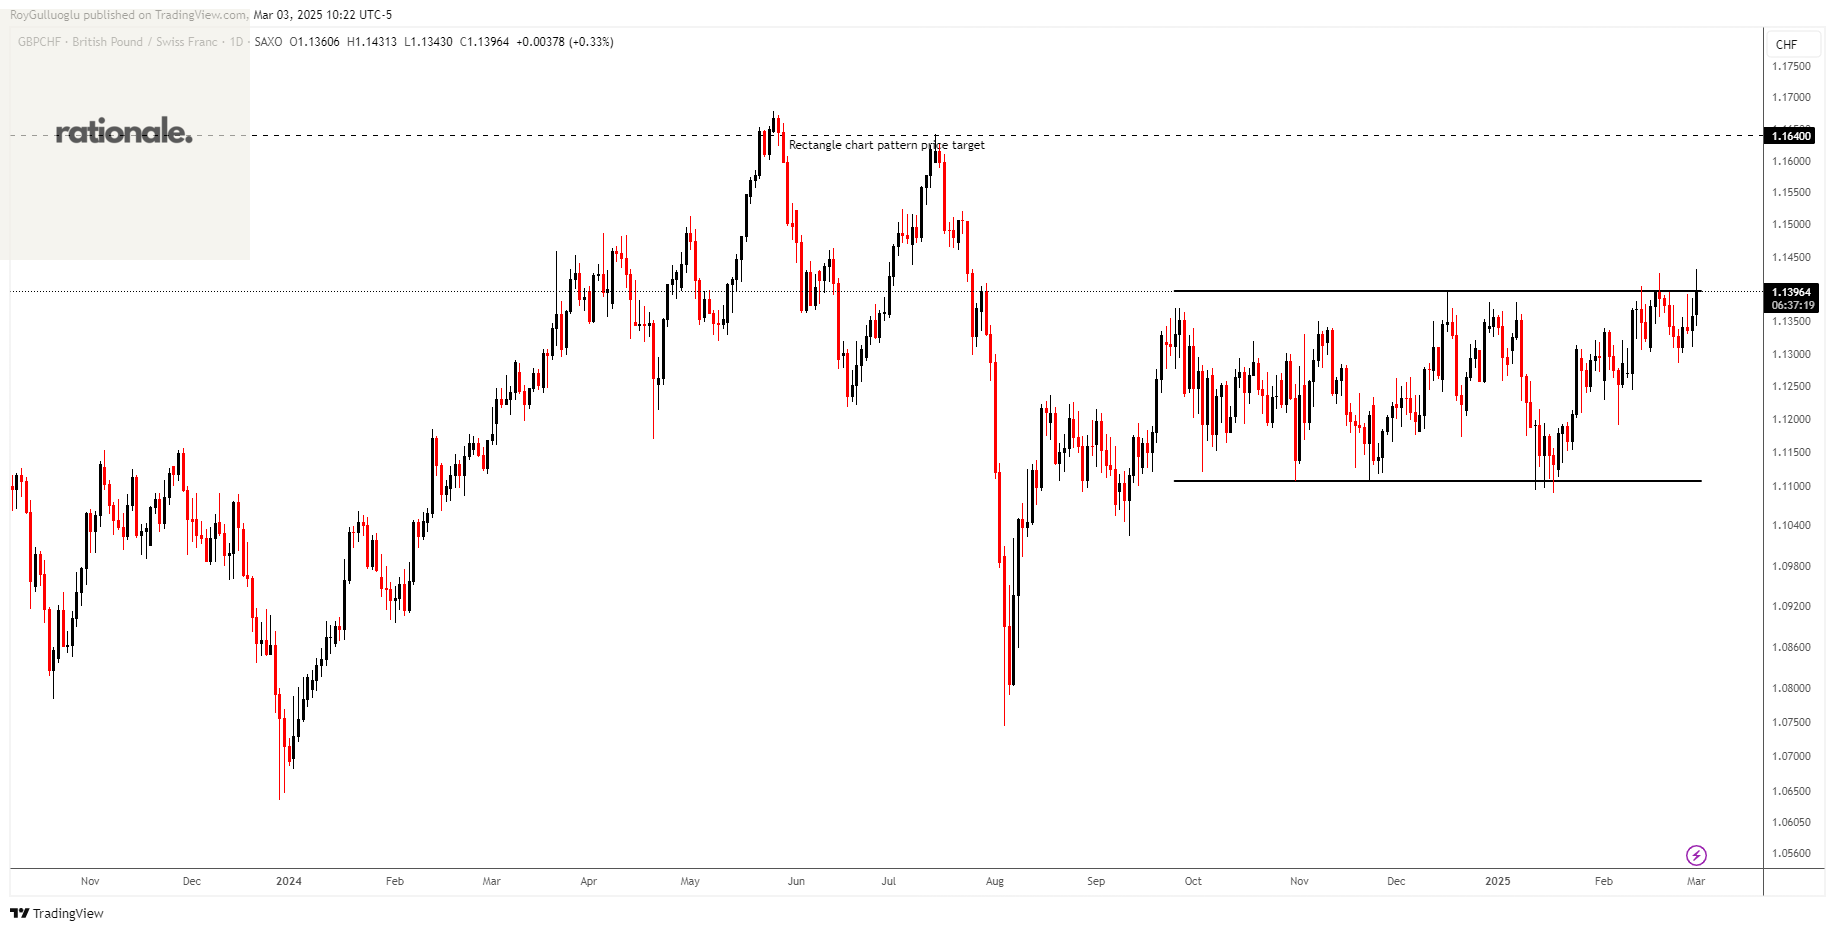
GBP Gains Momentum: The Bank of England's February monetary policy report raised its inflation forecast, boosting the strength of the GBP. With persistent inflation risks, it’s reasonable to anticipate sustained higher interest rates.
The above daily chart formed an approximately 4-month-long rectangle chart pattern as a bullish continuation after an uptrend.
The horizontal boundary at 1.1396 levels acts as a resistance within this pattern.
A daily close above 1.145 (ATR(10/30)/2+boundary) levels would validate the breakdown from the 4-month-long rectangle chart pattern.
Based on this chart pattern, the potential price target is approximately 1.1640 levels.
EURJPY-Short Idea
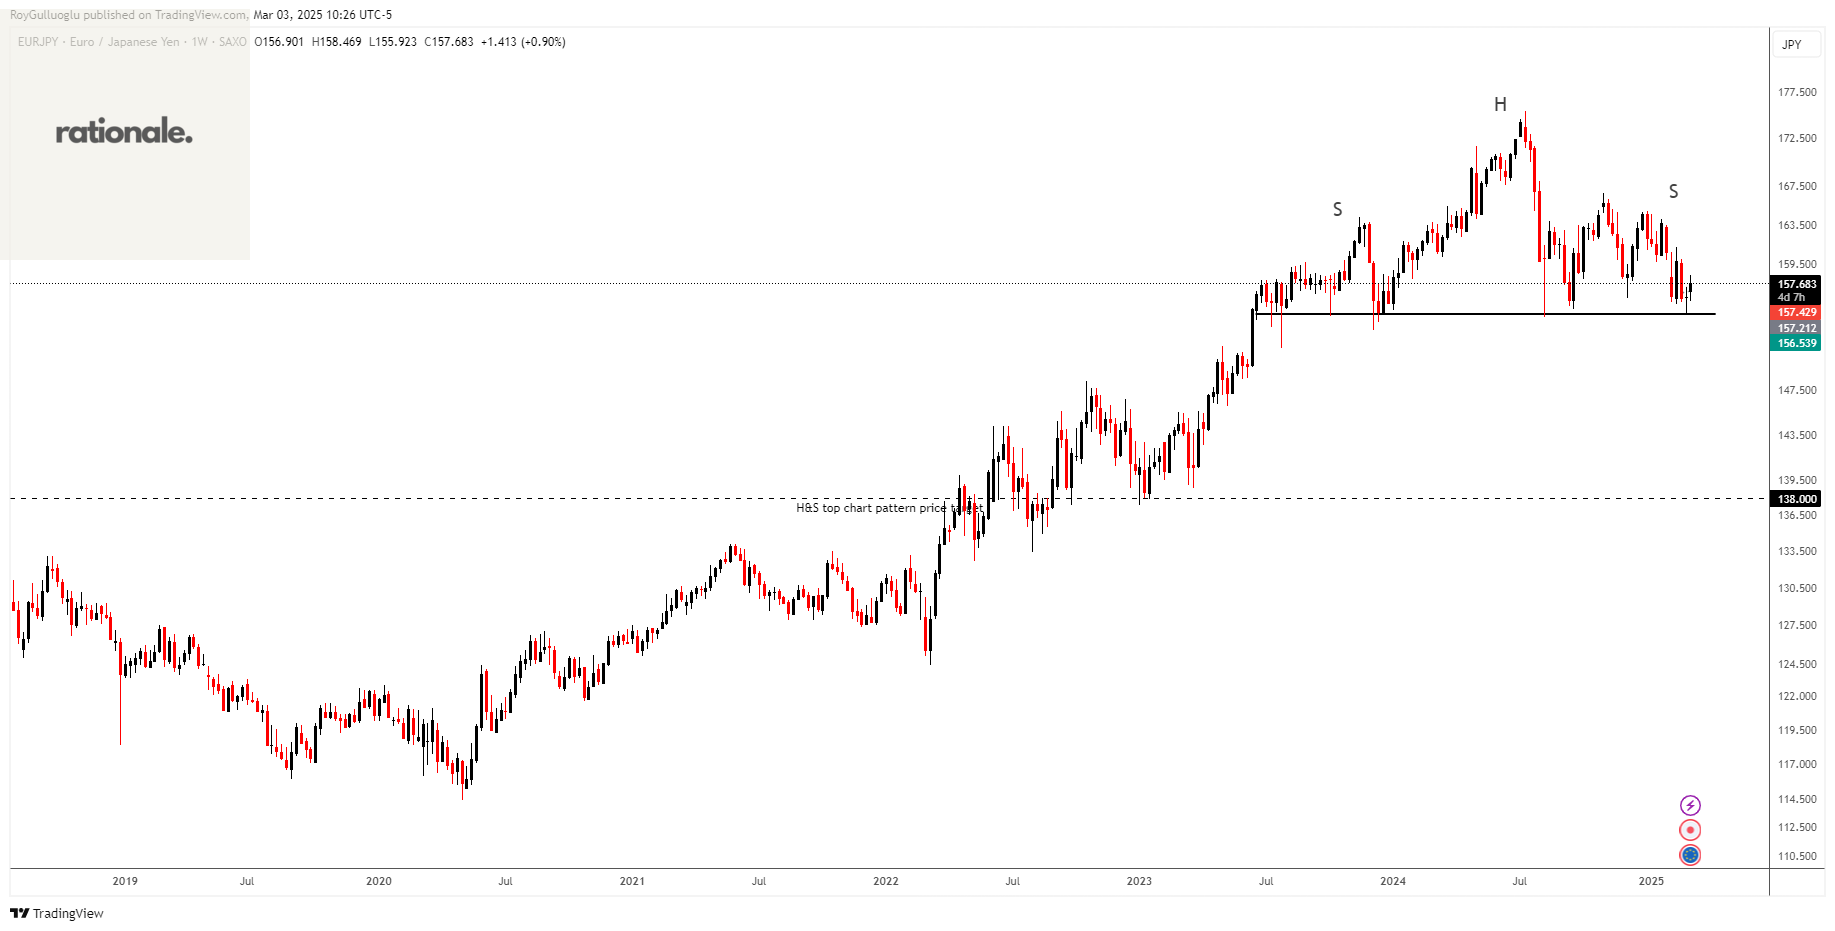
The above weekly chart formed an approximately 20-month-long H&S top chart pattern as a bearish reversal after an uptrend.
The horizontal boundary at 154.7 levels acts as a support within this pattern.
A daily close below 153.15 levels would validate the breakdown from the 20-month-long H&S top chart pattern.
Based on this chart pattern, the potential price target is approximately 138 levels.
Invesco QQQ Trust-(QQQ/NASDAQ)-Long/Short Idea
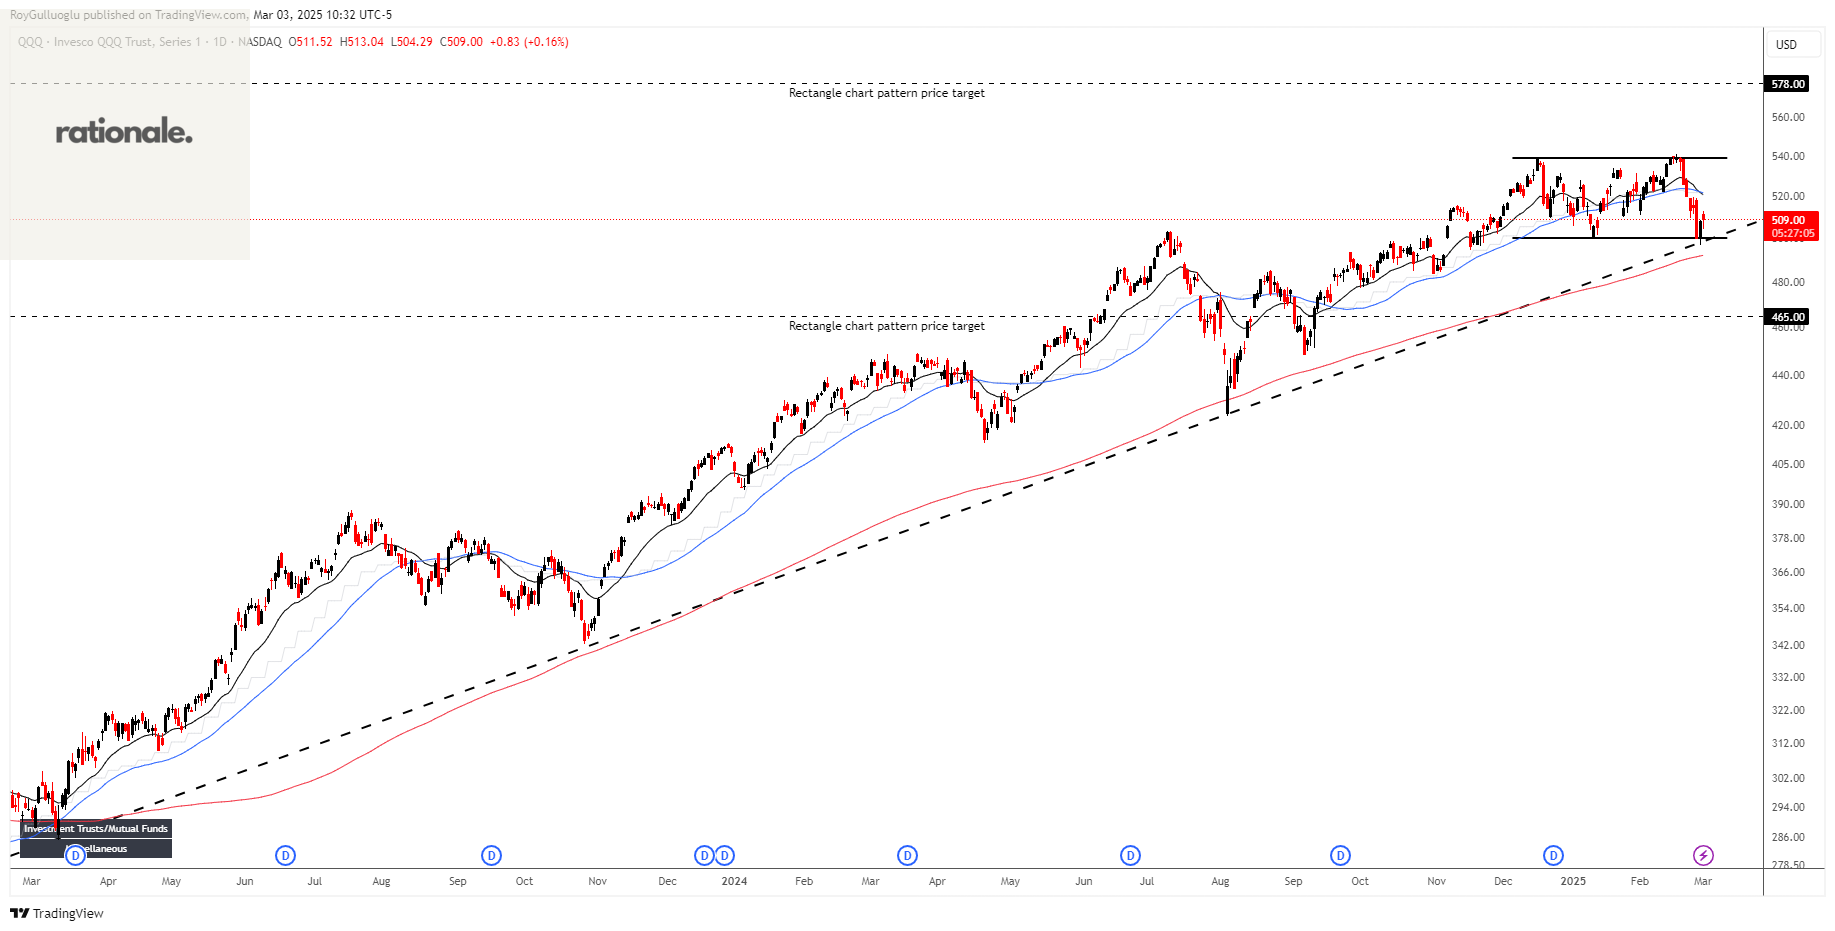
As long as the price holds above the 200-day moving average, I lean toward a bullish scenario. Additionally, the trendline that began in October 2022 serves as another support level, helping the price remain steady. Just as a reminder, October 2022 was around the time Jerome Powell acknowledged that inflation was not "transitory." It also marked a key market dip, making this trend the primary one to watch closely.
The above daily chart formed an approximately 2-month-long rectangle chart pattern as a bearish reversal or bullish continuation after an uptrend.
The horizontal boundary at 500 levels acts as a support within this pattern while 539 levels act as a resistance.
A daily close below 495 levels would validate the breakdown and a daily close above 544 would validate the breakout from the 2-month-long rectangle chart pattern.
Based on the chart patterns, the potential price targets are 465 and 578 levels respectively.