New setups
iShares Russell 2000 ETF-(IWM/ARCA)-Long Idea
IWM tracks a market-cap-weighted index of US small-cap stocks. The index selects stocks ranked 1,001-3,000 by market cap.
The above weekly chart formed an approximately 20-month-long rectangle chart pattern as a bullish reversal after a downtrend.
Within this pattern, the horizontal boundary at 198.75 levels acts as a resistance.
A daily close above 204.7 levels would validate the breakout from the 20-month-long rectangle chart pattern.
Based on this chart pattern, the potential price target is 242 levels.
Invesco S&P 500 Equal Weight ETF-(RSP/ARCA)-Long Idea
RSP follows an index that equally weights S&P 500 companies, making it one of the most recognized equal-weighted ETFs. The approach involves assigning equal importance to all stocks in the S&P 500, leading to a notable impact on smaller stocks, often considered midcaps, and consequently, a higher beta for the portfolio.
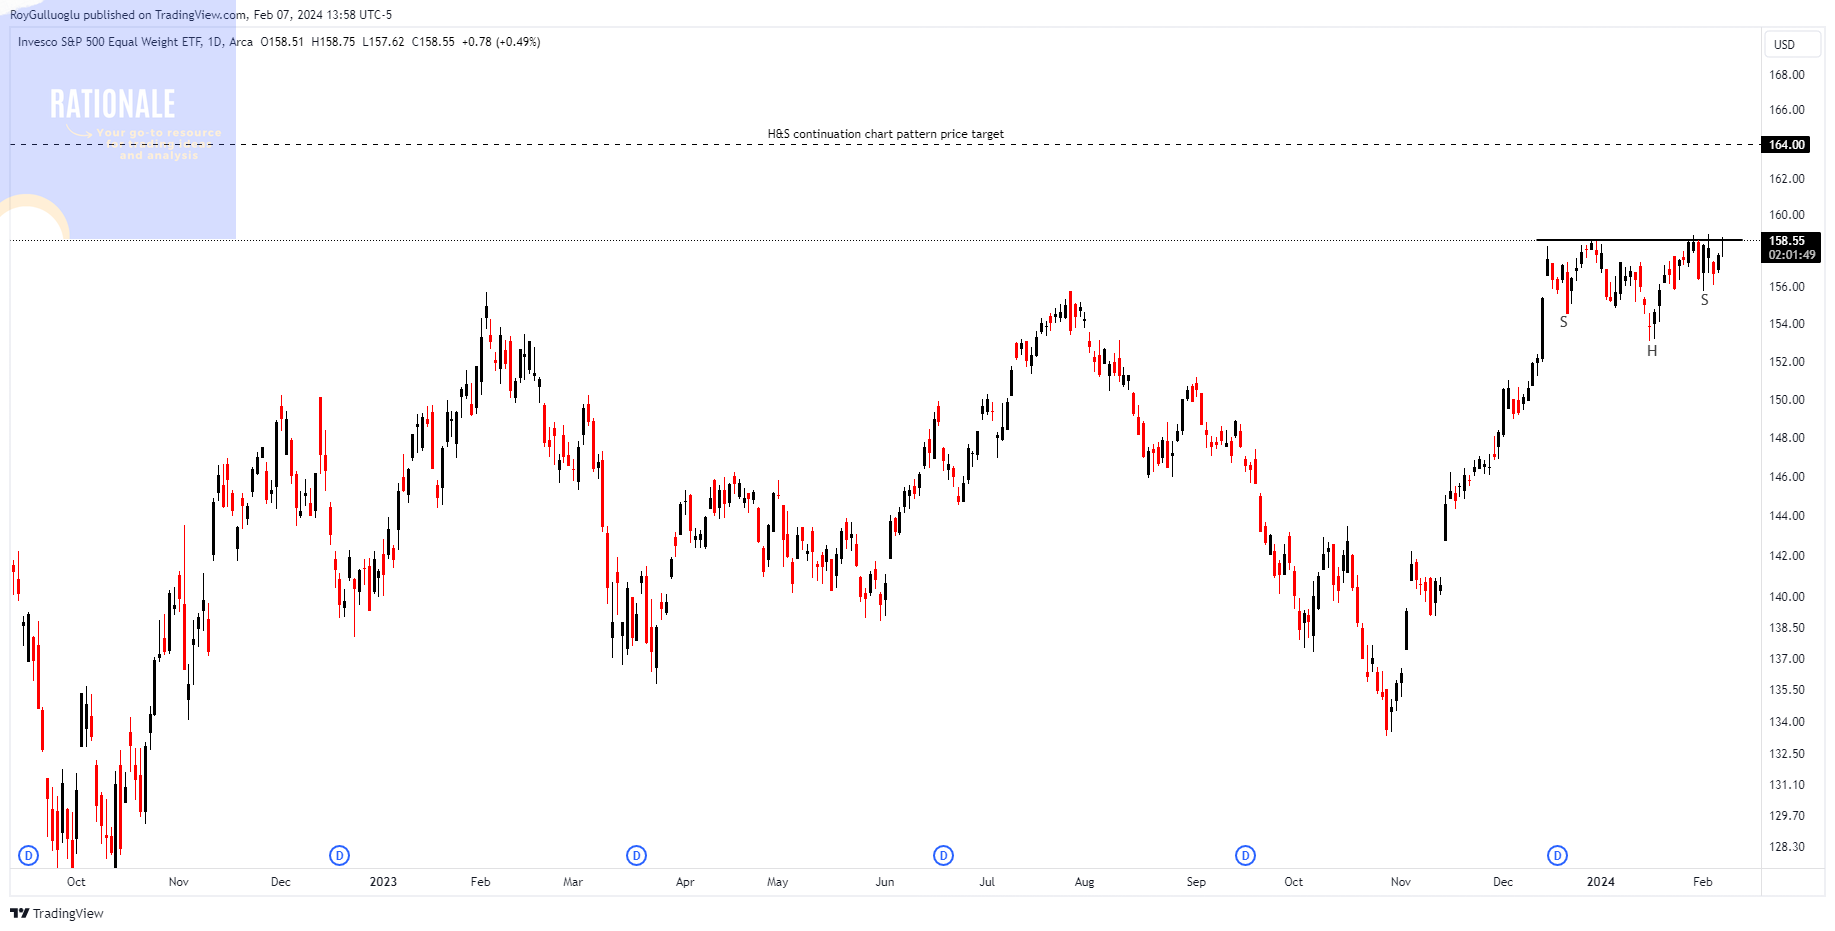
The above daily chart formed an approximately 2-month-long H&S continuation chart pattern as a bullish continuation after an uptrend.
Within this pattern, the horizontal boundary at 158.6 levels acts as a resistance.
A daily close above 160 levels would validate the breakout from the 2-month-long H&S continuation chart pattern.
Based on this chart pattern, the potential price target is 164 levels.
Top 10 holdings
USDPLN-Long Idea
The above daily chart formed an approximately 2-month-long H&S bottom chart pattern.
Within this pattern, the horizontal boundary at 4.04 levels acts as a resistance.
A daily close above 4.08 levels would validate the breakout from the 2-month-long H&S bottom chart pattern.
Based on this chart pattern, the potential price target is 4.2 levels.
The Polish Central Bank recently kept interest rates unchanged citing the long-term uncertainty in the inflation. The short-term inflation is expected to fall significantly in the first quarter.
If the market expectations converge to the FED`s expectation of three rate cuts in 2024, we would likely see a firmer USD against Euro area currencies.
The real debate is not whether the Fed will cut rates in March(Unlikely), but rather, it should focus on whether the cut will be less or more compared to the rest of the world.
FTMUSDT-Long Idea
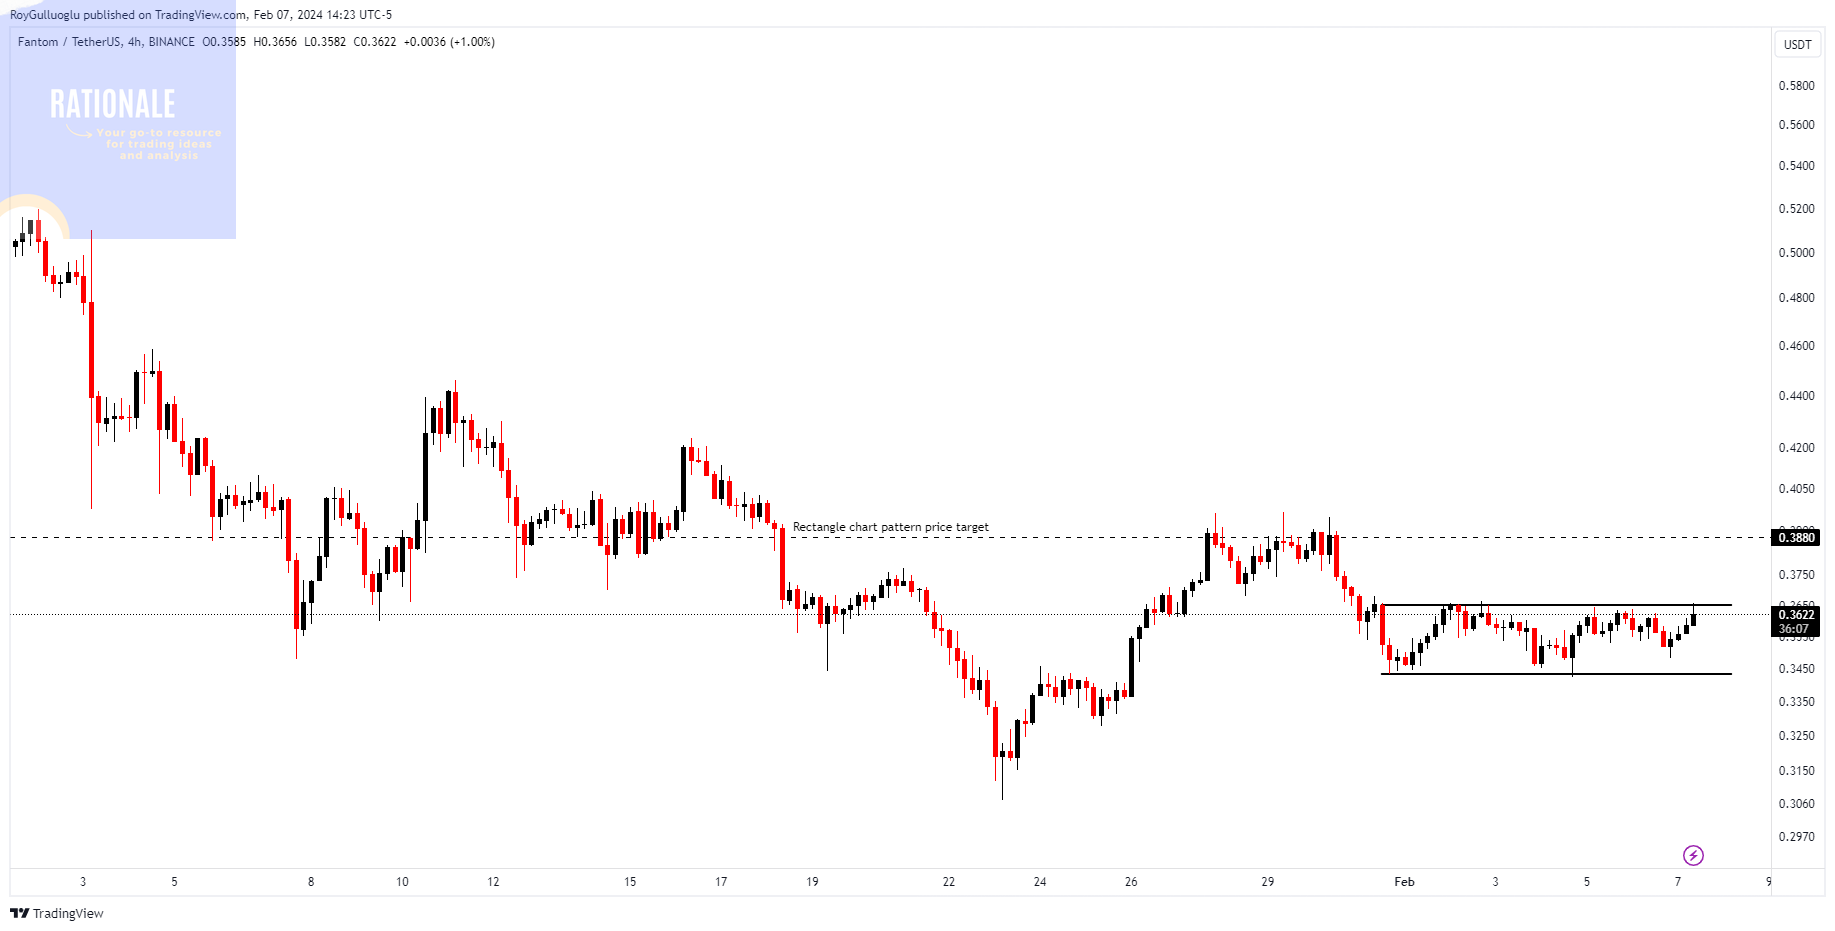
The above 4-hour chart formed a rectangle chart pattern as a bullish reversal after a downtrend.
The horizontal boundary at 0.365 levels acts as a resistance within this pattern.
A 4-hour bar close above 0.369(Resistance + ATR/2) levels would validate the breakout from the rectangle chart pattern.
Based on this chart pattern, the potential price target is 0.3880 levels.
MATICUSDT-Long Idea
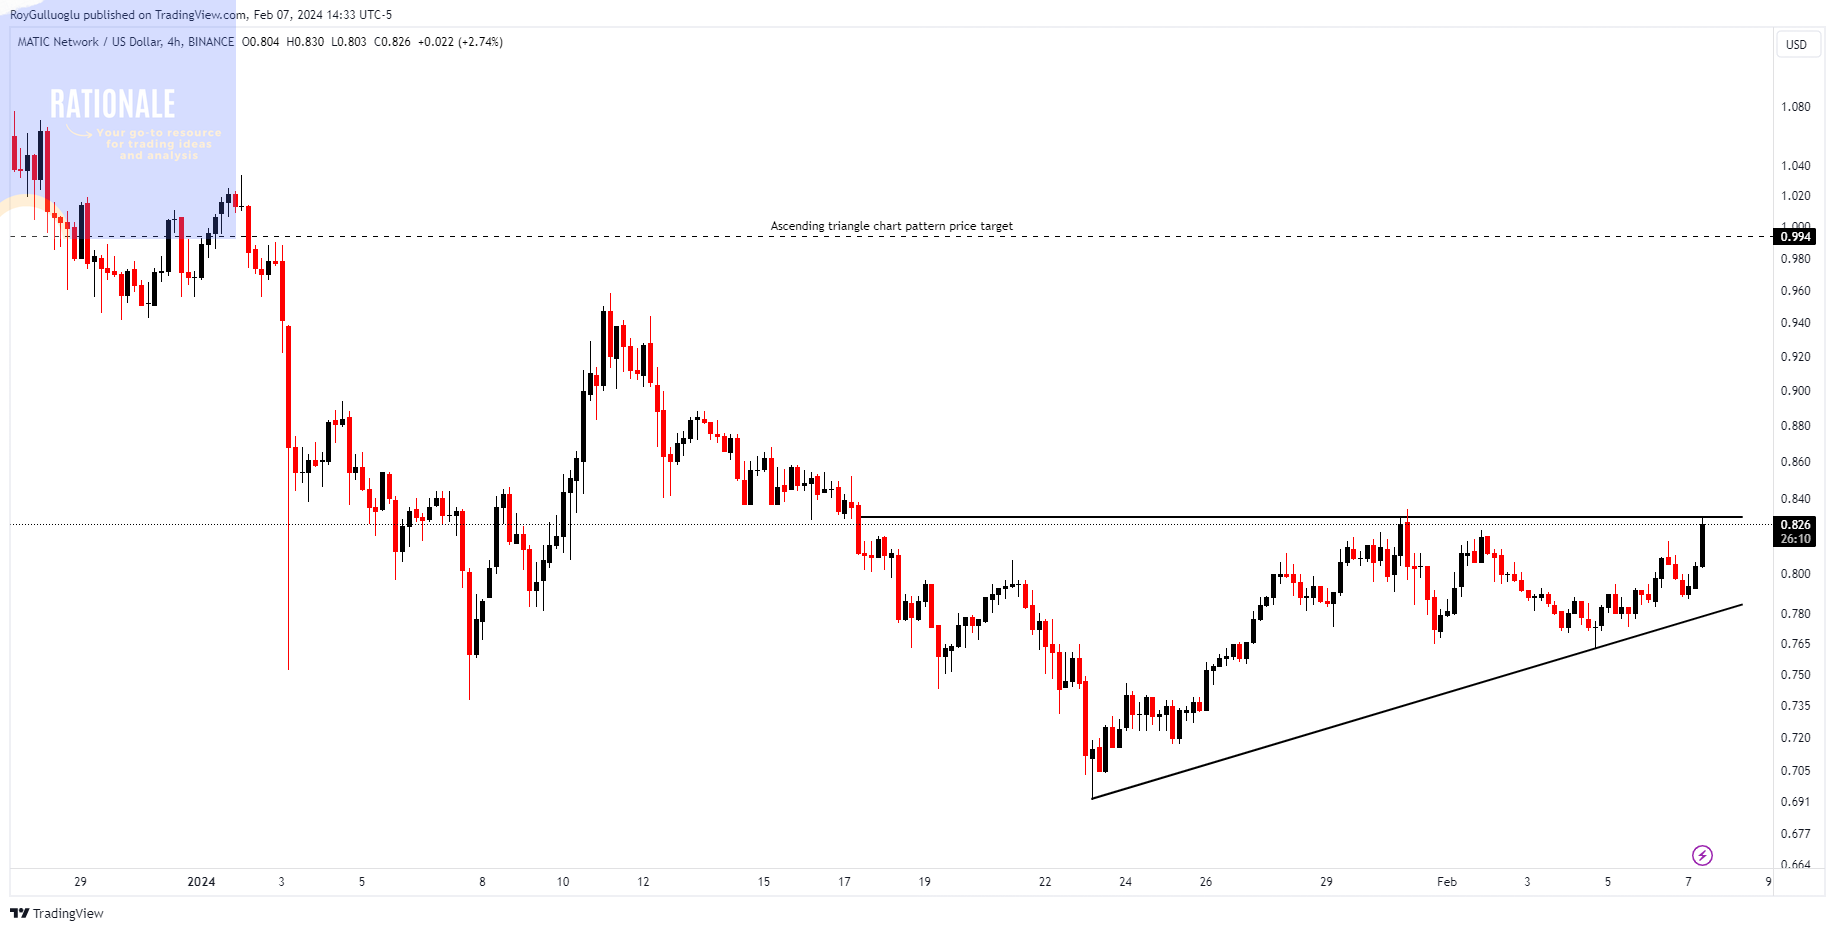
The above 4-hour chart formed an ascending triangle chart pattern as a bullish reversal after a downtrend.
The horizontal boundary at 0.83 levels acts as a resistance within this pattern.
A 4-hour bar close above 0.837(Resistance + ATR/2) levels would validate the breakout from the rectangle chart pattern.
Based on this chart pattern, the potential price target is 0.994 levels.
I anticipate a more robust breakout if we observe additional consolidation just below the resistance level. A few more tests of the resistance level would significantly enhance the health of a bullish price movement.
CFXUSD-Long Idea
The above daily chart formed an approximately 2-month-long rectangle chart pattern as a bullish continuation after an uptrend, with resistance at 0.2188 levels.
A daily close above 0.225 levels would validate the breakout from the first 2-month-long rectangle chart pattern.
This breakout could potentially result in a chart pattern target of 0.29 levels.
Follow-ups
XAUUSD-Long Idea
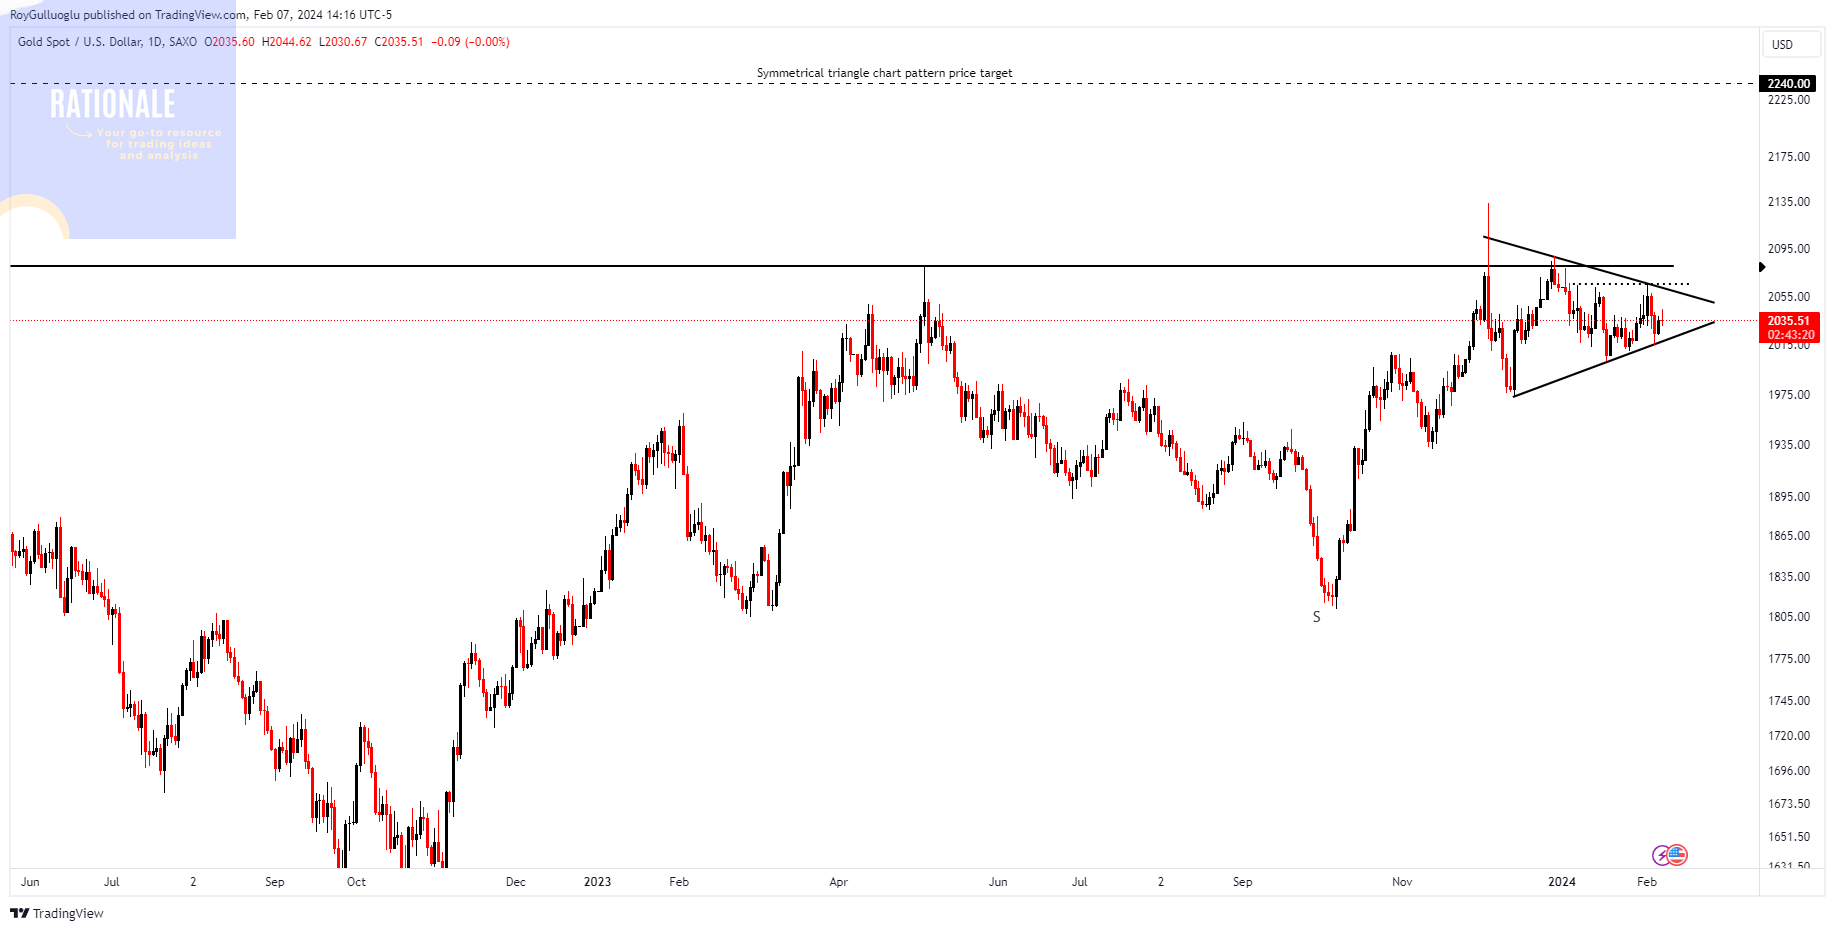
You can click the XAUUSD ticker above to access the first report explaining the RATIONALE behind the trade idea.


