

Trade Ideas Fx-Futures-Etf-Crypto
EURCAD, HO1!(NYMEX), IAK(ARCA), FDCF(NASDAQ)

EURCAD-Short Idea
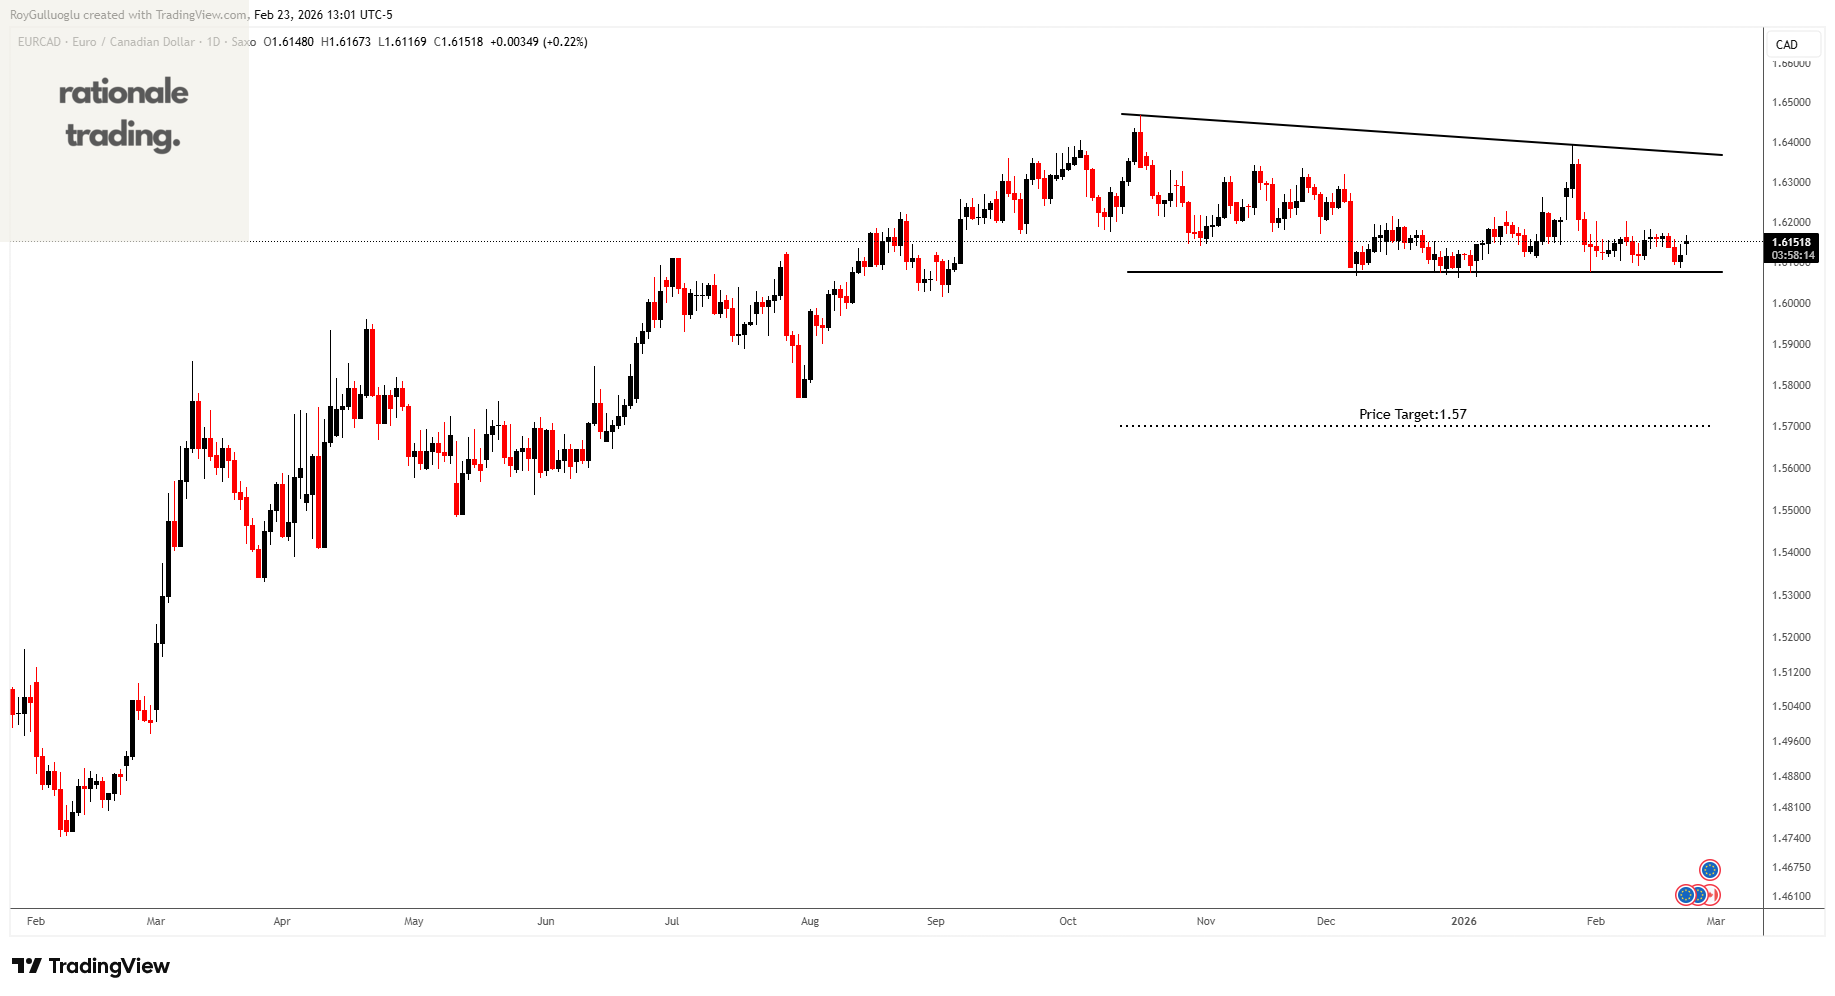
The above daily chart formed an approximately 3-month-long descending triangle chart pattern as a bearish reversal after an uptrend.
The horizontal boundary at 1.6075 levels acts as a support within this pattern.
A daily close below 1.604 levels would validate the breakdown from the 3-month-long descending triangle chart pattern.
Based on this chart pattern, the potential price target is approximately 1.57 levels.
Shorting EURCAD effectively might act as a proxy long oil trade, as CAD tends to strengthen with rising crude prices while the euro does not benefit in the same way, making the pair an expression of bullish energy theme positioning.
HO1!(Heating Oil Futures)-Long Idea
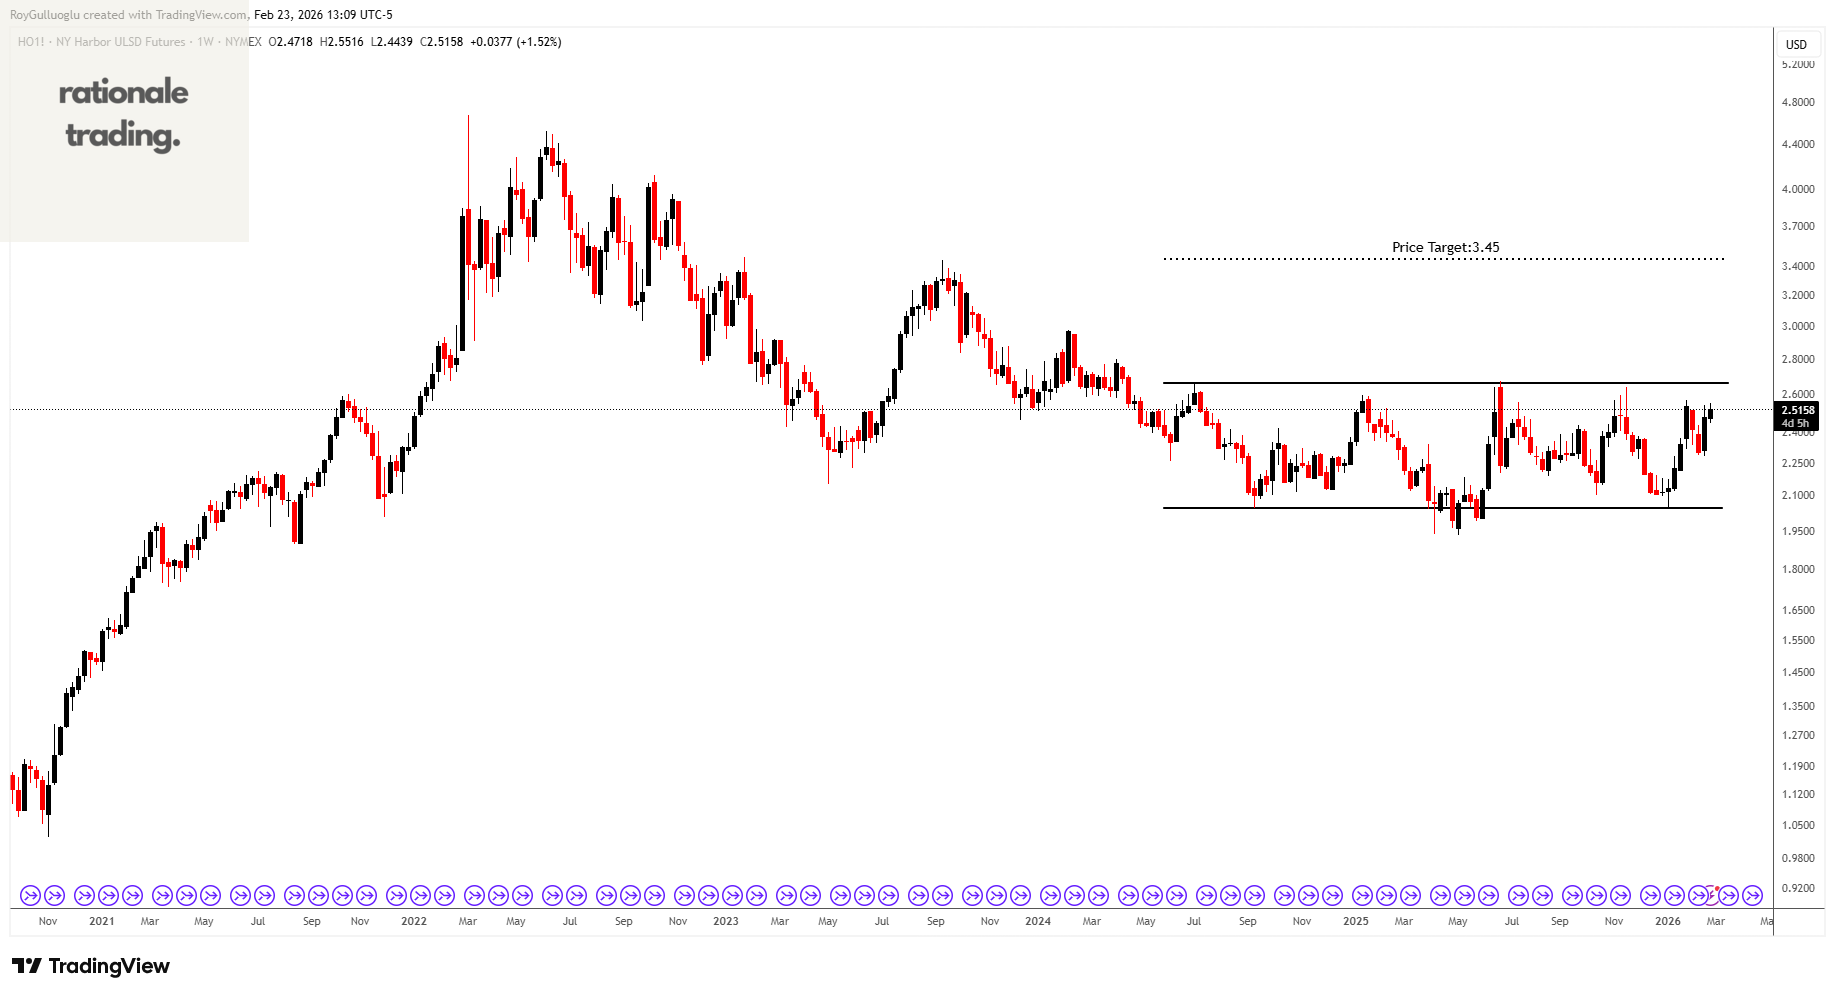
The above weekly chart formed an approximately 22-month-long rectangle chart pattern as a bullish reversal after a downtrend.
The horizontal boundary at 2.6595 levels acts as a resistance within this pattern.
A daily close above 2.7392 levels would validate the breakout from the 22-month-long rectangle chart pattern.
Based on this chart pattern, the potential price target is approximately 3.45 levels.
IAK(iShares US Insurance ETF)-Long Idea
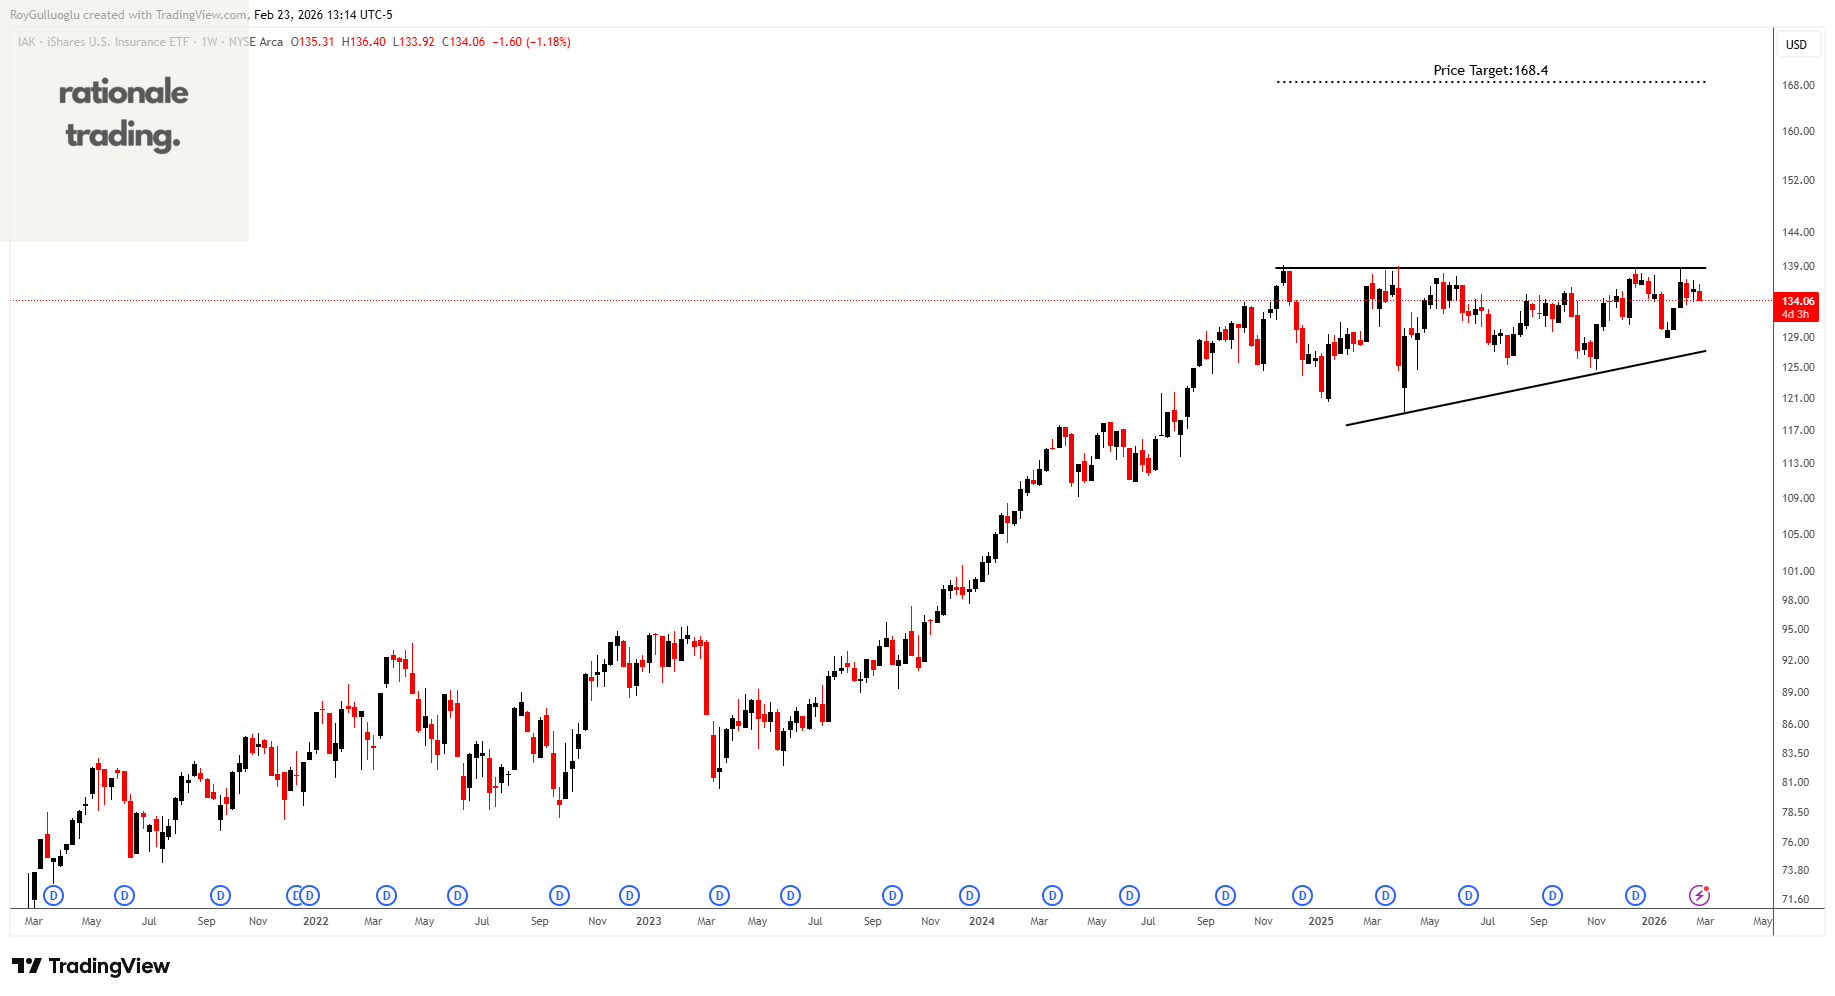
Exposure to U.S. companies that provide life, property and casualty, and full line insurance
The above weekly chart formed an approximately 16-month-long ascending triangle chart pattern as a bullish continuation after an uptrend.
The horizontal boundary at 138.65 levels acts as a resistance within this pattern.
A daily close above 142.8 levels would validate the breakout from the 16-month-long ascending triangle chart pattern.
Based on this chart pattern, the potential price target is approximately 168.4 levels.
FDCF(Fidelity Disruptive Communications ETF)-Short Idea
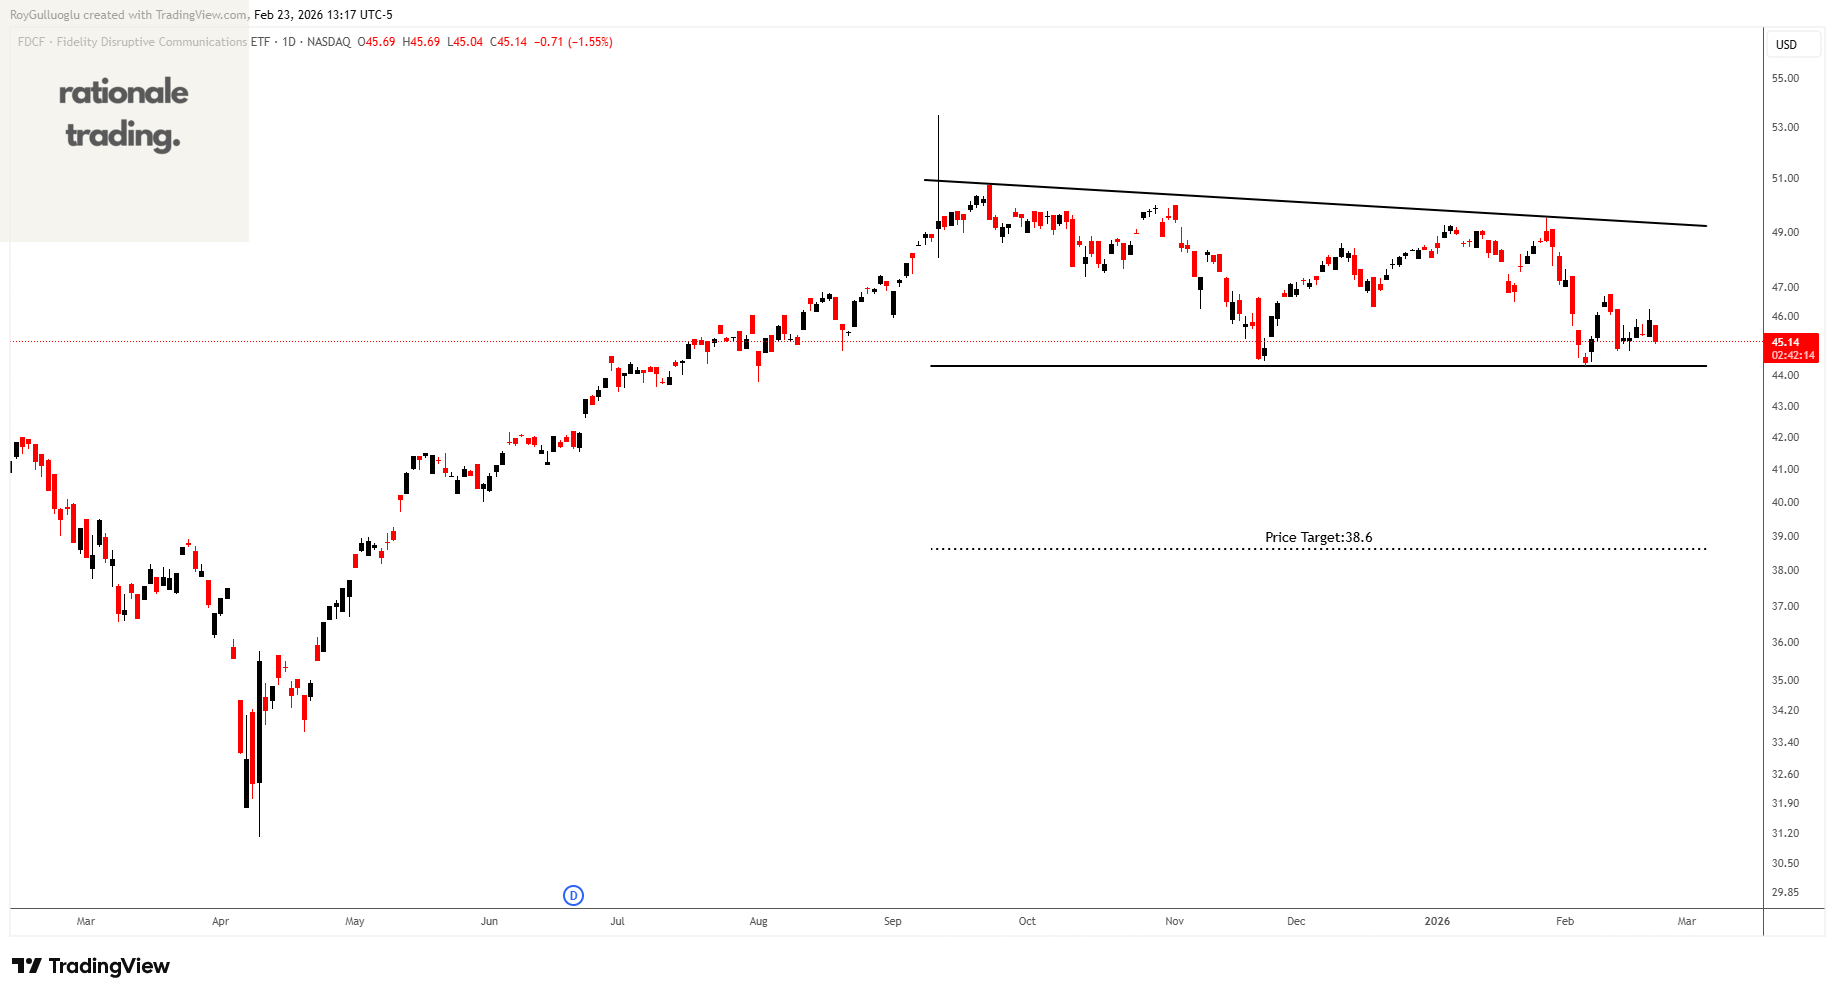
The above daily chart formed an approximately 4-month-long descending triangle chart pattern as a bearish reversal after an uptrend.
The horizontal boundary at 44.3 levels acts as a support within this pattern.
A daily close below 43 levels would validate the breakdown from the 4-month-long descending triangle chart pattern.
Based on this chart pattern, the potential price target is approximately 38.6 levels.
FDCF includes communication and digital platform companies that are sensitive to interest rates. If bond yields stay high or rise again, their valuations could come under pressure.
Teşekkürler Roy