

Trade Ideas Fx-Futures-Etf-Crypto
ZS1!(CBOT), XU030D1!(BIST), FTI1!(EURONEXT), USDMXN, EURCHF, CHFJPY, GBPCHF

ZS1!(Soybean Futures)-Long Idea
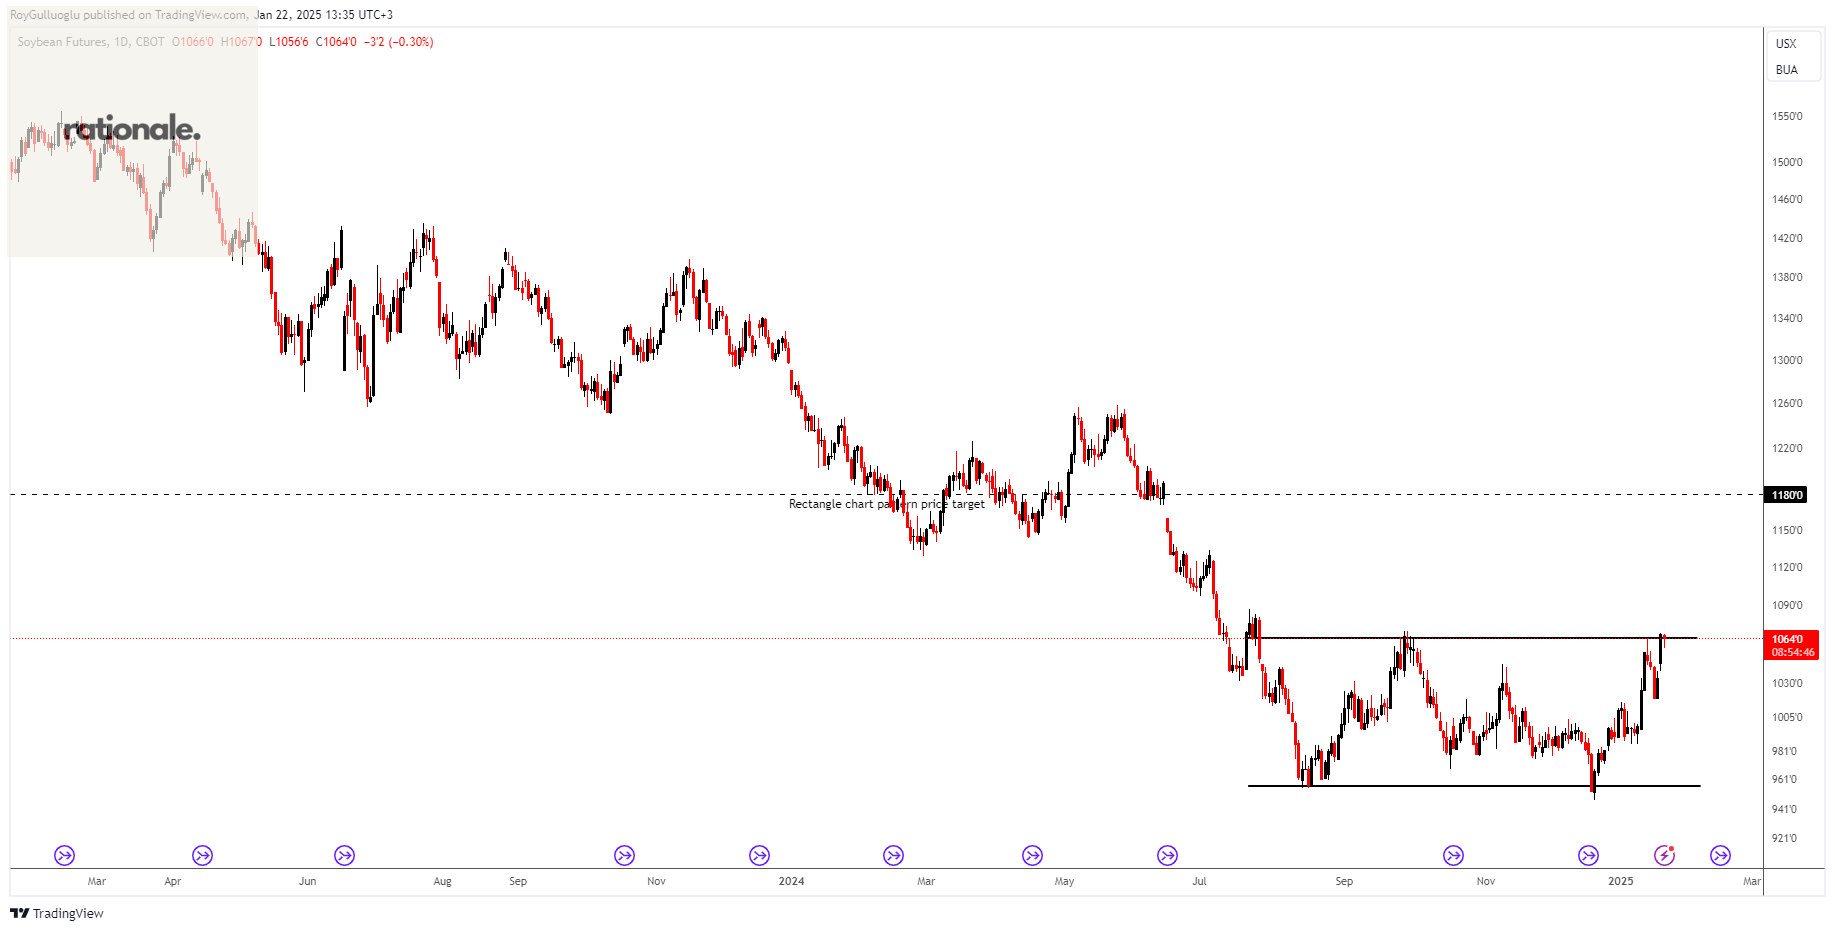
The above daily chart formed an approximately 4-month-long rectangle chart pattern as a bullish reversal after a downtrend.
The horizontal boundary at 1064 levels acts as a resistance within this pattern.
A daily close above 1075 (%1 or %1.5 low of the support for FX, Futures) levels would validate the breakout from the 4-month-long rectangle chart pattern.
Based on this chart pattern, the potential price target is approximately 1180 levels.
XU030D1!(BIST 30 Futures)-Long Idea
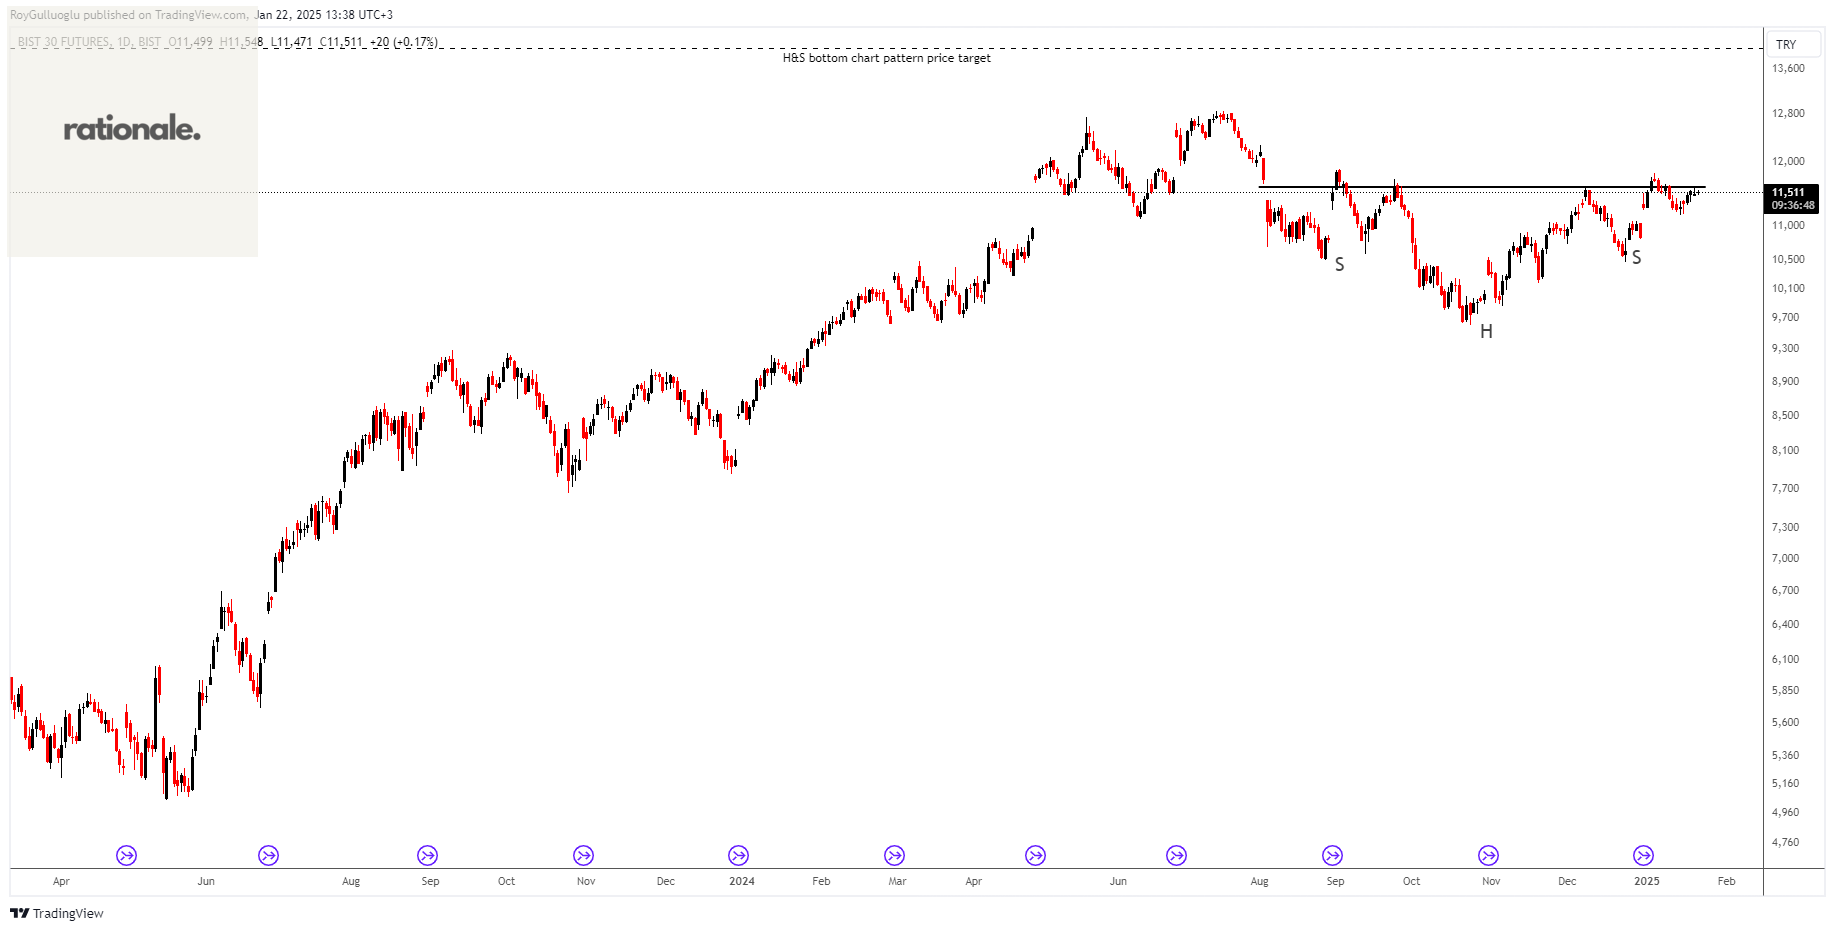
The above daily chart formed an approximately 4-month-long H&S bottom chart pattern as a bullish reversal after a downtrend.
The horizontal boundary at 11593 levels acts as a resistance within this pattern.
A daily close above 11700 (%1 or %1.5 low of the support for FX, Futures) levels would validate the breakout from the 4-month-long H&S bottom chart pattern.
Based on this chart pattern, the potential price target is approximately 1180 levels.
FTI1!(AEX Index Futures)-Long Idea
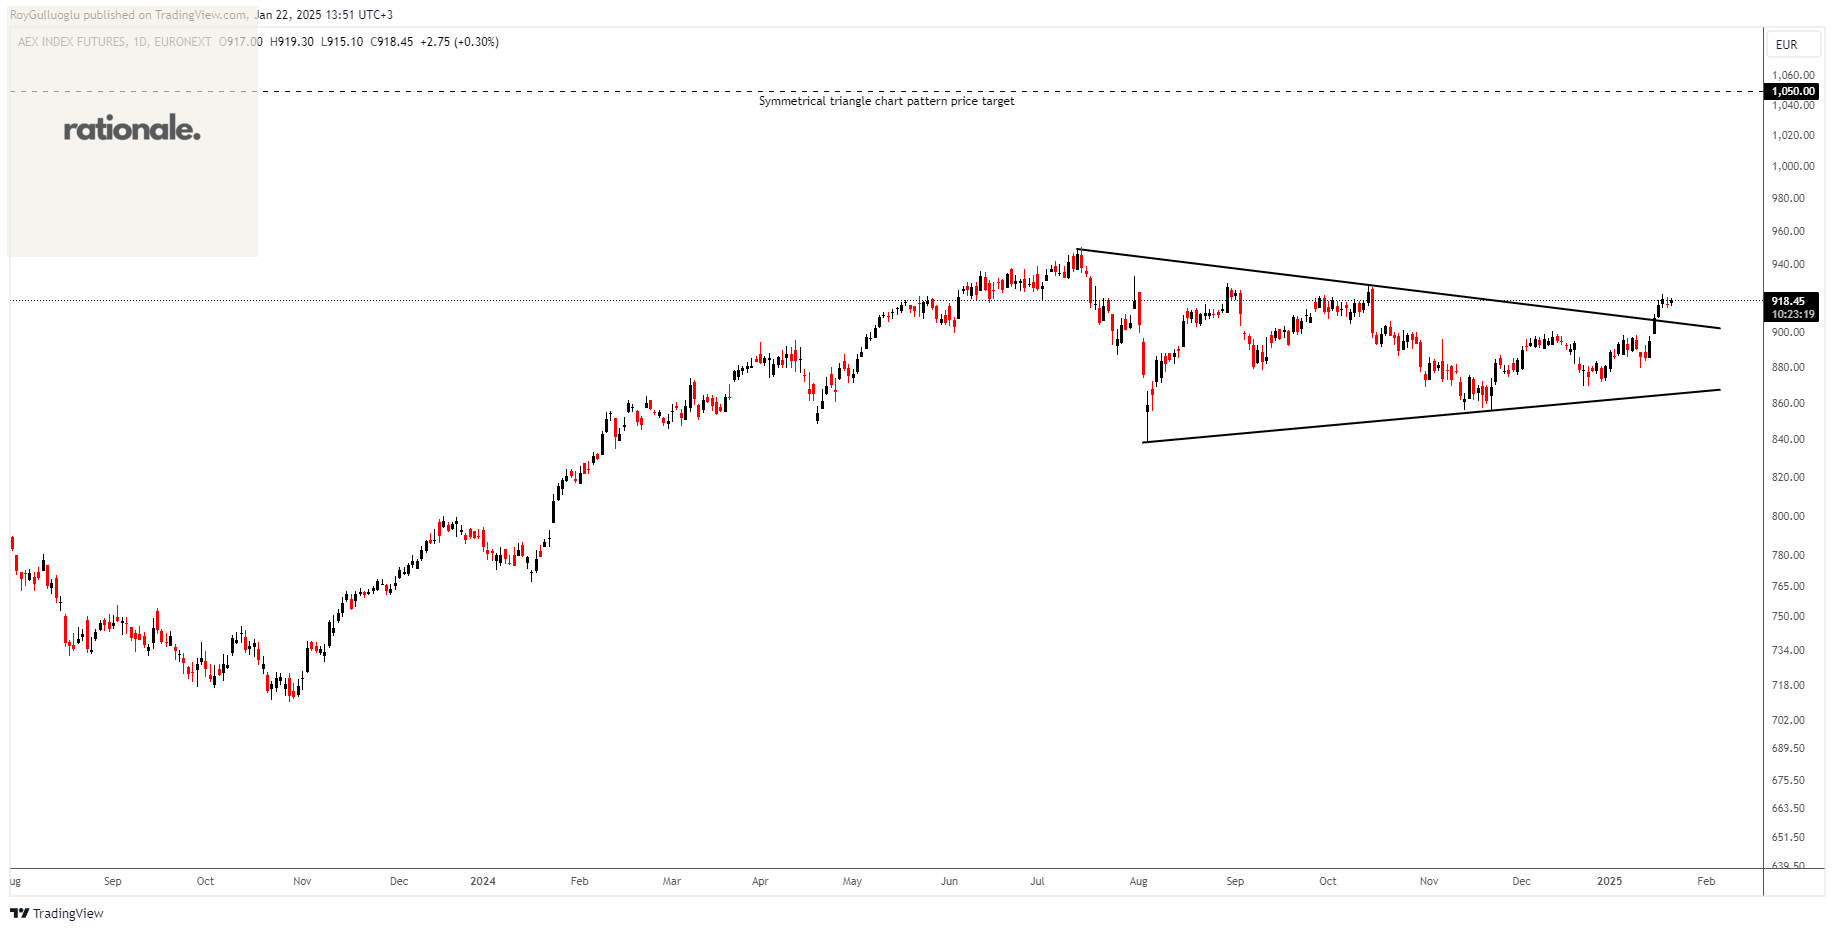
The above daily chart formed an approximately 4-month-long symmetrical triangle chart pattern as a bullish continuation after an uptrend.
A daily close above 916(%1 or %1.5 low of the support for FX, Futures) levels validated the breakout from the 4-month-long H&S bottom chart pattern.
Based on this chart pattern, the potential price target is approximately 1180 levels.
USDMXN-Long Idea
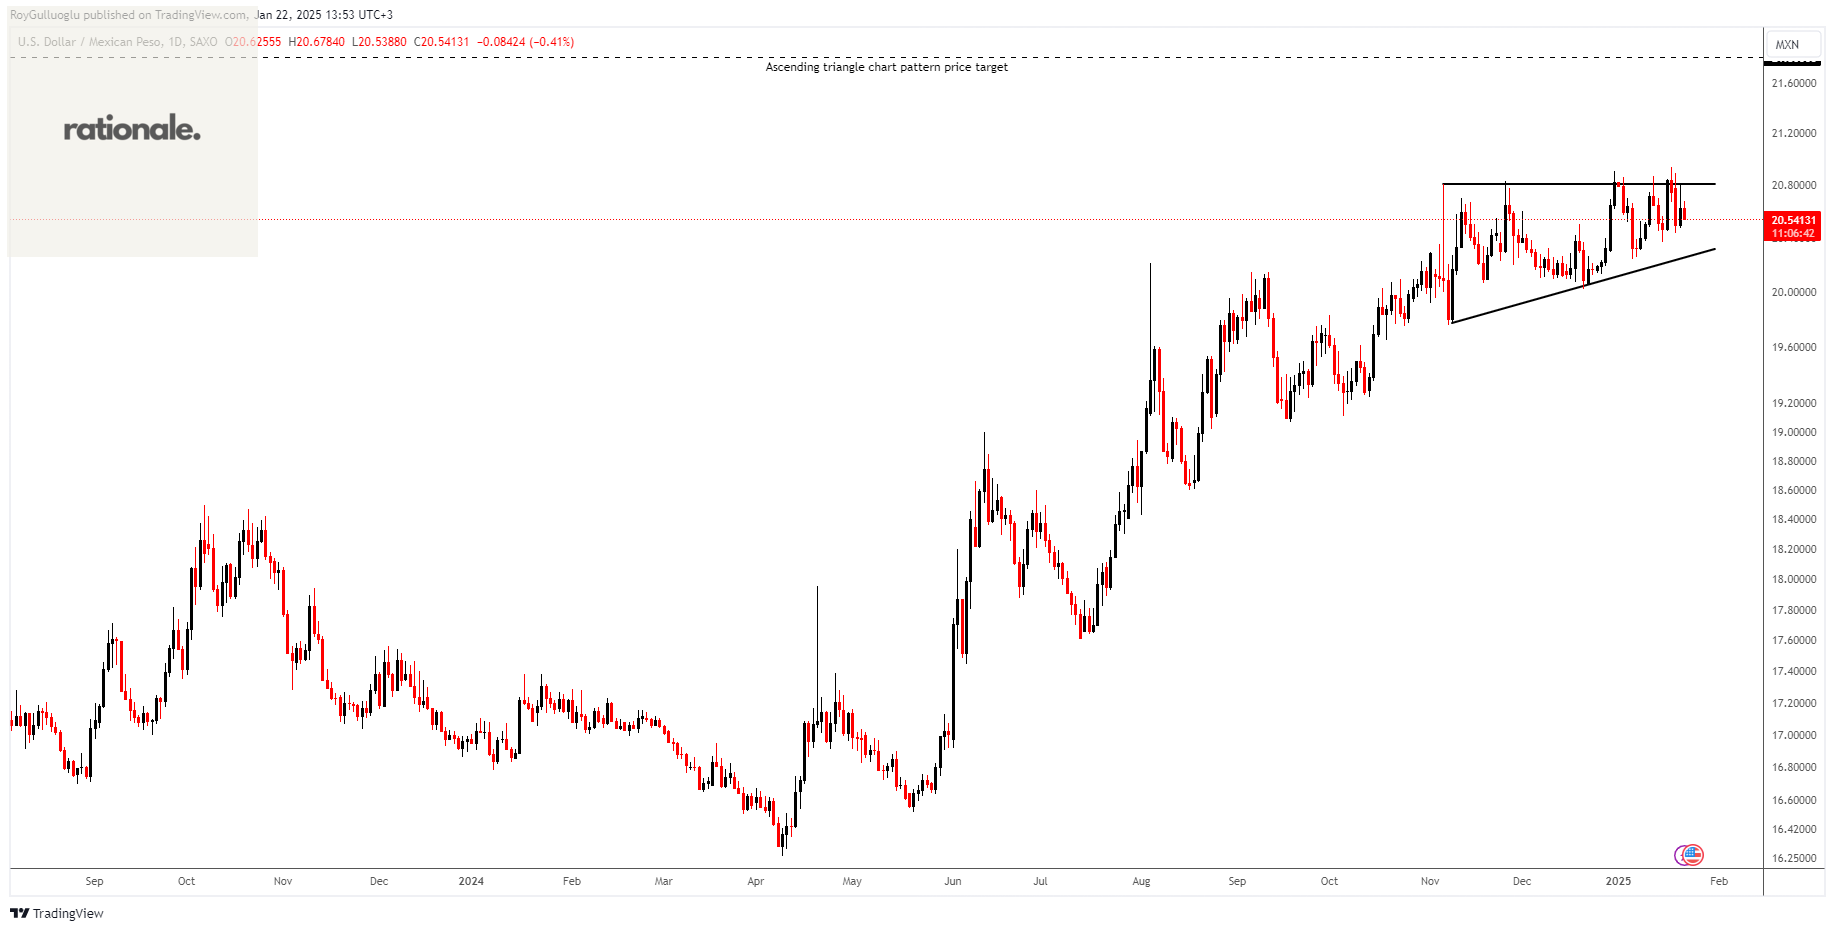
The above daily chart formed an approximately 2-month-long ascending triangle chart pattern as a bullish continuation after an uptrend.
The horizontal boundary at 20.807 levels acts as a resistance within this pattern.
A daily close above 21 levels would validate the breakout from the 2-month-long ascending triangle chart pattern.
Based on this chart pattern, the potential price target is approximately 21.8 levels.
USD Strengthening: With U.S. policy under President Trump potentially impacting Mexico, including trade policies and fiscal decisions, the Mexican peso could face pressure.
Economic and Trade Uncertainty: Trade tensions or any adverse moves by the U.S. could lead to a weakening of the MXN, especially given its sensitivity to U.S. economic developments.
Trade Idea: For those anticipating continued pressure on Mexico's economy, a long position on USD/MXN seems reasonable, as the dollar may strengthen against the peso amidst these uncertainties.
EURCHF-Long Idea
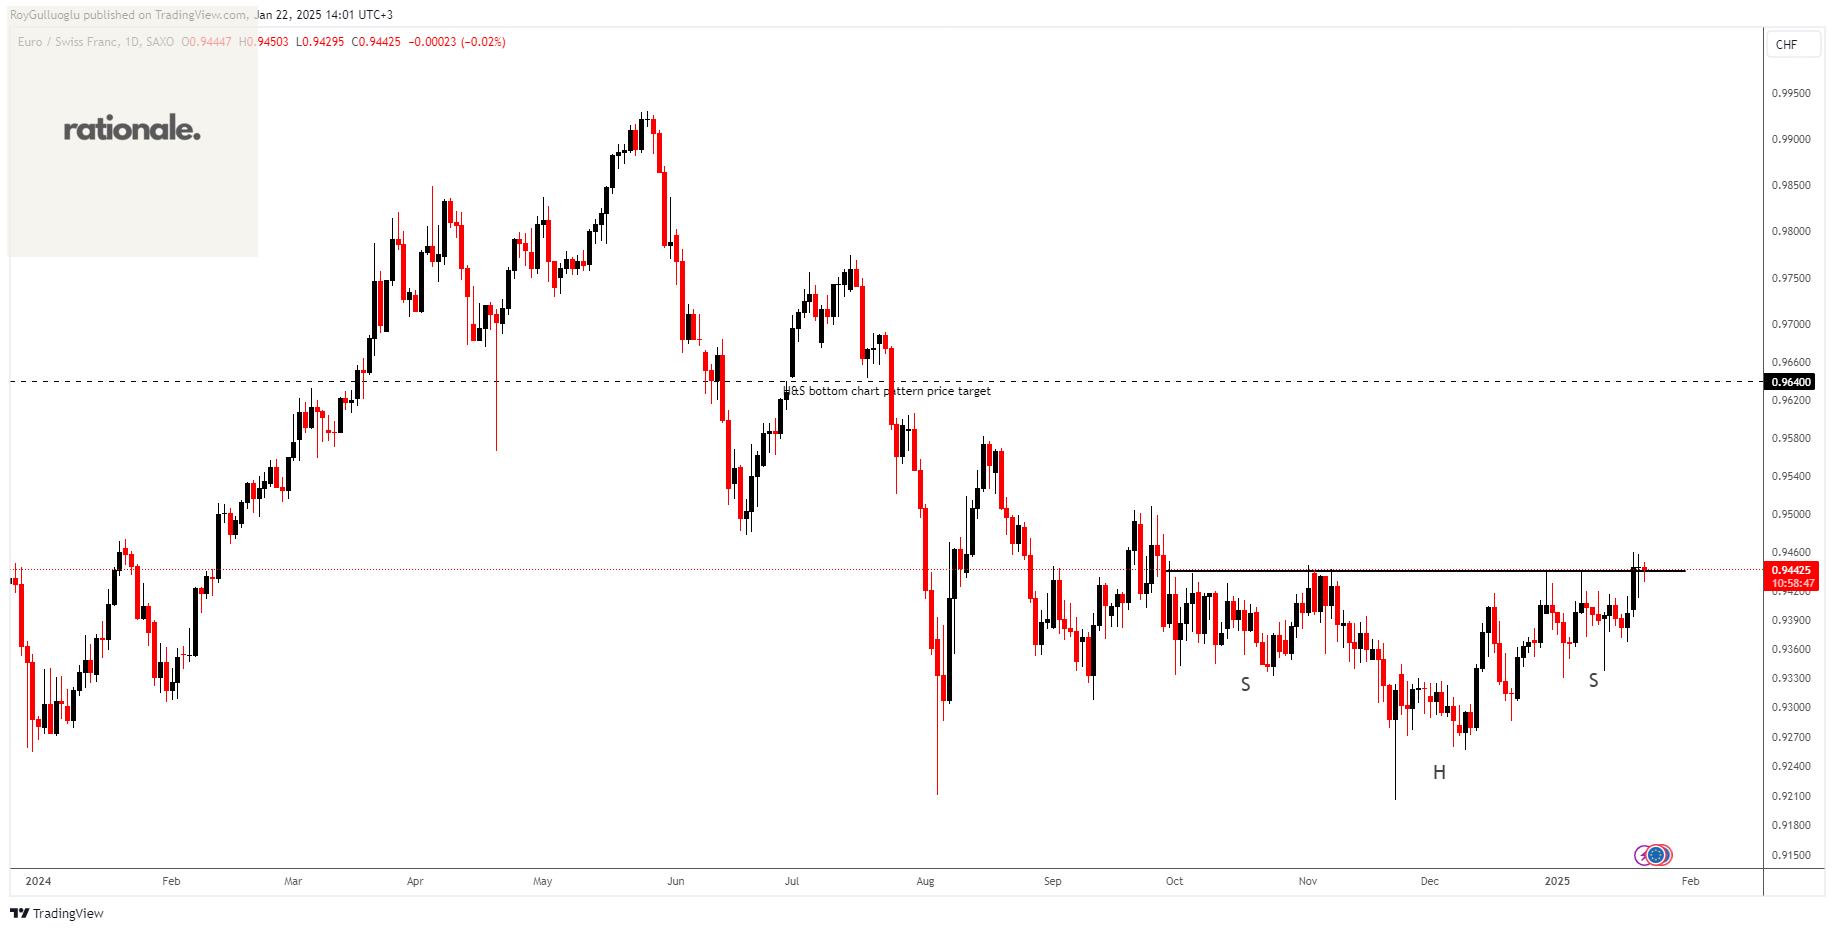
The above daily chart formed an approximately 3-month-long H&S bottom chart pattern as a bullish reversal after a downtrend.
The horizontal boundary at 0.9445 levels acts as a resistance within this pattern.
A daily close above 0.9465 (ATR/2+0.9445) levels would validate the breakout from the 3-month-long H&S bottom chart pattern.
Based on this chart pattern, the potential price target is approximately 0.964 levels.
Positive EUR Outlook: The possibility of the US softening tariffs on the Eurozone could boost confidence in the EUR, likely driving it higher.
CHF and Gold Connection: CHF often moves in line with gold prices. While gold is currently trading sideways, this doesn’t mean I’m bearish on gold. However, in such a tariff scenario, the EUR is expected to appreciate more significantly than the CHF, making EUR/CHF an attractive long setup.
CHFJPY-Short Idea
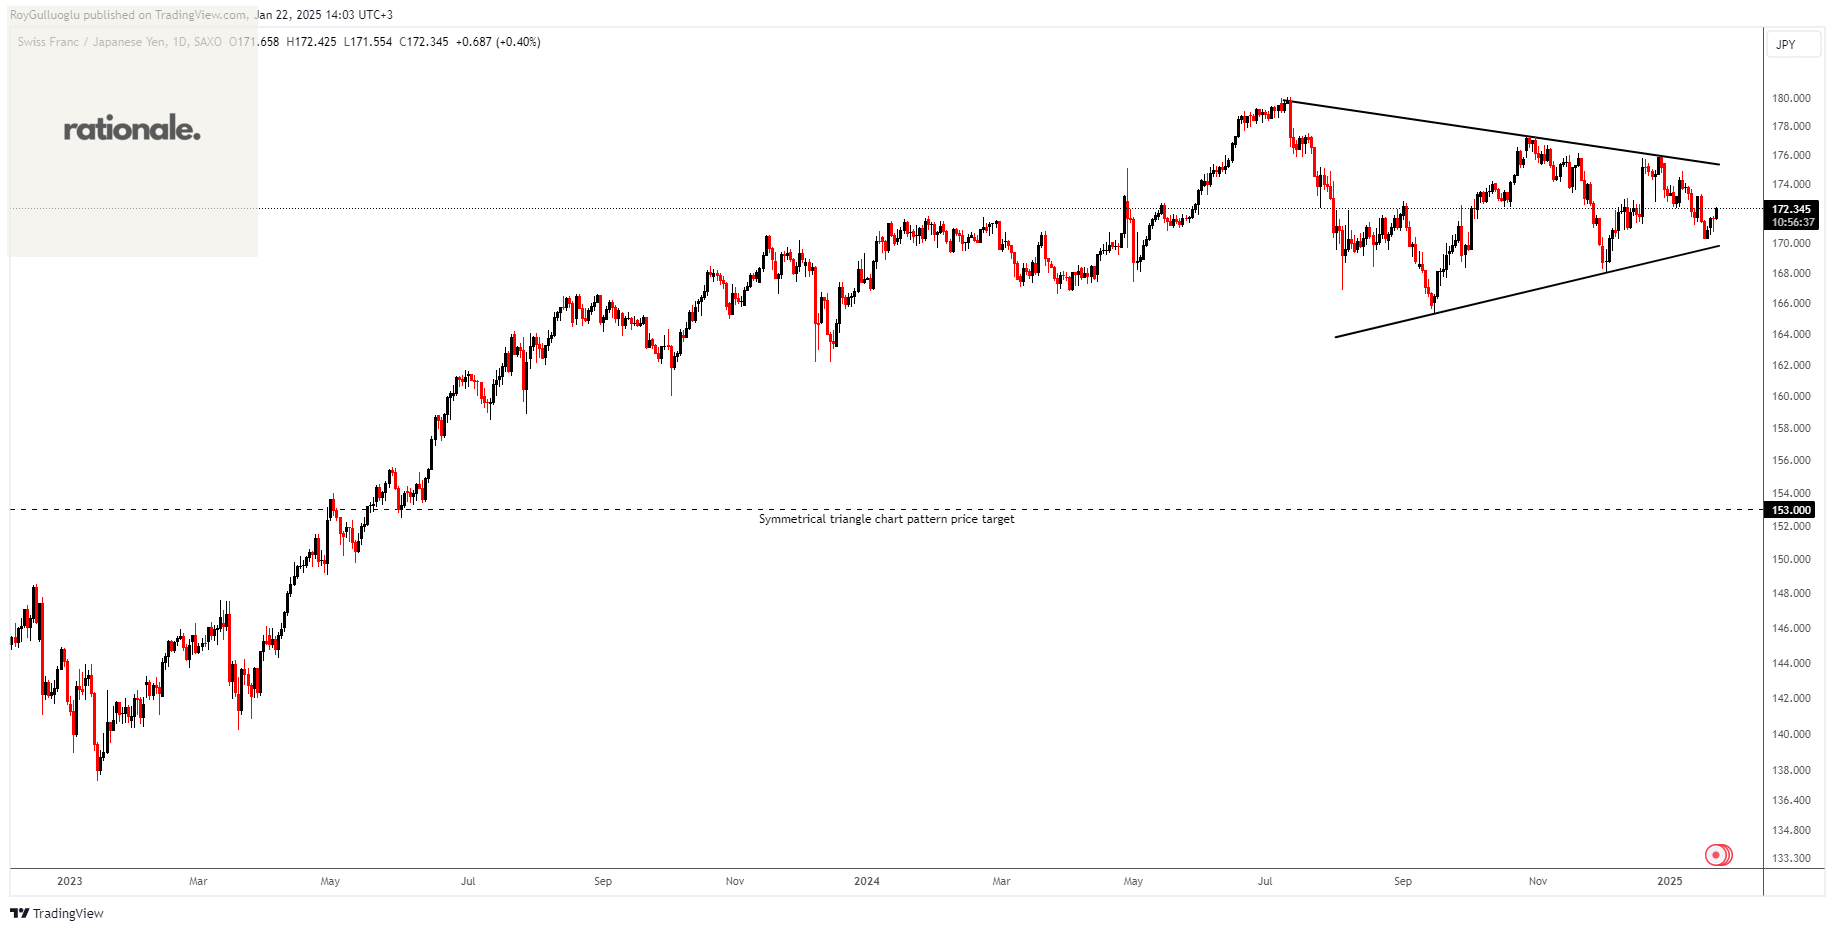
The above daily chart formed an approximately 5-month-long symmetrical triangle chart pattern as a bullish reversal after an uptrend.
A daily close below 168.3 levels (%1 or %1.5 low of the support for FX, Futures) would validate the breakout from the 5-month-long symmetrical triangle chart pattern.
Based on this chart pattern, the potential price target is approximately 153 levels.
JPY Trade Potential: With the Bank of Japan on a path to raising rates, the JPY could become more favorable. Given the current chart setup, positioning for a potential JPY move against CHF aligns well with this theme, making CHF/JPY shorts a compelling trade idea.
GBPCHF-Short Idea
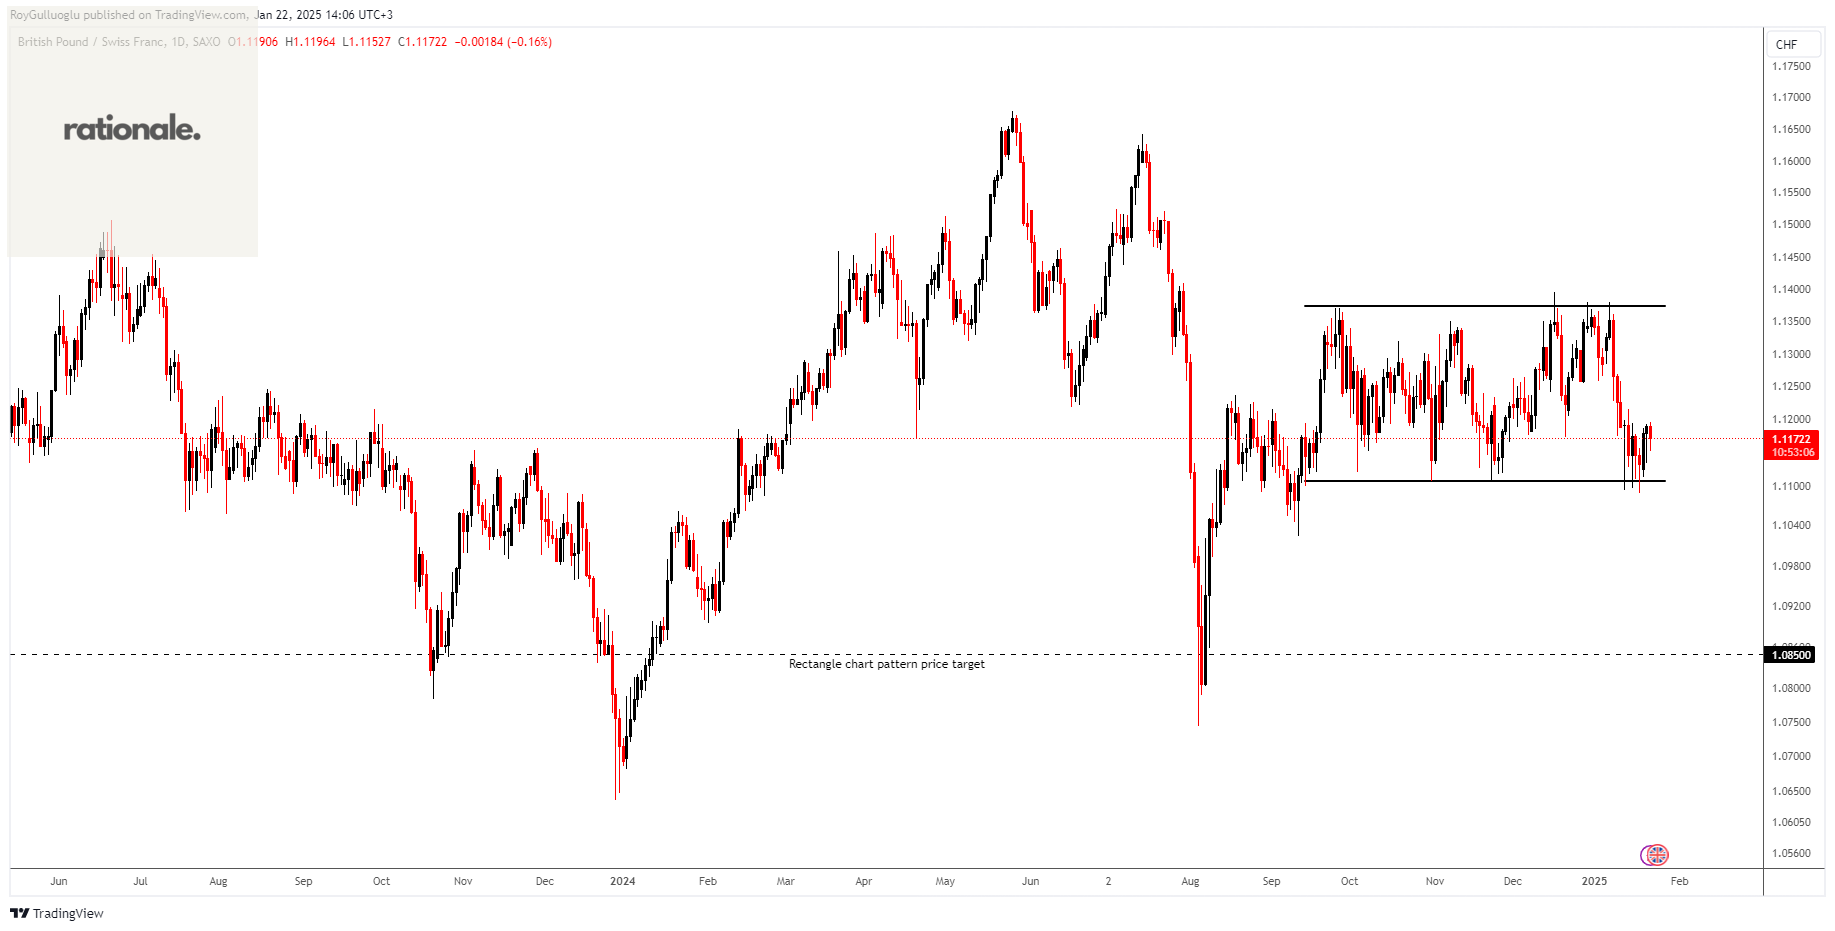
The above daily chart formed an approximately 3-month-long rectangle chart pattern as a bearish reversal after an uptrend.
The horizontal boundary at 1.11 levels acts as a support within this pattern.
A daily close below 1.0989 levels (%1 or %1.5 low of the support for FX, Futures) would validate the breakout from the 3-month-long rectangle chart pattern.
Based on this chart pattern, the potential price target is approximately 1.85 levels.
GBP Weakness: The UK is facing ongoing challenges, including rising gilt yields and increased borrowing costs, which are weakening investor confidence in the pound.
Fiscal Concerns: The potential for a "debt death spiral" and ongoing fiscal instability adds pressure to the GBP.
Trade Idea: For those expecting continued issues with the UK economy, a short position on GBP/CHF appears reasonable, as the pound remains vulnerable in the current environment.
Teşekkürler