


EMD1!(E-Mini S&P MidCap 400 Futures)-Short Idea
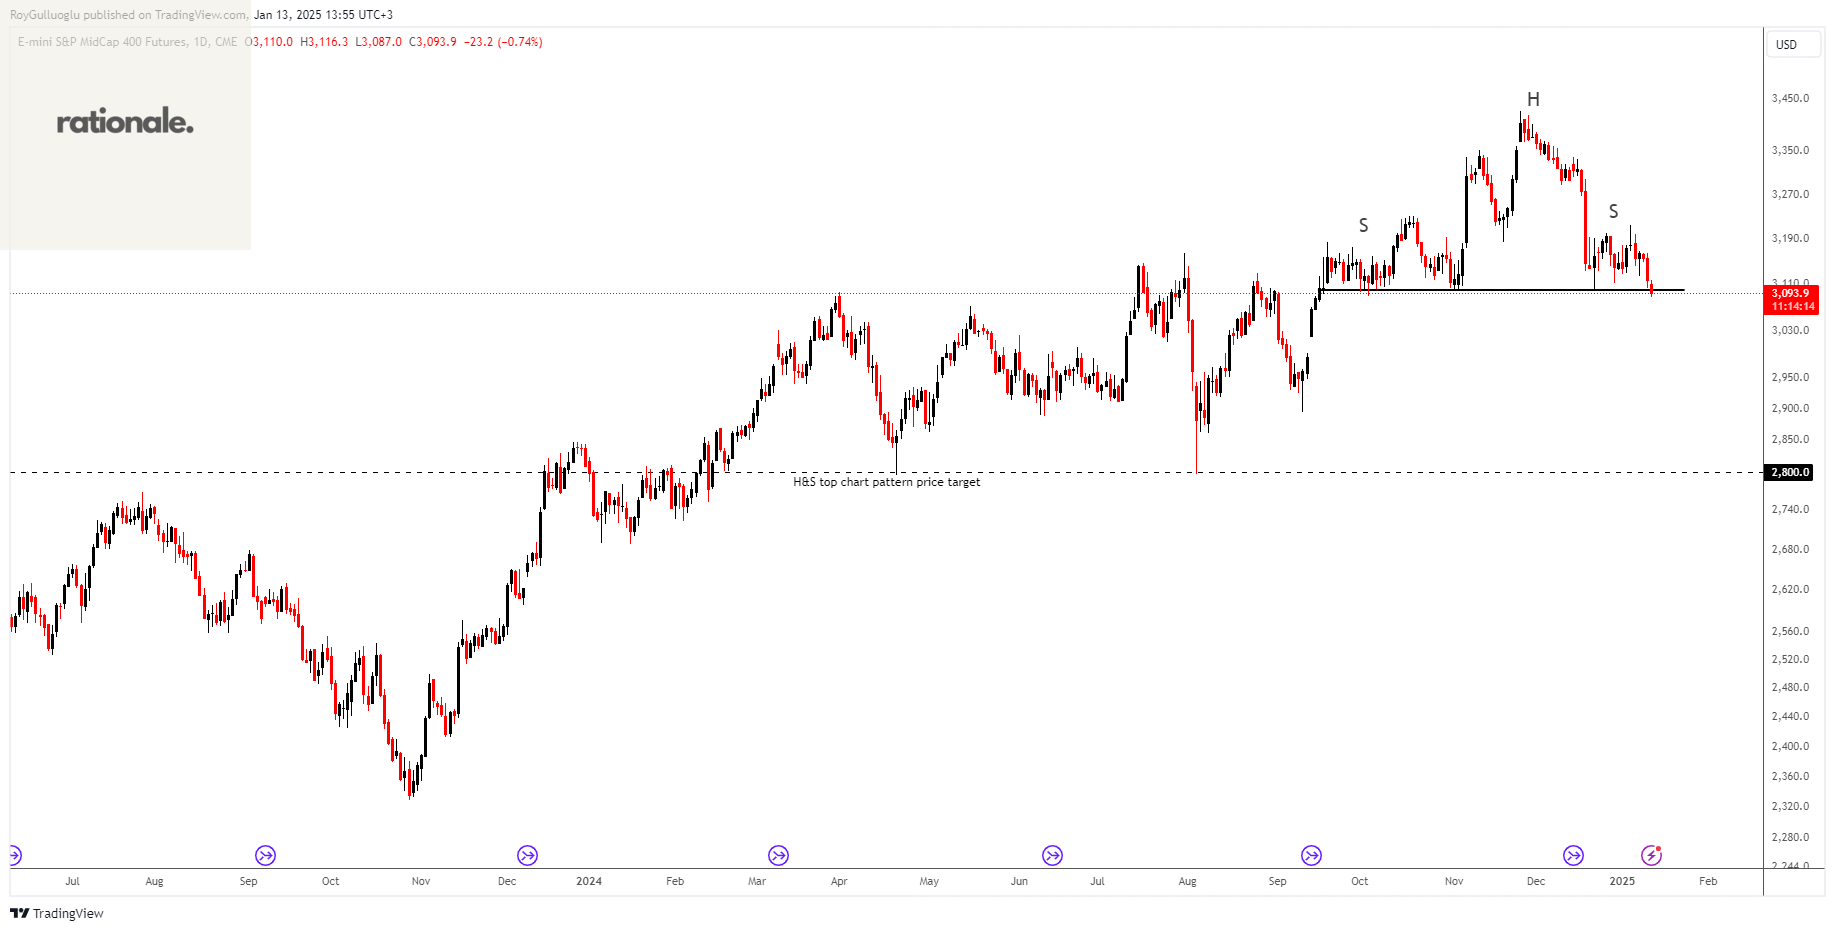
The above daily chart formed an approximately 2-month-long H&S top chart pattern as a bearish reversal after an uptrend.
The horizontal boundary at 3100 levels acts as a support within this pattern.
A daily close below 3050 (%1 or %1.5 low of the support for FX, Futures) levels would validate the breakout from the 2-month-long H&S top chart pattern.
Based on this chart pattern, the potential price target is approximately 2800 levels.
Trump's testimony and influence are weighing on markets, introducing uncertainty around the implications of the Republican agenda. Additionally, with the latest NFP numbers surpassing expectations, the Fed has room to maintain elevated interest rates. Given these factors, a potential correction in equities seems reasonable.
GC1!(Gold Futures)-Long Idea
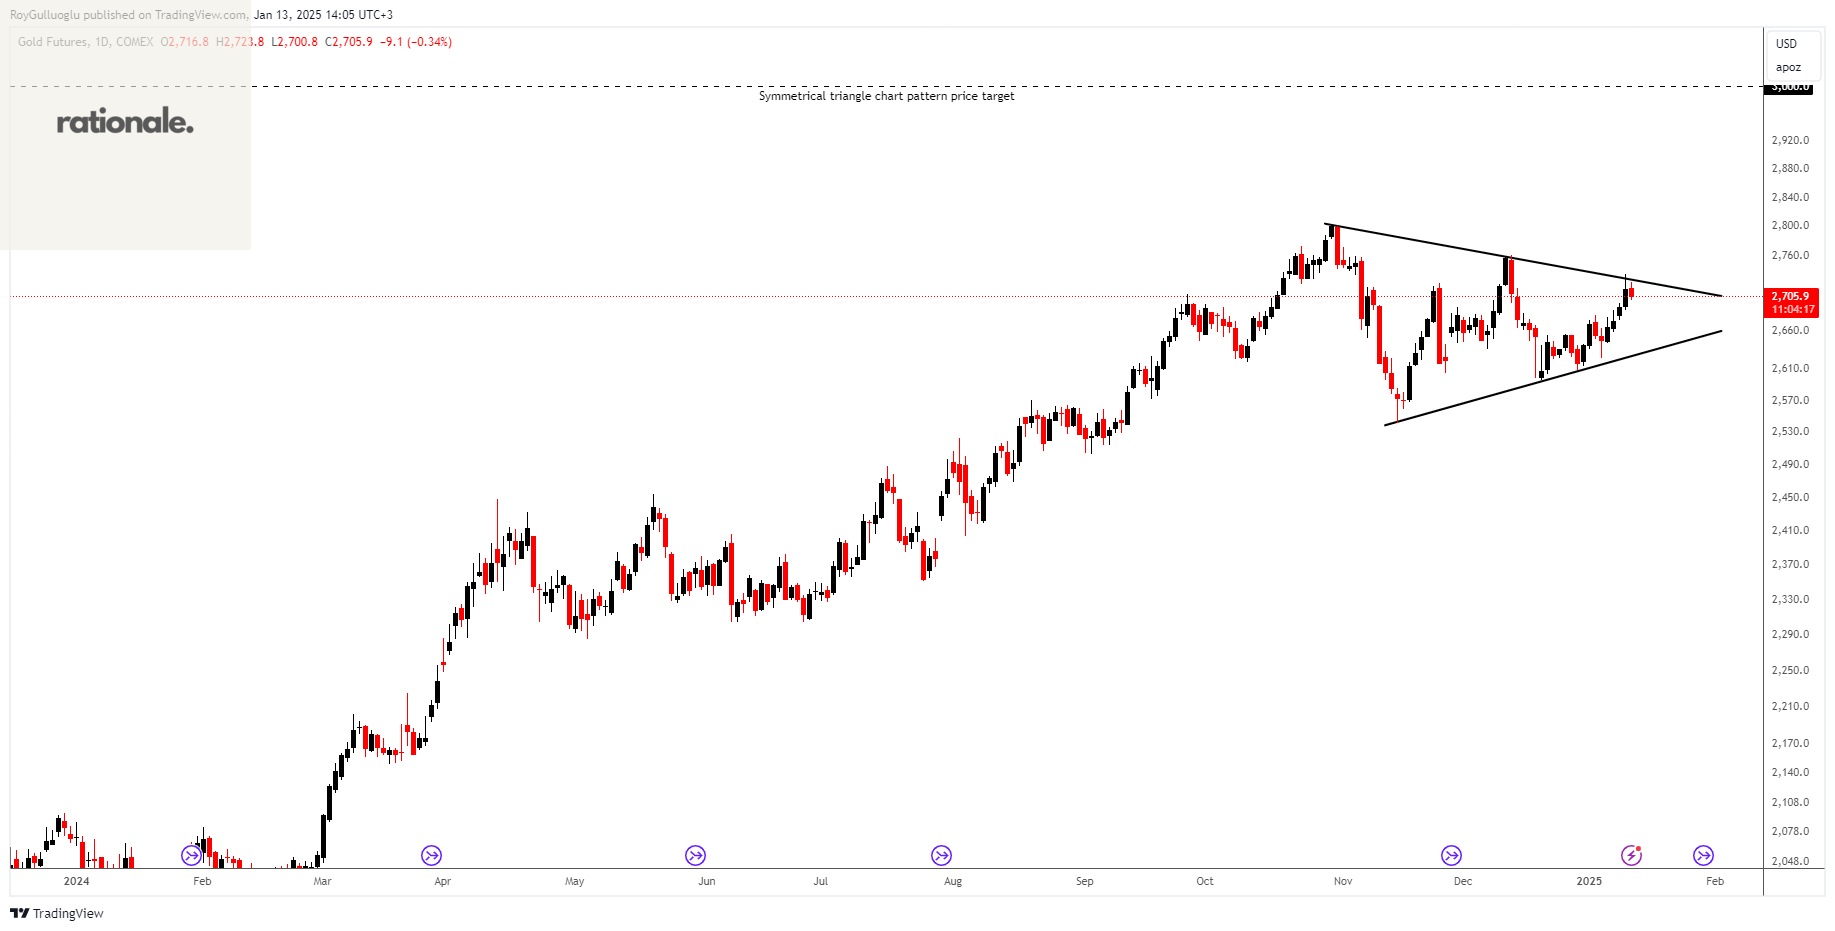
The above daily chart formed an approximately 2-month-long symmetrical triangle chart pattern as a bullish continuation after an uptrend.
A daily close above 2770 (%1 or %1.5 high of the resistance for FX, Futures) levels would validate the breakout from the 3-month-long rectangle chart pattern.
Based on this chart pattern, the potential price target is 3000 levels.
The major uptrend in gold has remained robust, thanks to those political and geopolitical uncertainties, as they continue to support safe-haven demand. At the same time, the base case scenario is pointing towards lower interest rates. I still believe that corrections within gold's major uptrend should be seen as positioning opportunities.
The attached symmetrical triangle represents a consolidation phase following a major breakout. Currently, the price is trading around short-term moving averages like the 21 and 50 EMAs while waiting for long-term moving averages, such as the 200 EMA, to converge.
iShares S&P GSCI Commodity Indexed Trust ETF-(GSG/ARCA)-Long Idea
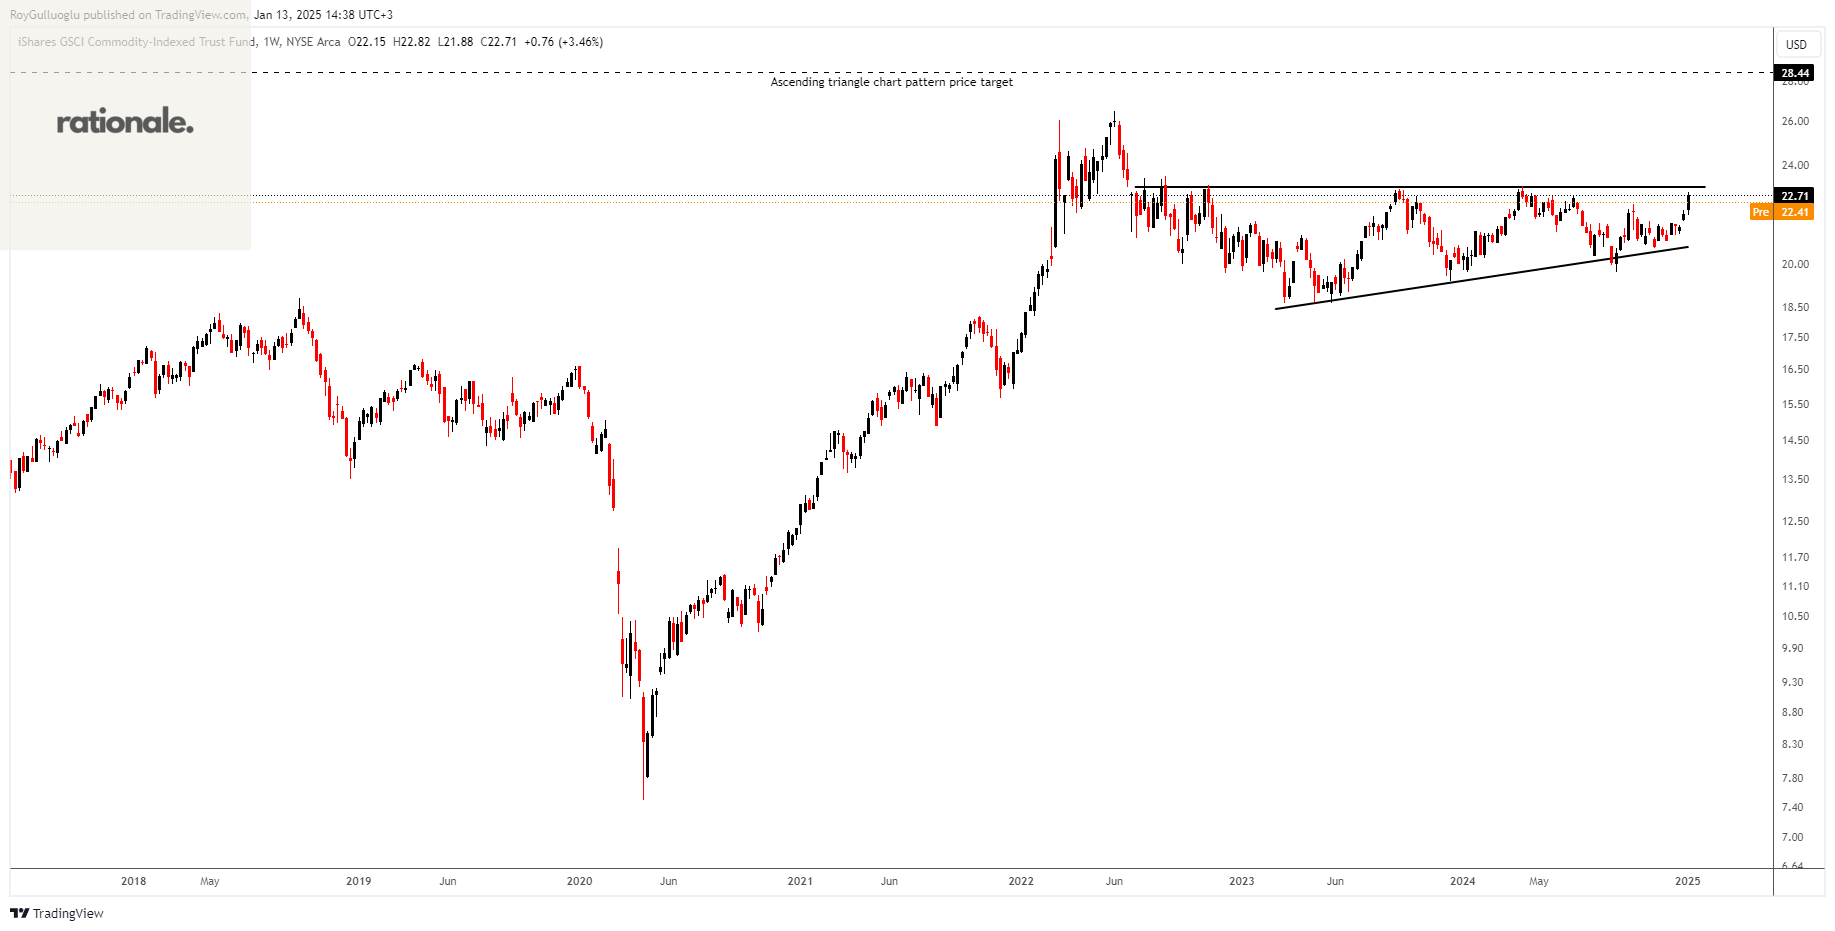
The iShares S&P GSCI Commodity-Indexed Trust ETF (GSG) is designed to track the performance of the S&P GSCI Total Return Index, which measures the returns of a diversified basket of commodity futures contracts.
It is heavily weighted towards the energy sector. As of January 2025, the approximate sector allocations are: Energy: ~70%, Agriculture: ~15%, Industrial, Metals: ~7%, Livestock: ~5%, Precious Metals: ~3%. This significant emphasis on energy commodities means that GSG's performance is closely tied to the energy market.
The above weekly chart formed an approximately 30-month-long ascending triangle chart pattern as a bullish reversal after a downtrend.
Within this pattern, the horizontal boundary at 23 levels acts as a resistance.
A daily close above 23.7415 levels would validate the breakdown from the 30-month-long ascending triangle chart pattern.
Based on this chart pattern, the potential price target is approximately 28.4 levels.