


ZC1!(Corn Futures)-Short Idea
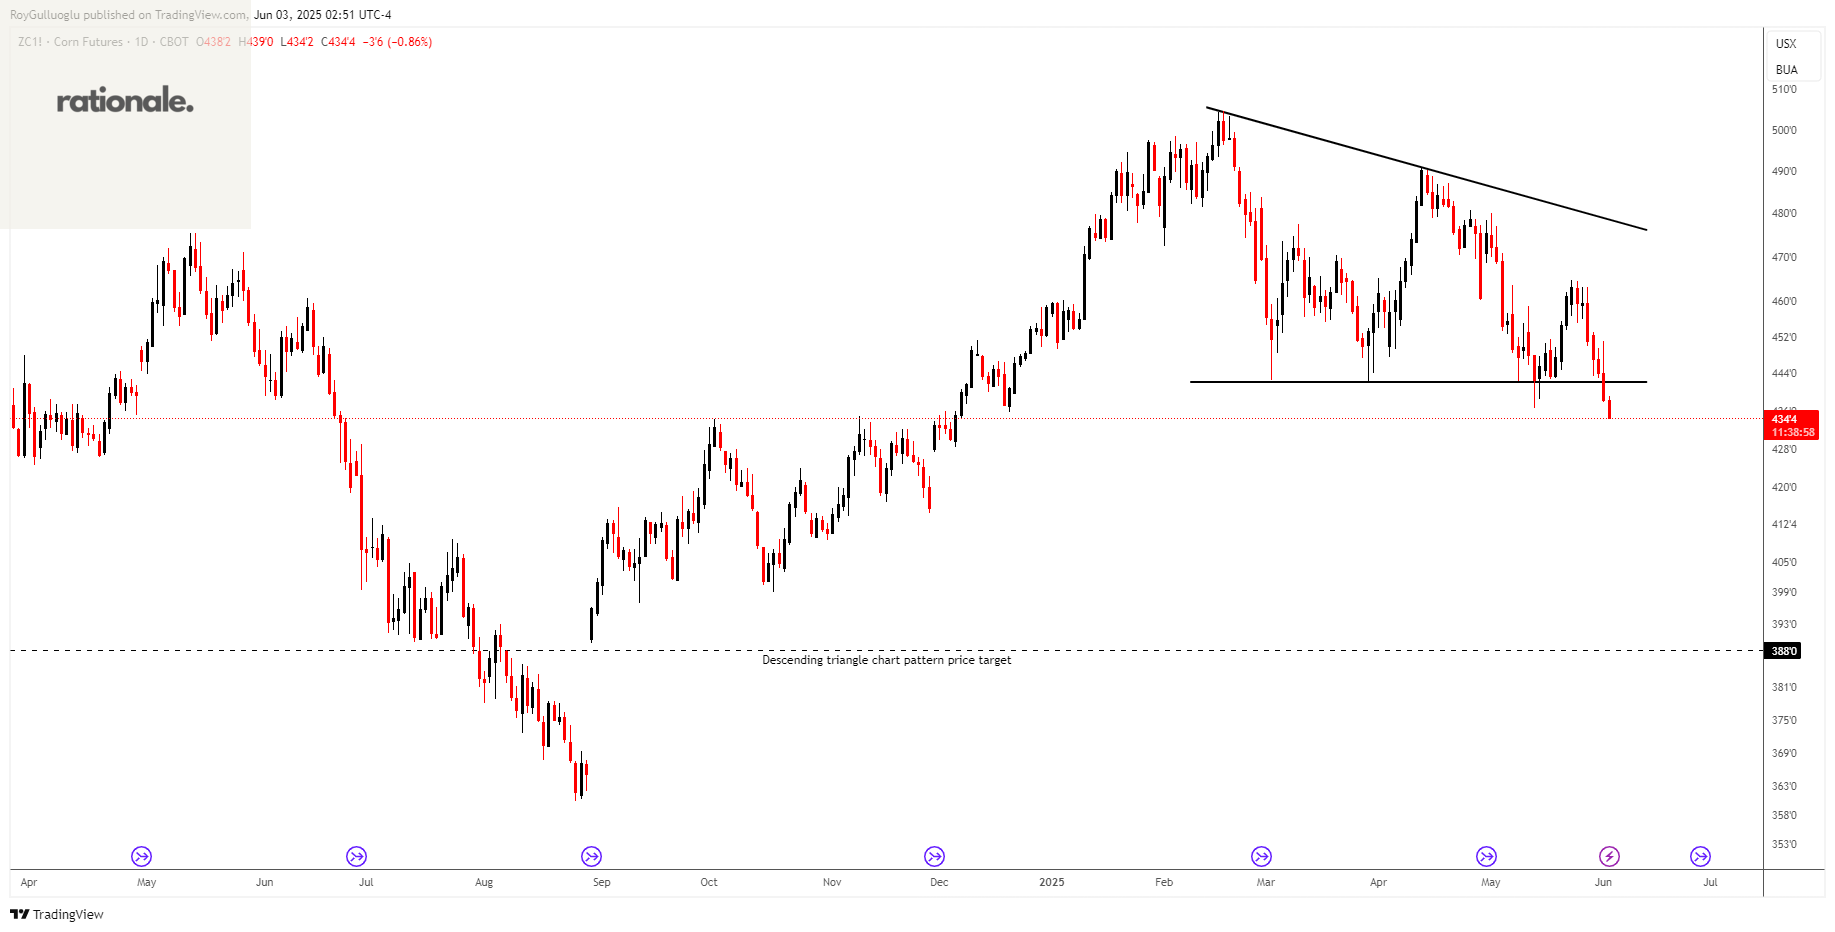
The above daily chart formed an approximately 2-month-long descending triangle chart pattern as a bearish reversal after an uptrend.
The horizontal boundary at 442 levels acted as a support within this pattern.
A daily close below 437.58 (%1 or %1.5 low of the support for FX, Futures) levels validated the breakdown from the 2-month-long descending triangle chart pattern.
Based on this chart pattern, the potential price target is approximately 388 levels.
TTF1!(Dutch TTF Natural Gas Futures)-Long/Short Idea
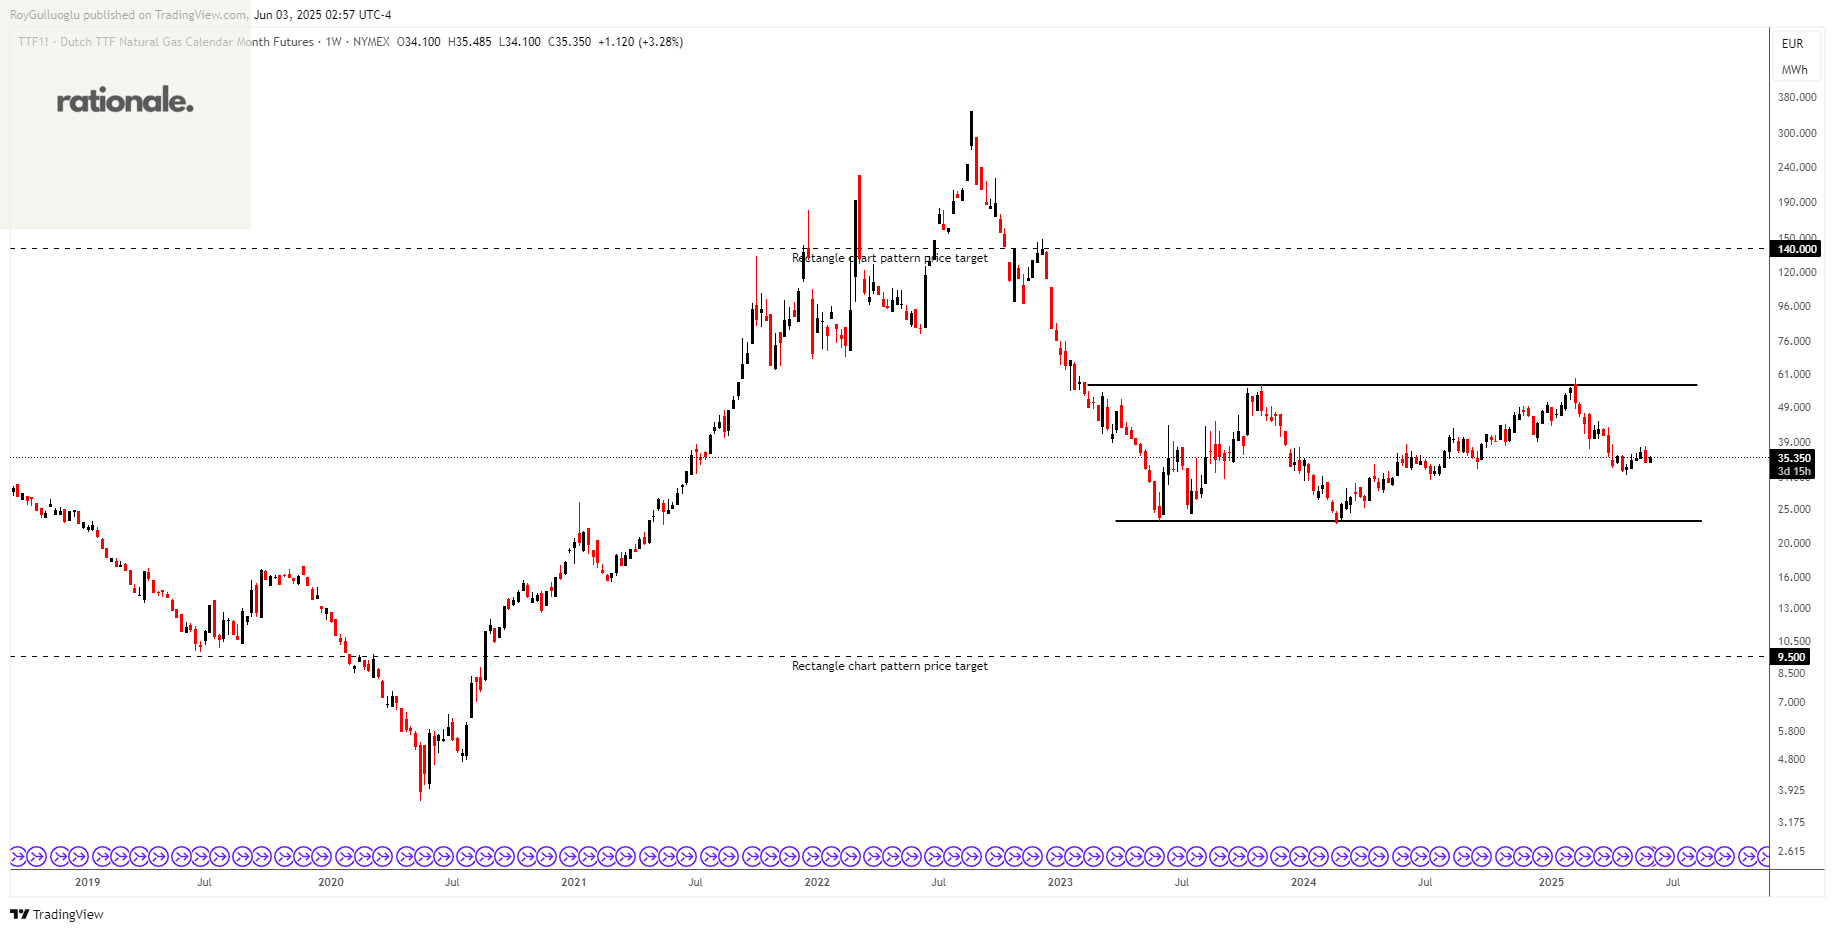
The above weekly chart formed an approximately 25-month-long rectangle chart pattern as a bullish reversal or bearish continuation after a downtrend.
The horizontal boundary at 23.14 levels acts as a support within this pattern, while 56.81 levels act as a resistance.
A daily close below 22.9 levels would validate the breakdown, and a daily close above 57.38 would validate the breakout from the 25-month-long rectangle chart pattern.
Based on the chart patterns, the potential price targets are 9.5 and 140 levels, respectively.