


First Trust NASDAQ Cybersecurity ETF-(CIBR/NASDAQ)-Long/Short Idea
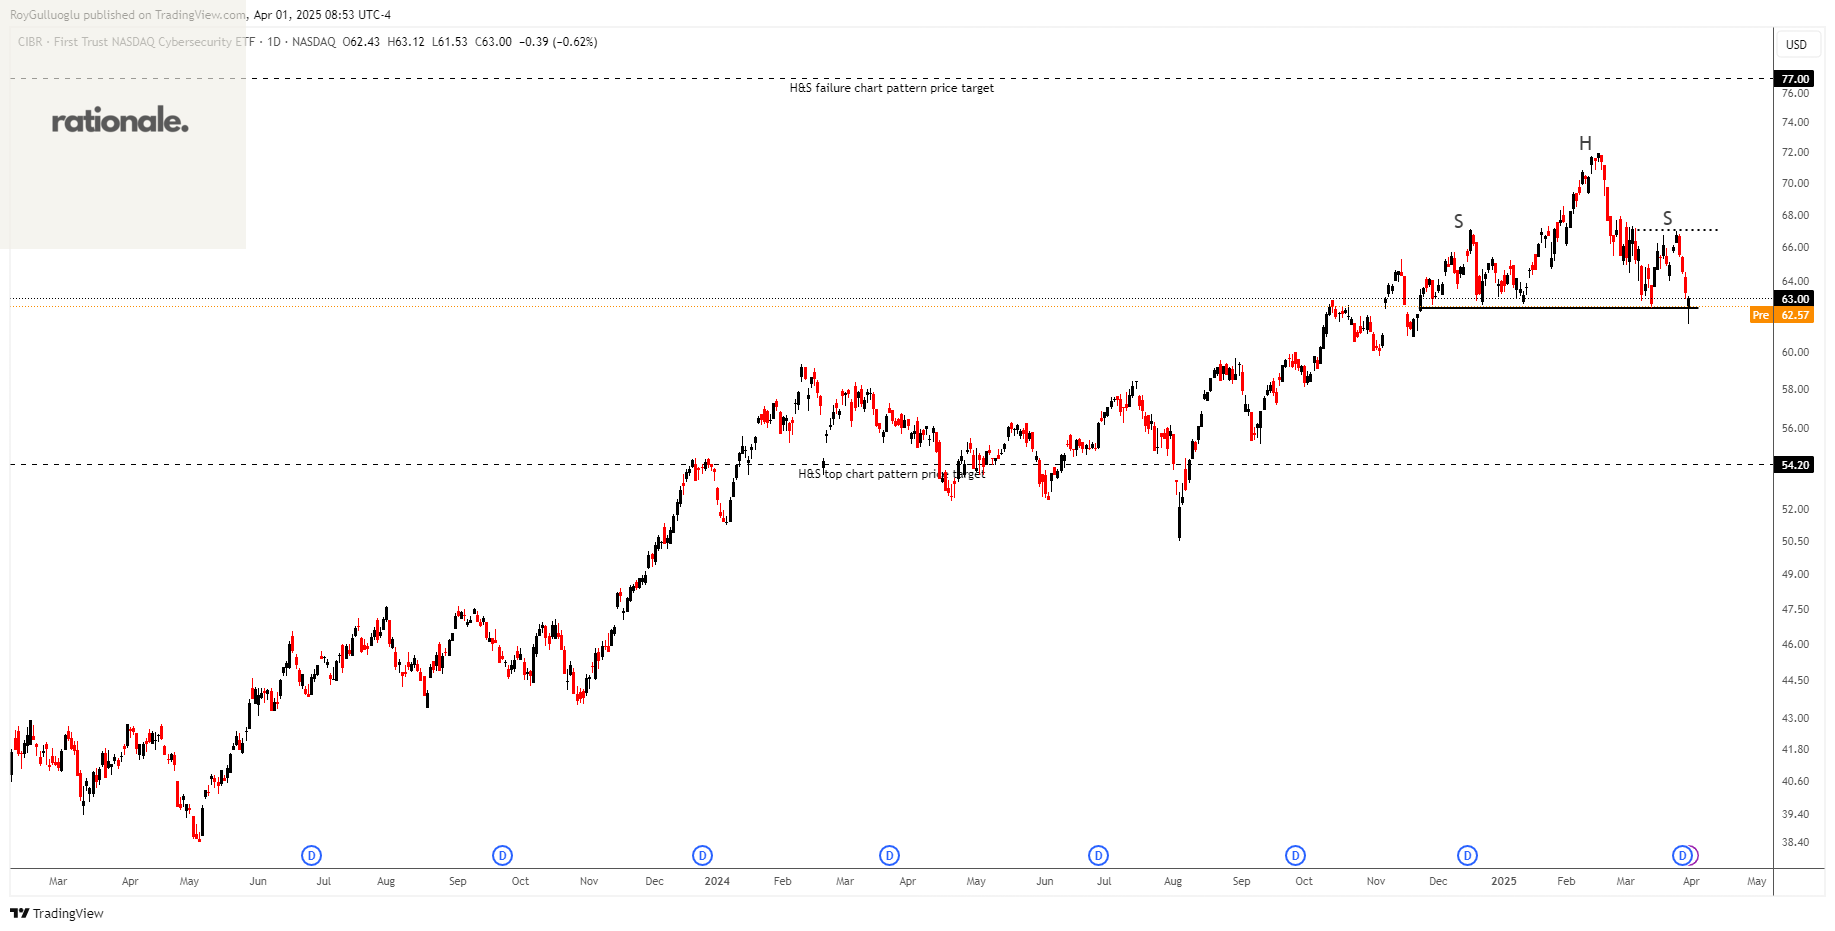
The Fund seeks investment results that correspond generally to the price and yield of an equity index called the Nasdaq CEA Cybersecurity Index.
The above daily chart formed an approximately 3-month-long H&S top chart pattern as a bearish reversal after an uptrend or it might act as a continuation and form an H&S failure chart pattern.
The horizontal boundary at 62.43 levels acts as a support within this pattern while 67.05 levels act as a resistance.
A daily close below 60.56 levels would validate the breakdown from the 3-month-long H&S top chart pattern. A daily close above 69.06 would validate the breakout from the H&S failure chart pattern.
Based on the chart patterns, the potential price targets are 54.2 and 77 levels respectively.
Communication Services Select Sector SPDR Fund-(XLC/NYSE)-Long/Short Idea
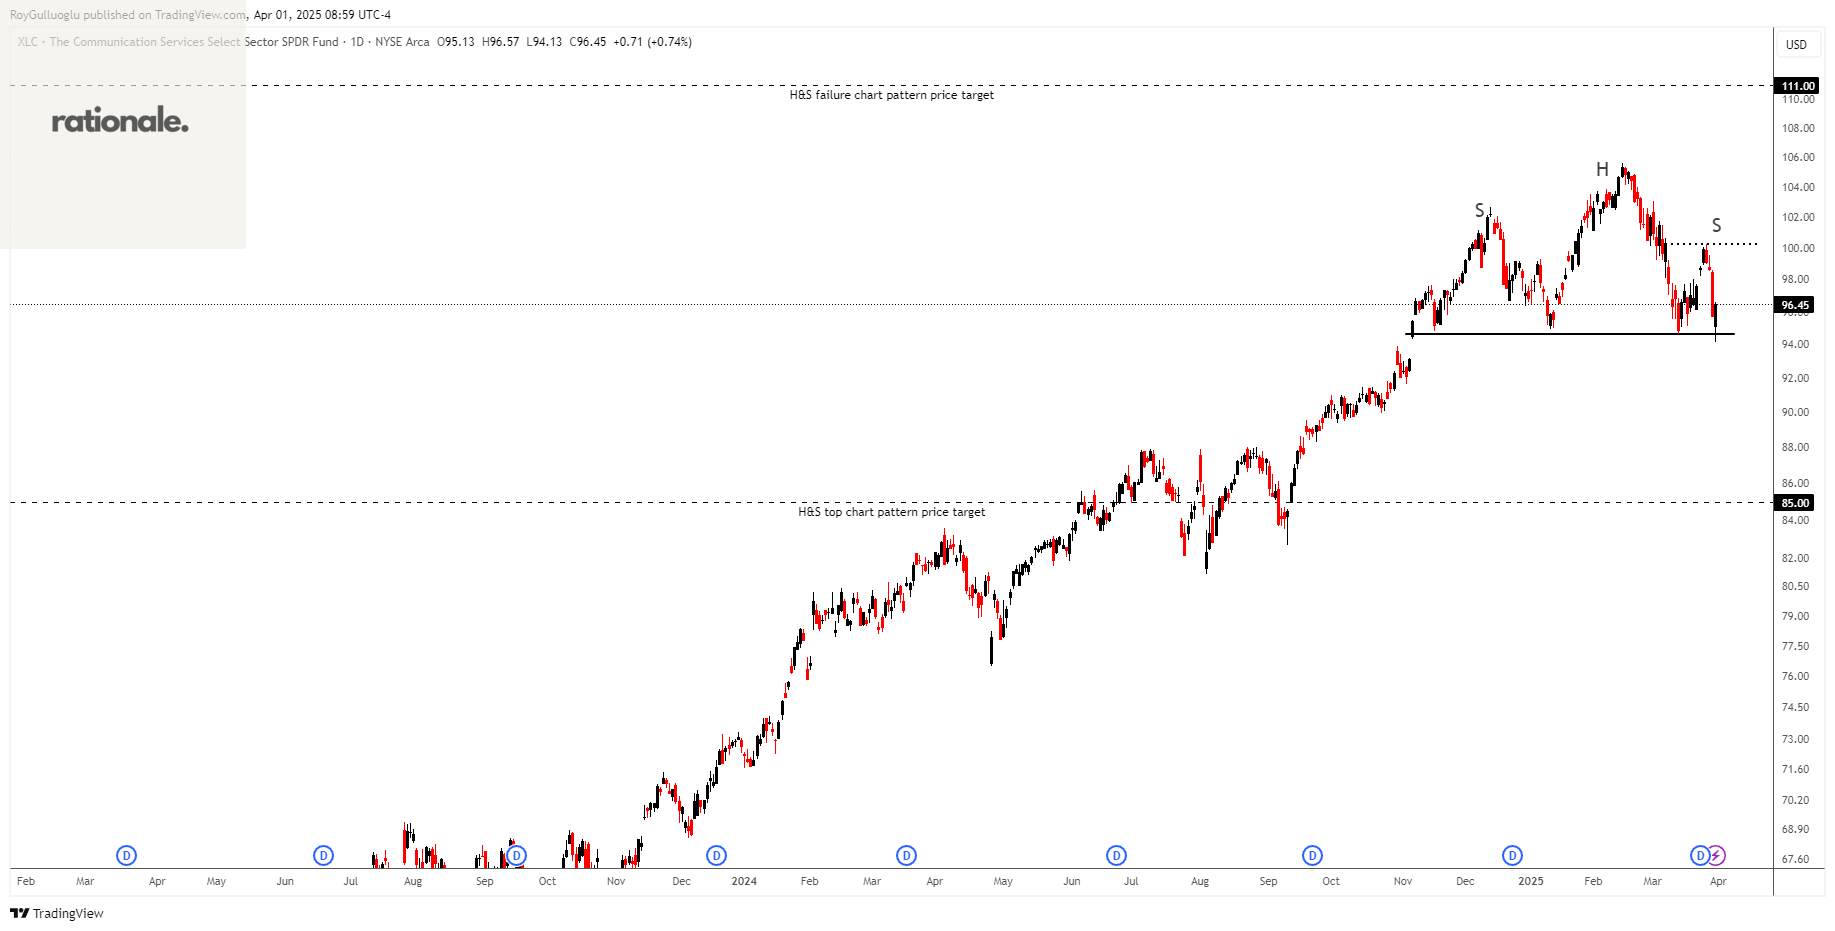
The Fund seeks to provide investment results that, before expenses, correspond generally to the price and yield performance of publicly traded equity securities of companies in the Communication Services Select Sector Index.
The above daily chart formed an approximately 3-month-long H&S top chart pattern as a bearish reversal after an uptrend or it might act as a continuation and form an H&S failure chart pattern.
The horizontal boundary at 94.62 levels acts as a support within this pattern while 100.23 levels act as a resistance.
A daily close below 91.78 levels would validate the breakdown from the 3-month-long H&S top chart pattern. A daily close above 103.23 would validate the breakout from the H&S failure chart pattern.
Based on the chart patterns, the potential price targets are 85 and 111 levels respectively.
Teşekkürler Roy