

Trade Ideas Fx-Futures-Etf-Crypto
BTCUSDT, XRPUSDT, MXNJPY), ACWI(NASDAQ)

BTCUSDT-Long/Short Idea
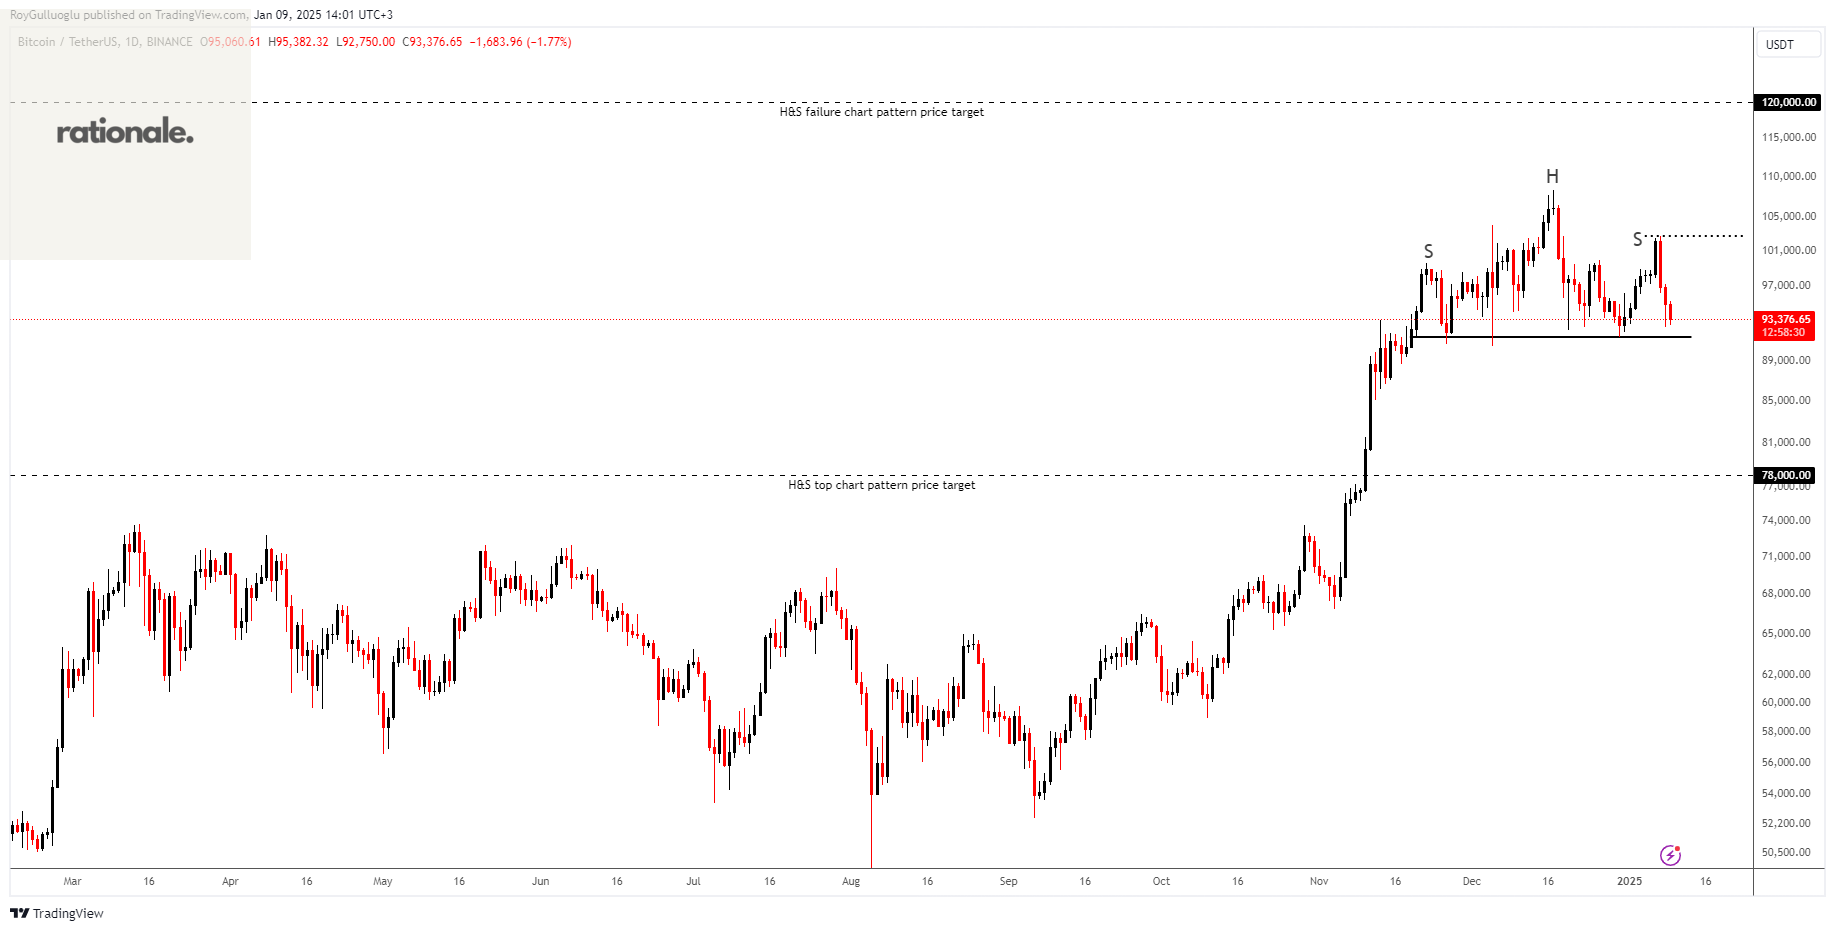
The above daily chart formed an approximately 2-month-long H&S top chart pattern as a bearish reversal after an uptrend or it might act as a continuation and form an H&S failure chart pattern.
The horizontal boundary at 91530 levels acts as a support within this pattern while 102785 levels act as a resistance.
A daily close below 88800 levels would validate the breakdown from the 2-month-long H&S top chart pattern. A daily close above 105800 would validate the breakout from the H&S failure chart pattern.
Based on the chart patterns, the potential price targets are 78000 and 120000 levels respectively.
XRPUSDT-Long Idea
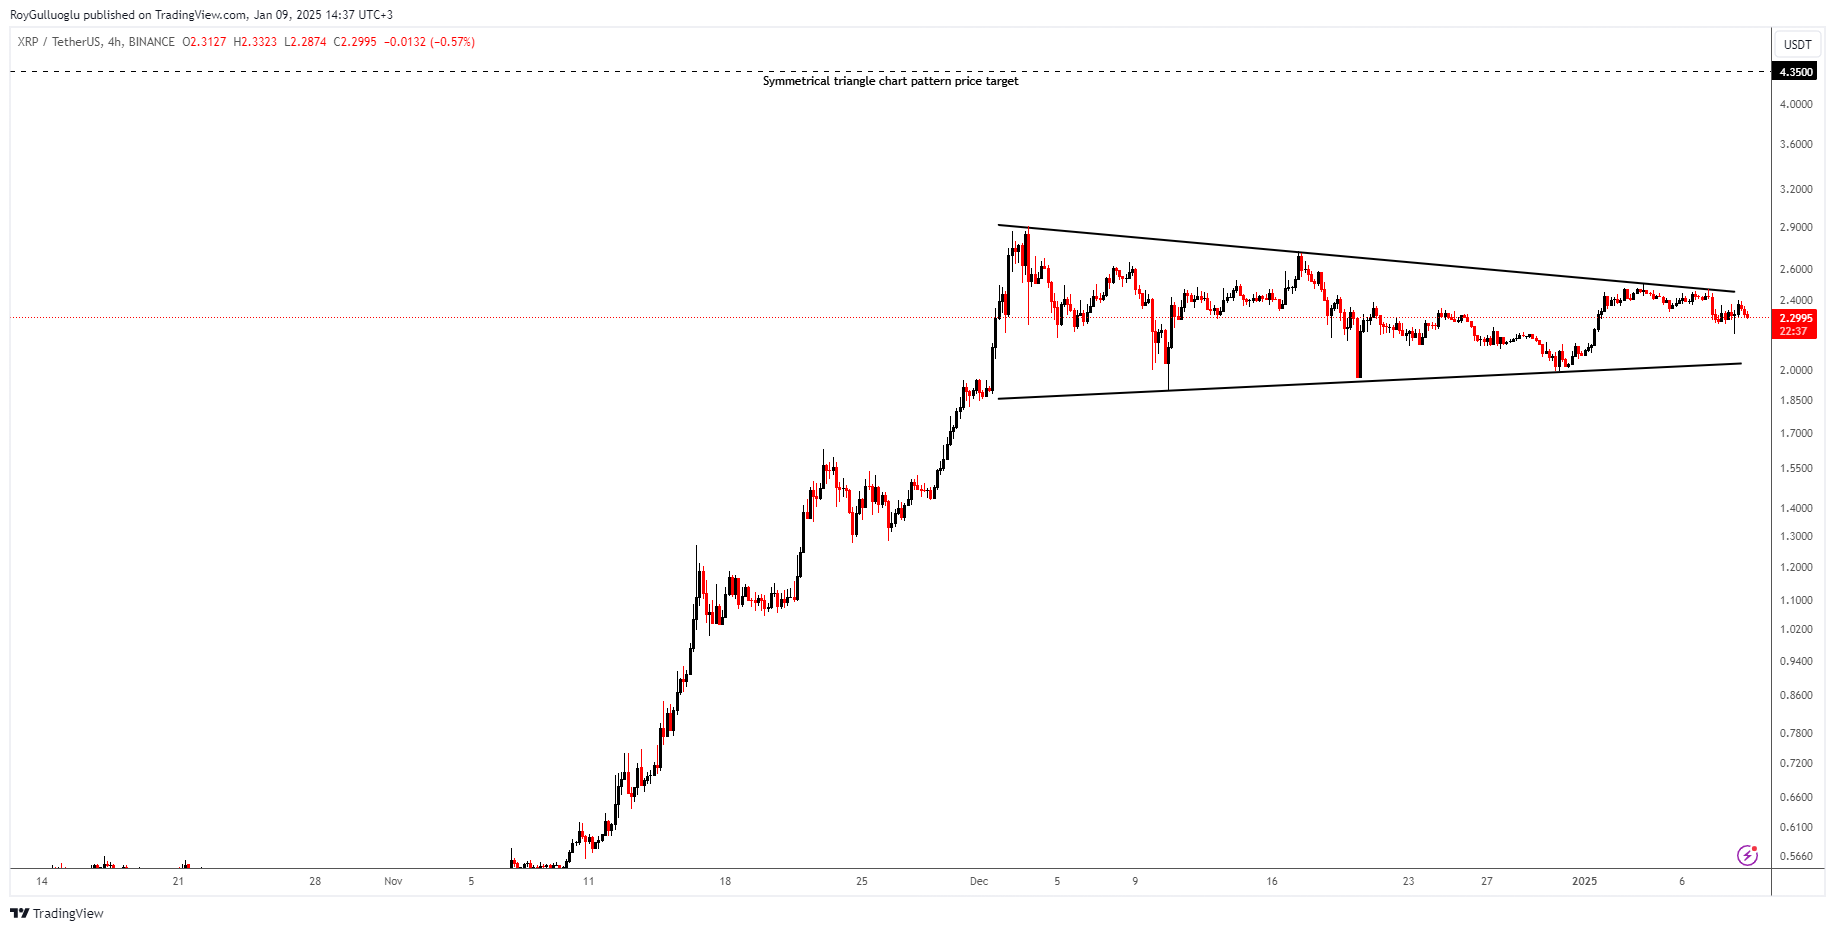
The above 4-hour chart formed a symmetrical triangle chart pattern as a bullish continuation after an uptrend.
A daily close above 2.55 levels would validate the breakout from the above symmetrical triangle chart pattern.
Based on this chart pattern, the potential price target is approximately 4.35 levels.
MXNJPY-Long Idea

The above weekly chart formed an approximately 22-month-long ascending triangle chart pattern as a bullish reversal after a downtrend.
The horizontal boundary at 7.79 levels acts as a resistance within this pattern.
A daily close above 7.87 levels would validate the breakout from the 22-month-long ascending triangle chart pattern.
Based on this chart pattern, the potential price target is approximately 8.6 levels.
Japan's modest growth and stable inflation keep the Bank of Japan dovish, supporting a weaker yen through accommodative policies. Meanwhile, the Mexican peso needs to remain relatively hawkish amid a strong USD environment driven by potential Trump-era tariffs, maintaining its appeal to investors.
iShares MSCI ACWI ETF-(ACWI/NASDAQ)-Long/Short Idea
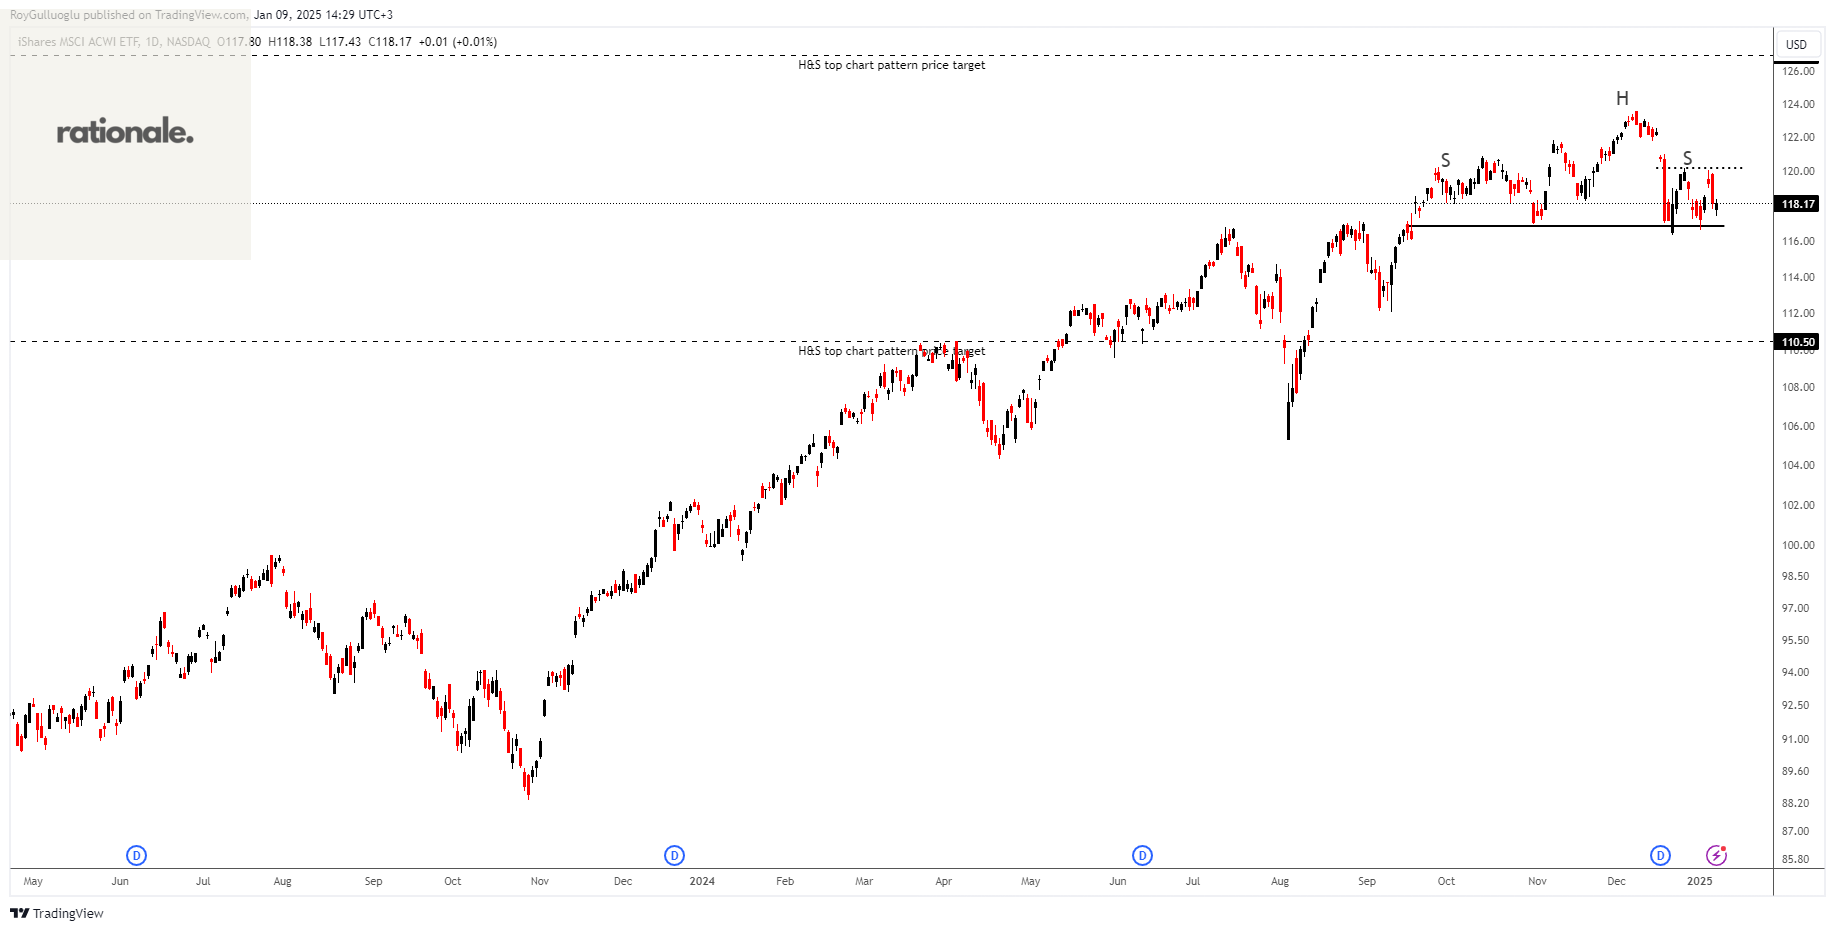
The above daily chart formed an approximately 3-month-long H&S top chart pattern as a bearish reversal after an uptrend or it might act as a continuation and form an H&S failure chart pattern.
The horizontal boundary at 116.9 levels acts as a support within this pattern while 120.2 levels act as a resistance.
A daily close below 115.7 levels would validate the breakdown from the 3-month-long H&S top chart pattern. A daily close above 121.5 would validate the breakout from the H&S failure chart pattern.
Based on the chart patterns, the potential price targets are 110.5 and 127 levels respectively.