


NKD1!(Nikkei USD Futures)-Long Idea
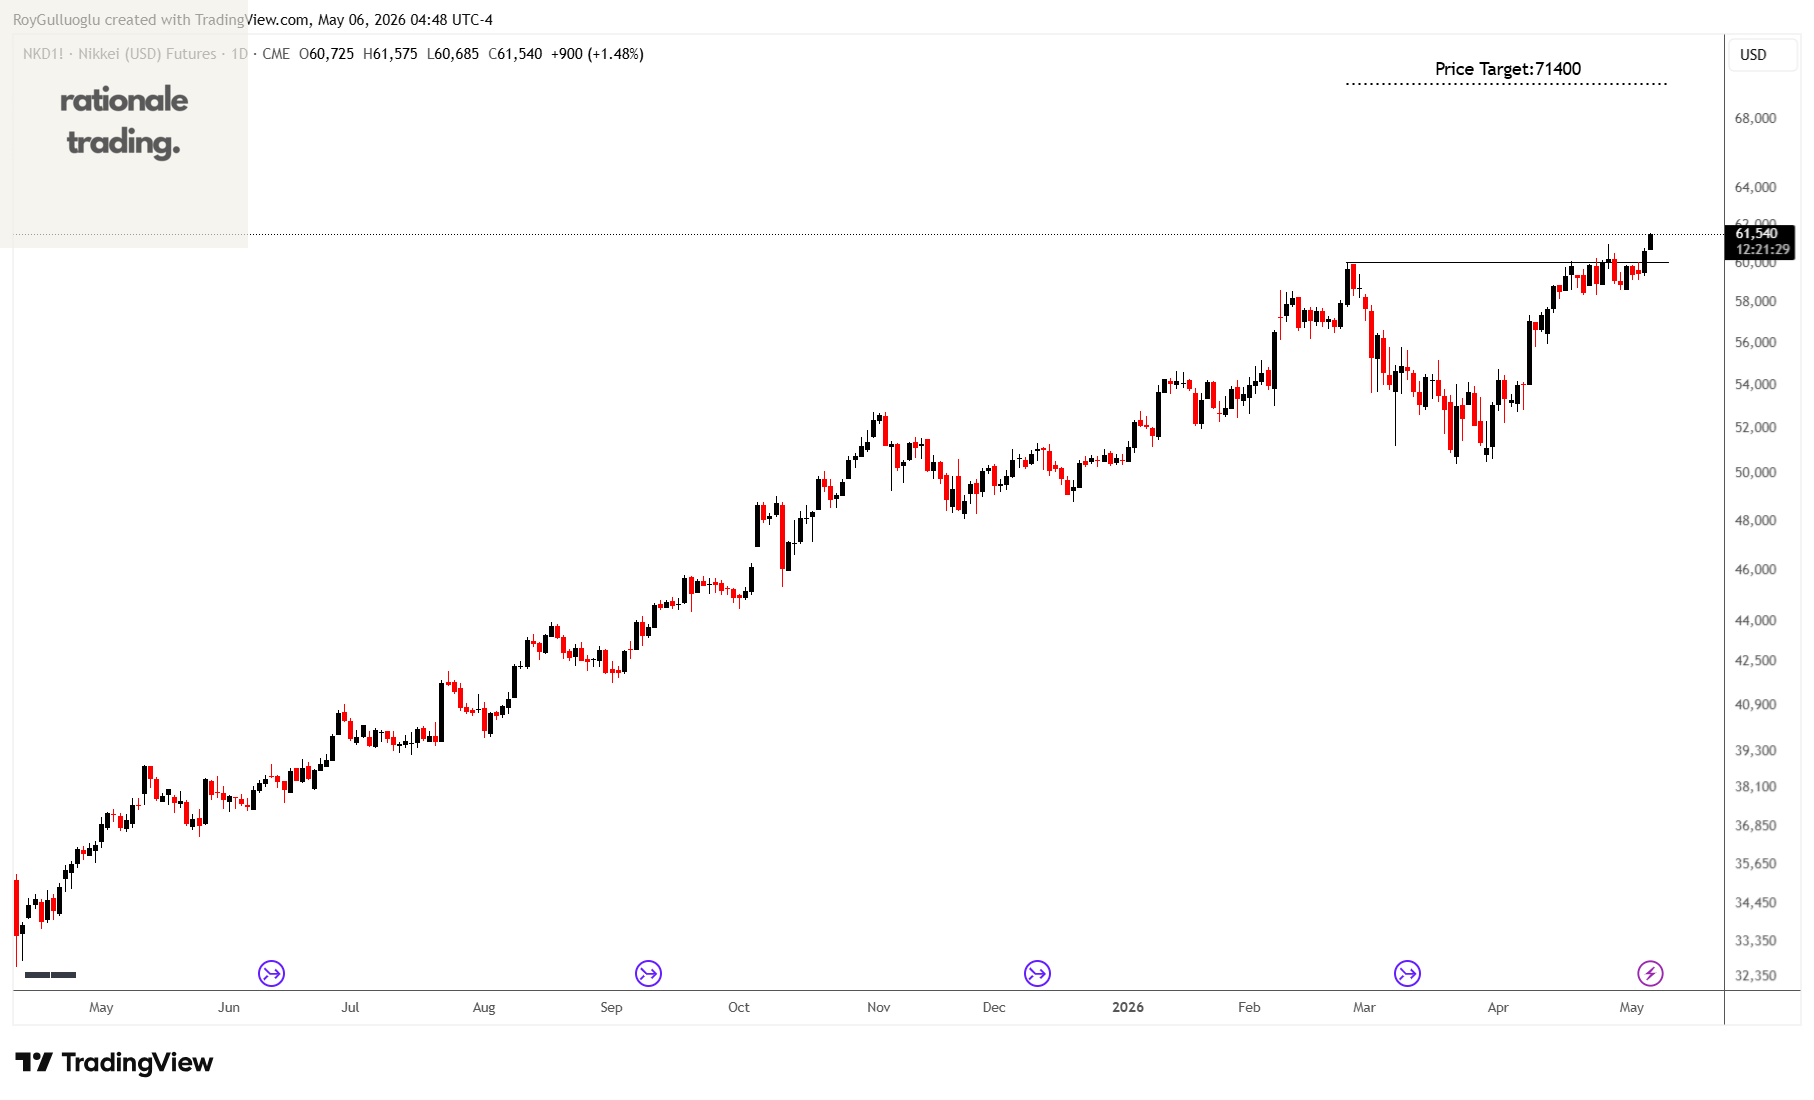
The above daily chart formed an approximately 2-month-long cup & handle chart pattern as a bullish continuation after an uptrend.
The horizontal boundary at 60080 levels acts as a resistance within this pattern.
A daily close above 61800 levels would validate the breakout from the 2-month-long cup & handle chart pattern.
Based on this chart pattern, the potential price target is approximately 71400 levels.
CHFJPY-Long Idea
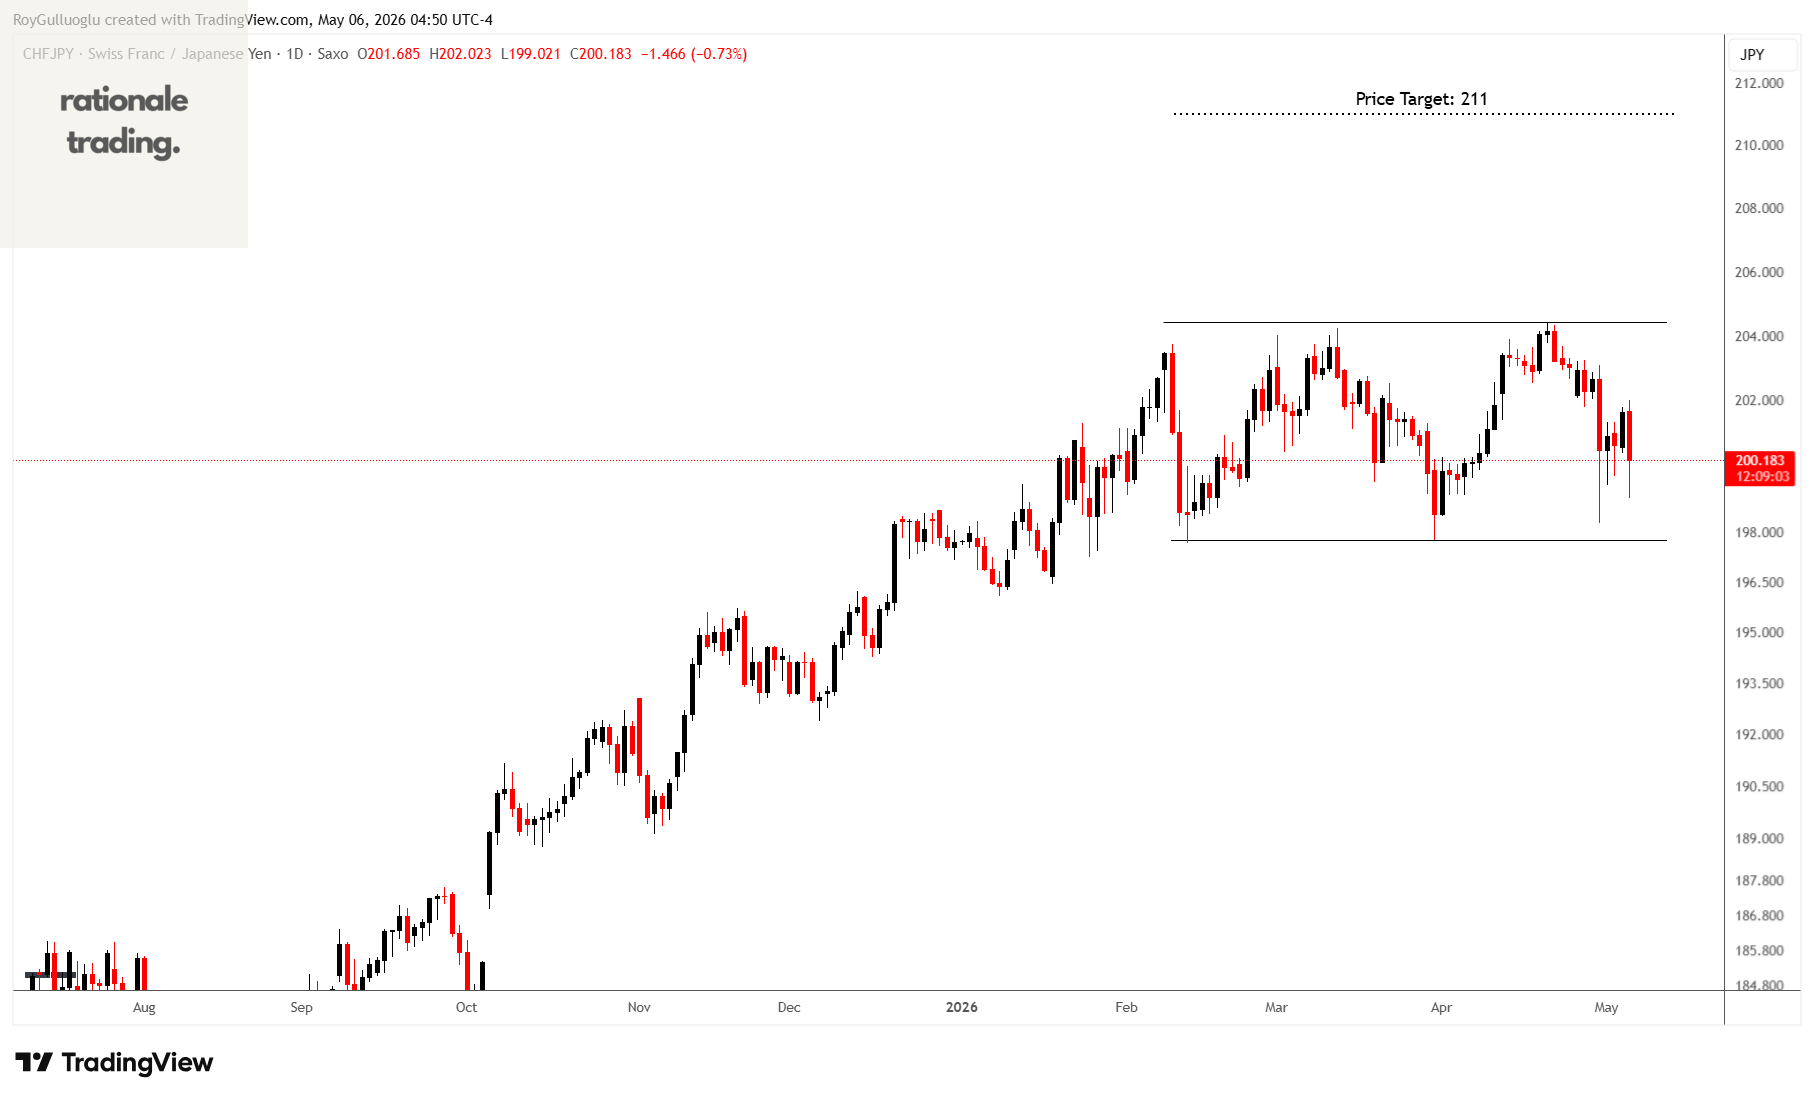
The above daily chart formed an approximately 2-month-long rectangle chart pattern as a bullish continuation after an uptrend.
The horizontal boundary at 204.4 levels acts as a resistance within this pattern.
A daily close above 205.2 levels would validate the breakout from the 2-month-long rectangle chart pattern.
Based on this chart pattern, the potential price target is approximately 211 levels.
MOO(VanEck Agribusiness ETF)-Long Idea
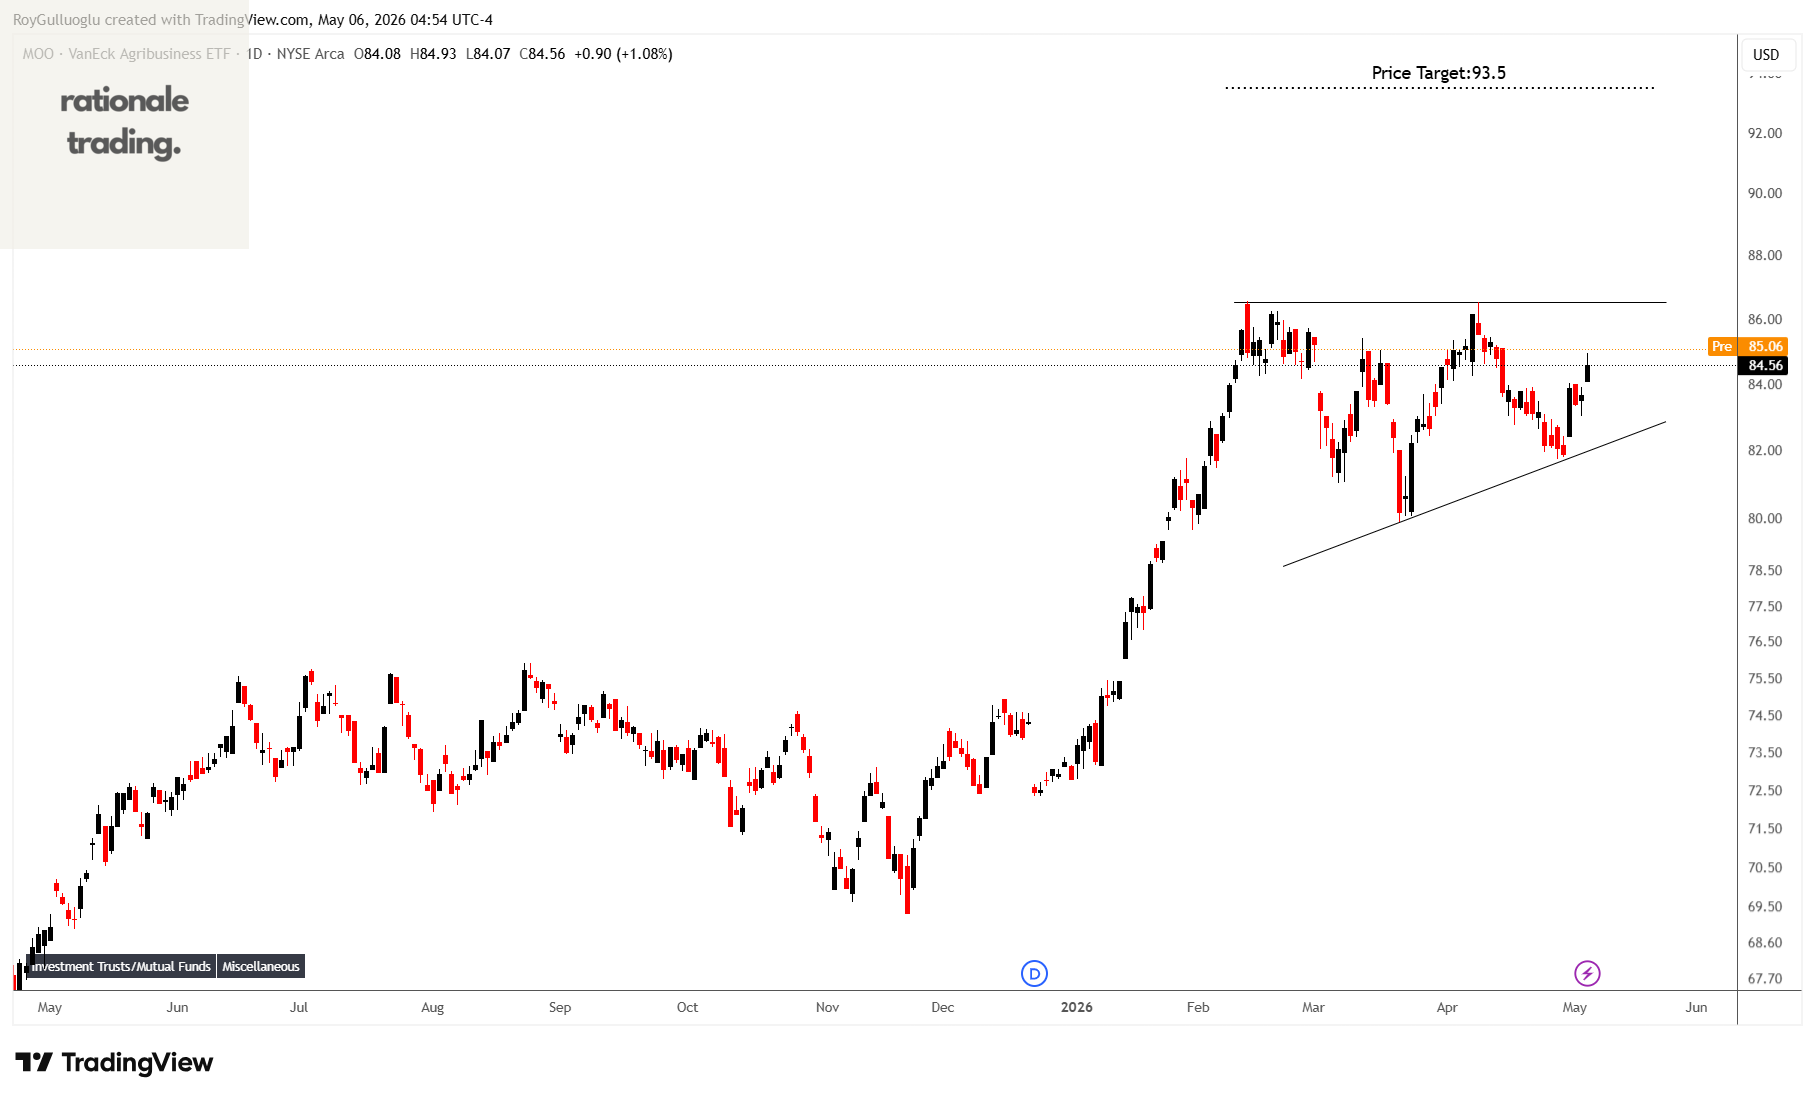
The above daily chart formed an approximately 2-month-long ascending triangle chart pattern as a bullish continuation after an uptrend.
The horizontal boundary at 86.5 levels acts as a resistance within this pattern.
A daily close above 89 levels would validate the breakout from the 2-month-long ascending triangle chart pattern.
Based on this chart pattern, the potential price target is approximately 93.5 levels.
LTCUSD-Long Idea
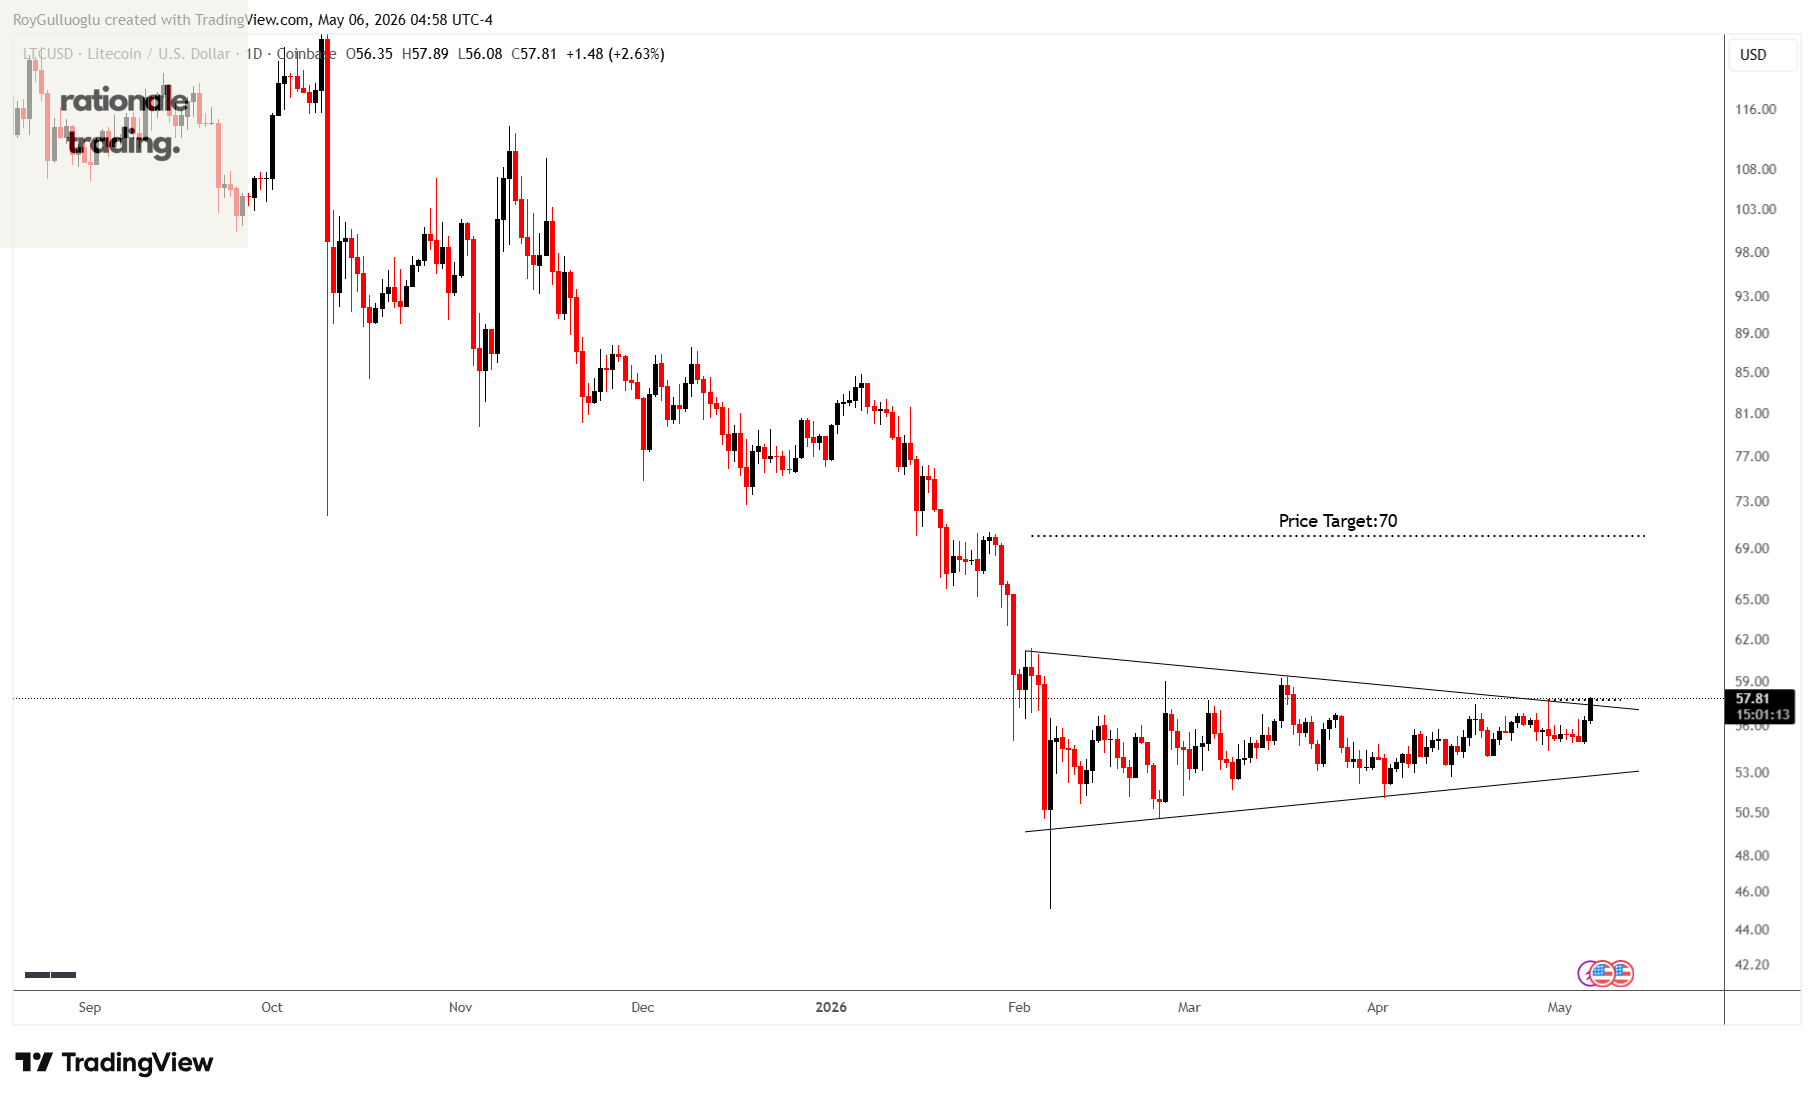
The above daily chart formed an approximately 3-month-long symmetrical triangle chart pattern as a bullish reversal after a downtrend.
The horizontal boundary at 57.68 levels acts as a resistance within this pattern.
A daily close above 59.4 levels would validate the breakout from the 3-month-long symmetrical triangle chart pattern.
Based on this chart pattern, the potential price target is approximately 70 levels.