


iShares 1-3 Year Treasury Bond ETF-(SHY/NASDAQ)-Long Idea
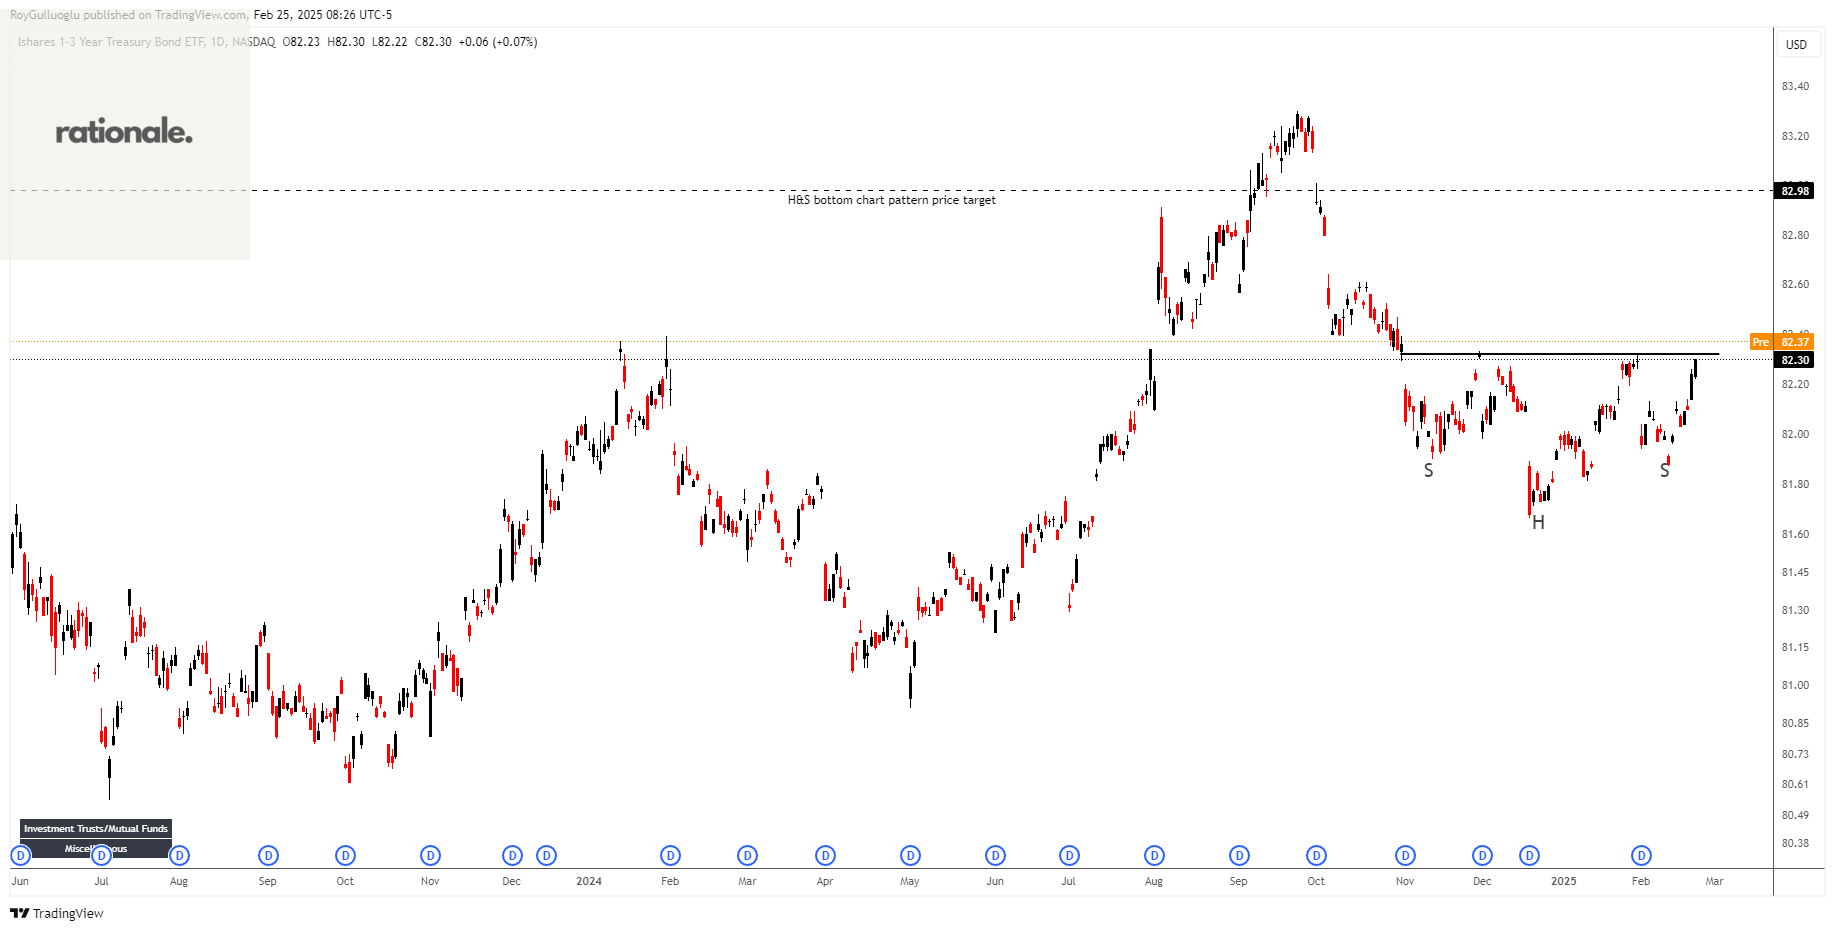
The iShares 1-3 Year Treasury Bond ETF seeks to track the investment results of an index composed of U.S. Treasury bonds with remaining maturities between one and three years.
The above daily chart formed an approximately 3-month-long H&S bottom chart pattern as a bullish reversal after a downtrend.
The horizontal boundary at 82.32 levels acts as a resistance within this pattern.
A daily close above 82.37(ATR(10/30)/2+boundary) levels would validate the breakdown from the 3-month-long H&S bottom chart pattern.
Based on this chart pattern, the potential price target is approximately 82.98 levels.
ZW1!(Wheat Futures)-Long Idea
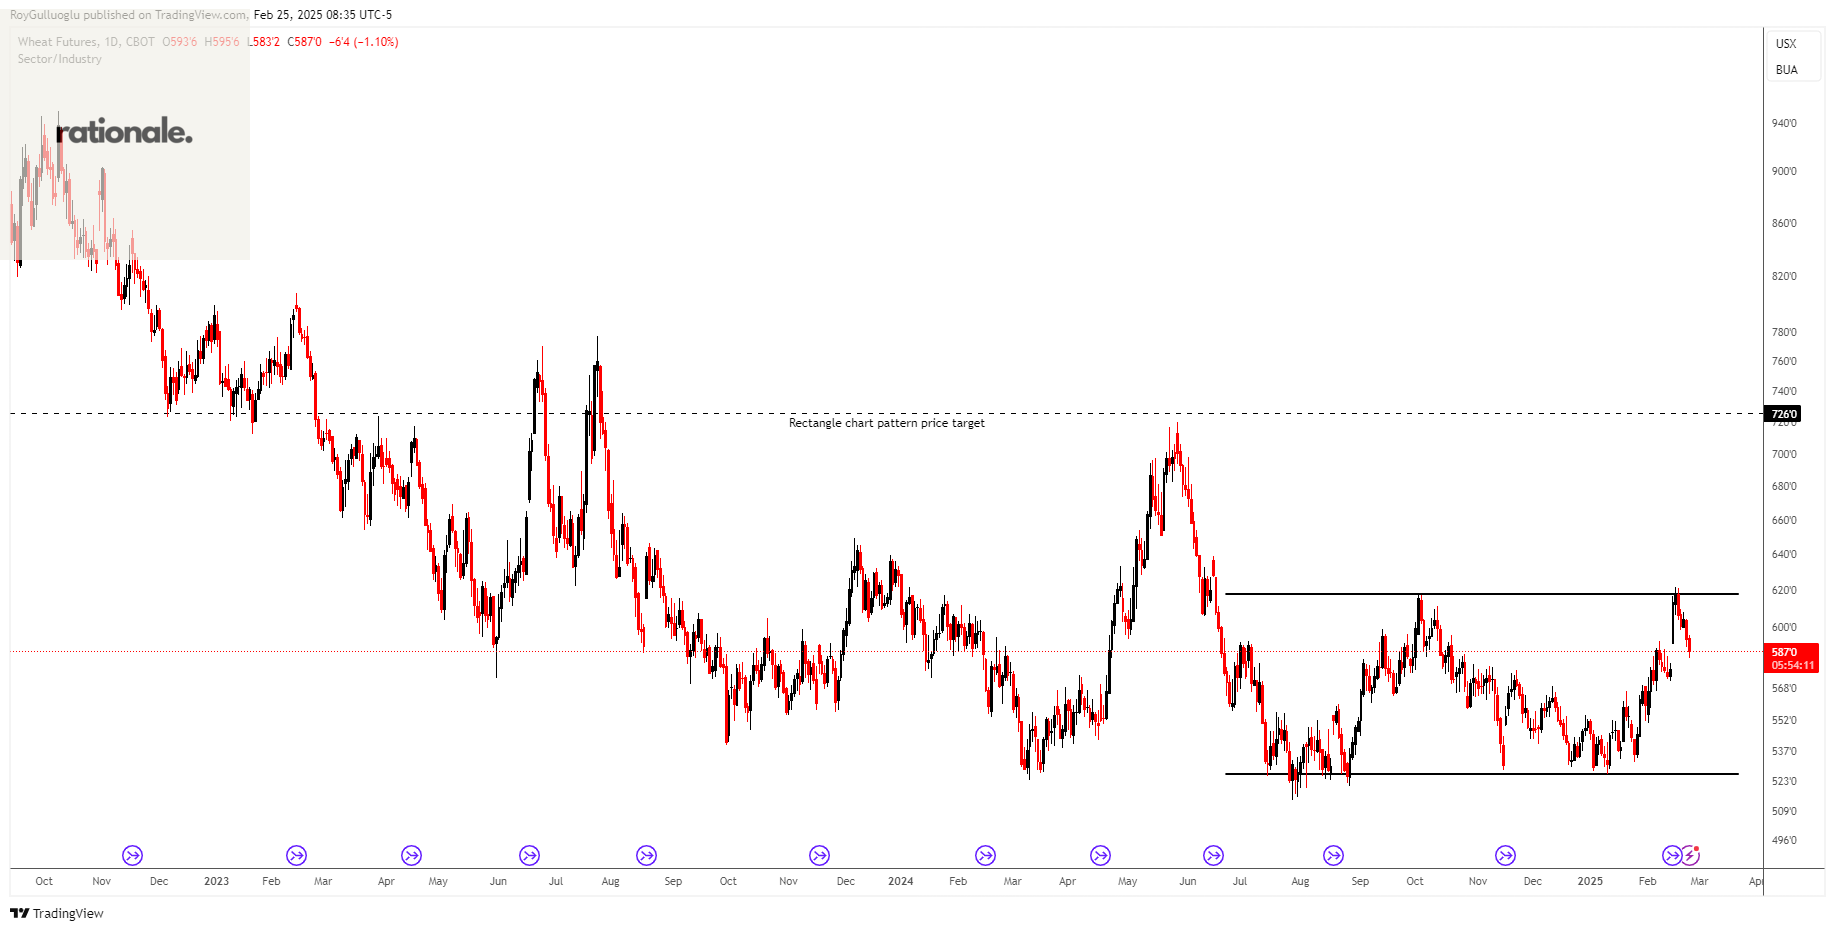
The above daily chart formed an approximately 5-month-long rectangle chart pattern as a bullish reversal after a downtrend.
A daily close above 627(%1 or %1.5 low of the support for FX, Futures) levels would validate the breakout from the 5-month-long rectangle chart pattern.
Based on this chart pattern, the potential price target is approximately 726 levels.
GBPAUD-Long Idea
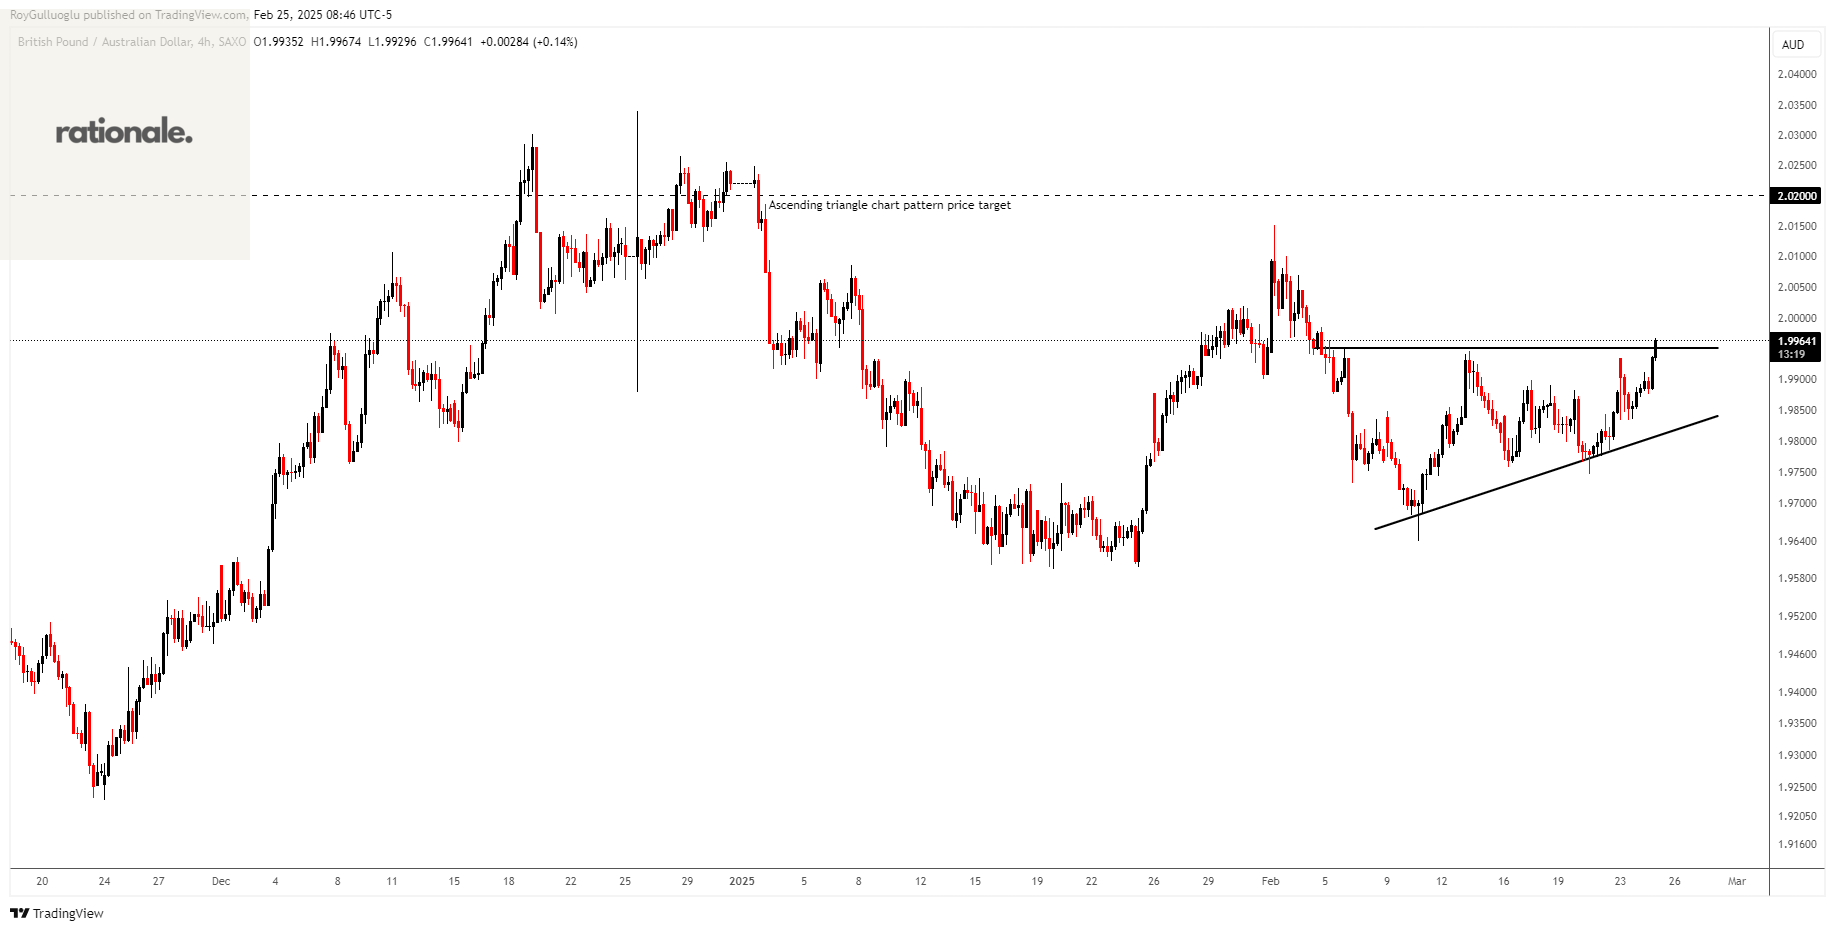
The above 4H chart formed an ascending triangle chart pattern as a bullish reversal after a downtrend.
The horizontal boundary at 1.995 levels acts as a resistance within this pattern.
A daily close above 1.9975(ATR(10/30)/2+boundary) levels would validate the breakout from the ascending triangle chart pattern.
Based on this chart pattern, the potential price target is approximately 2.02 levels.