


SOLUSDT-Long/Short Idea
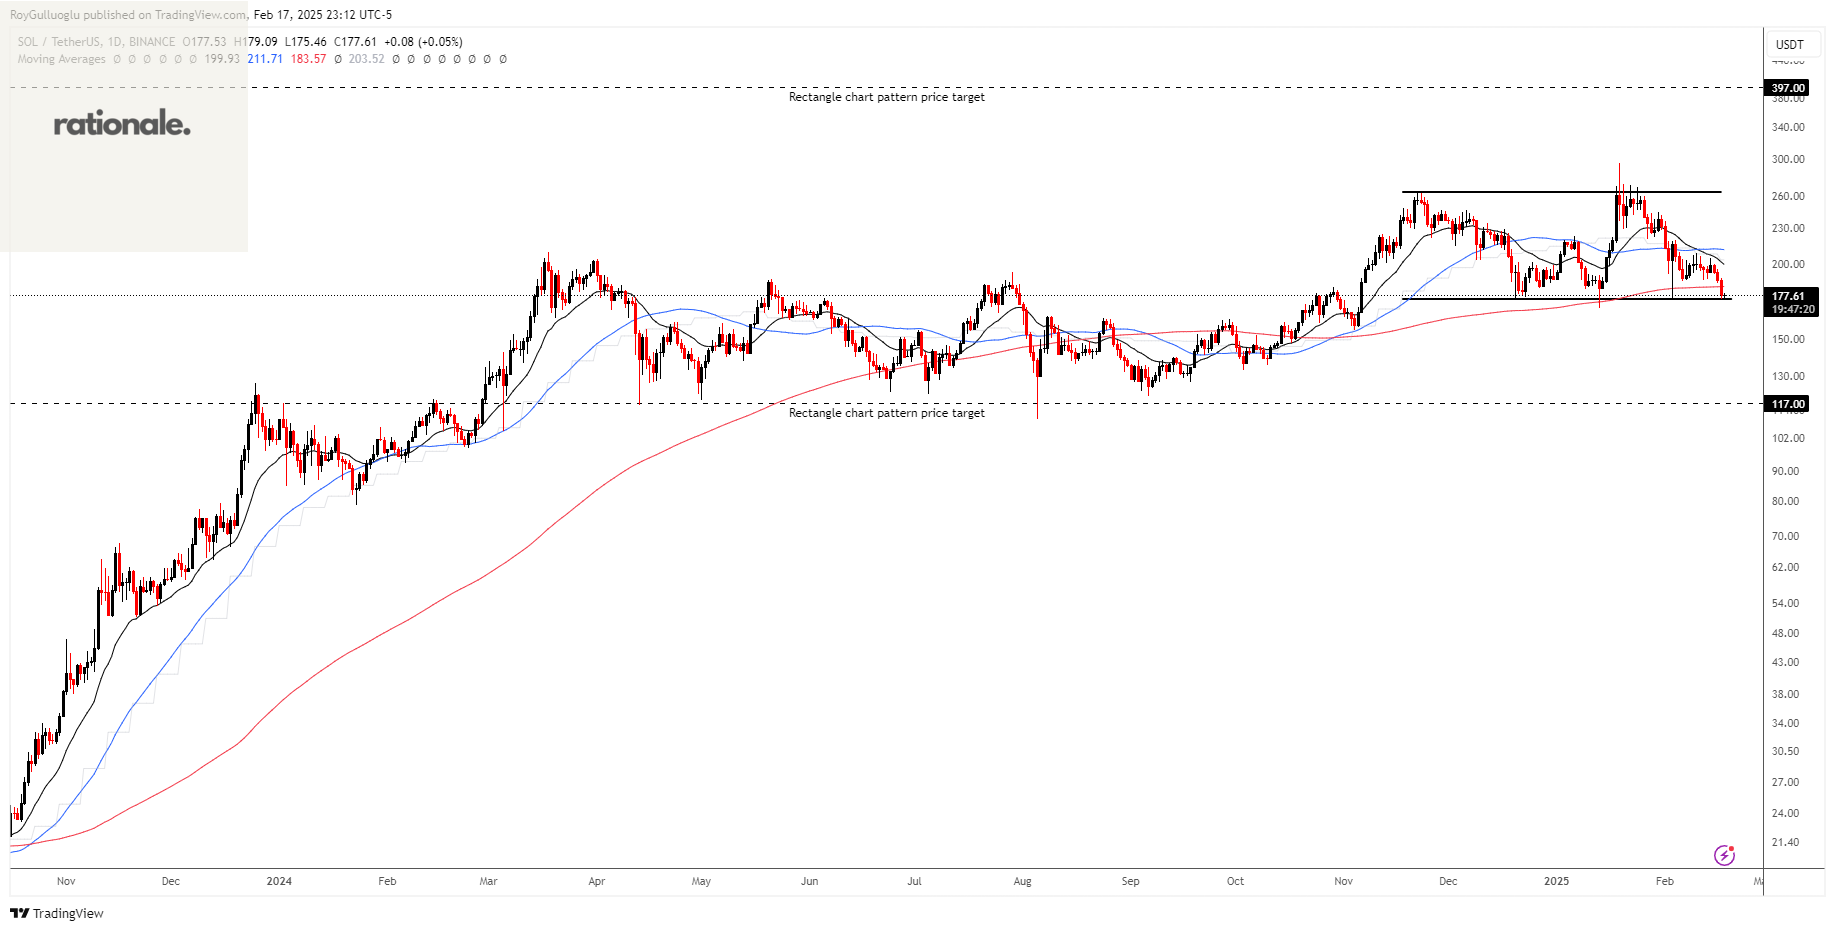
Solana dropped below the 200-day moving average, reinforcing the bearish outlook. However, with support from the Trump administration and the expected rate cut path, overall sentiment on crypto remains neutral at worst, with dips still being bought. Given this, I'm preparing for both potential scenarios.
The above daily Solana chart formed an approximately 3-month-long rectangle chart pattern as a bearish reversal or bullish continuation after an uptrend.
The horizontal boundary at 177.2 levels acts as a support within this pattern while 264.95 levels act as a resistance.
A daily close below 171.85 levels would validate the breakdown and a daily close above 272.9 would validate the breakout from the 3-month-long rectangle chart pattern.
Based on the chart patterns, the potential price targets are 117 and 397 levels respectively.
LTCUSDT-Long Idea
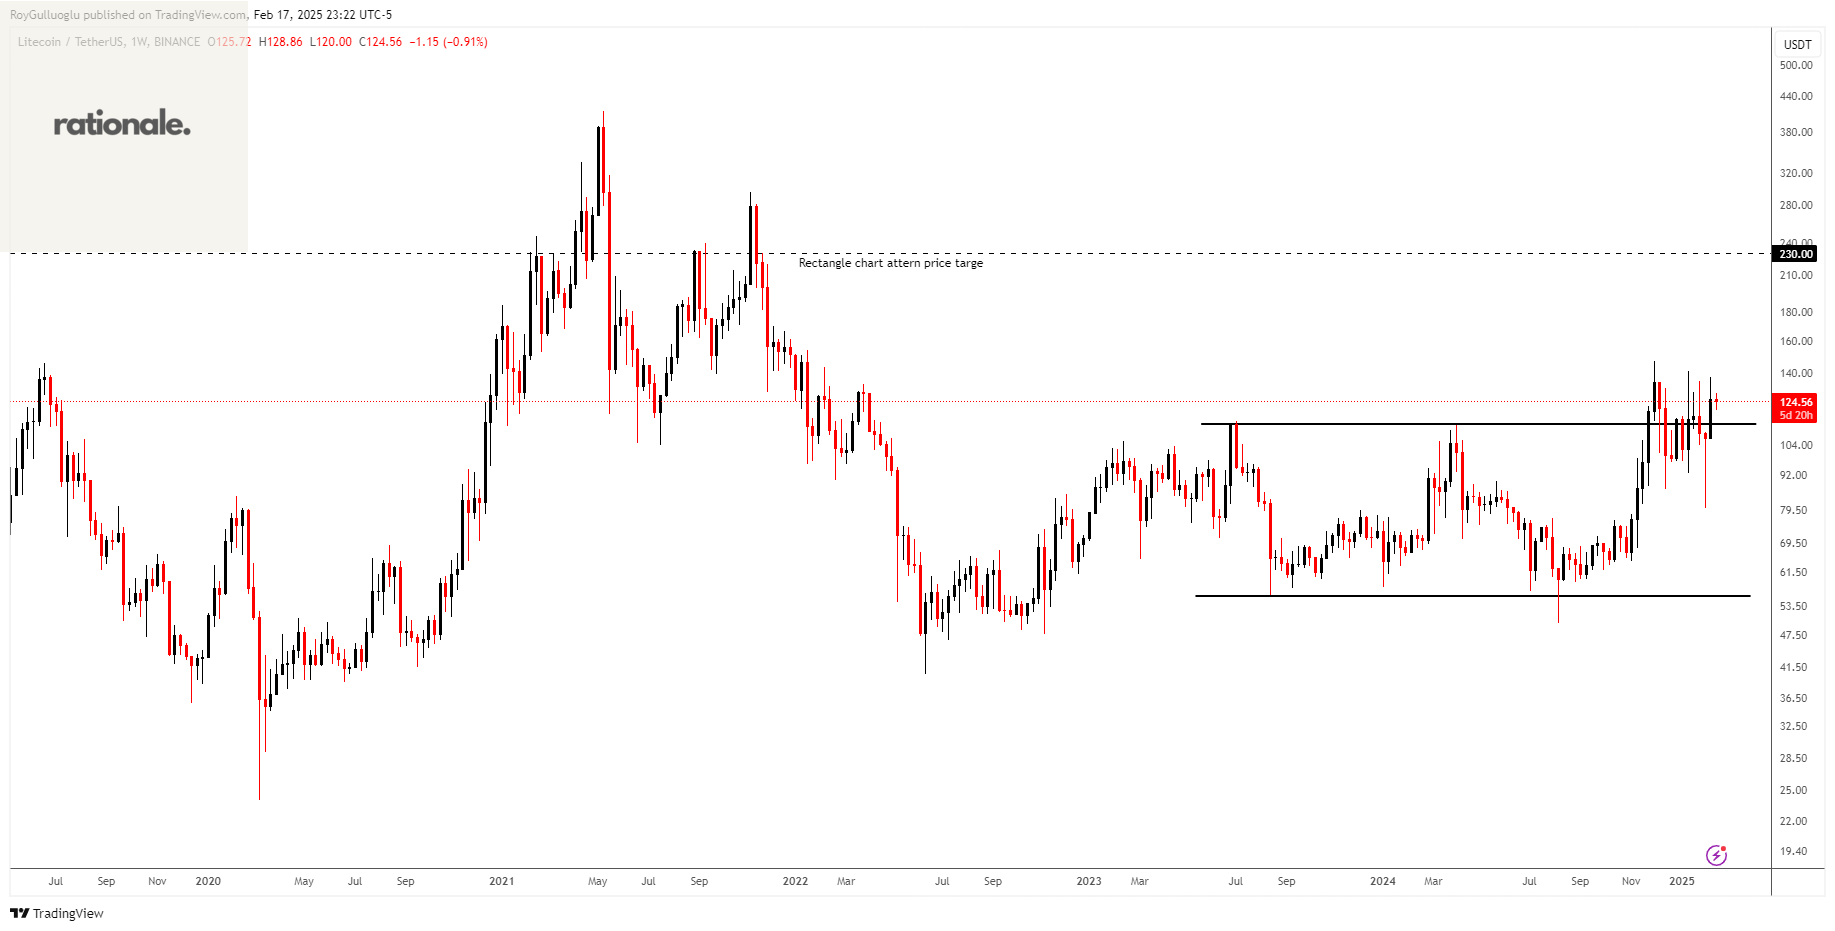
The above weekly chart formed an approximately 20-month-long rectangle chart pattern as a bullish continuation after an uptrend.
The horizontal boundary at 113.43 levels acts as a resistance within this pattern.
A daily close above 116.83 levels would validate the breakout from the 20-month-long rectangle chart pattern.
Based on this chart pattern, the potential price target is approximately 230 levels
NZDCHF-Long Idea
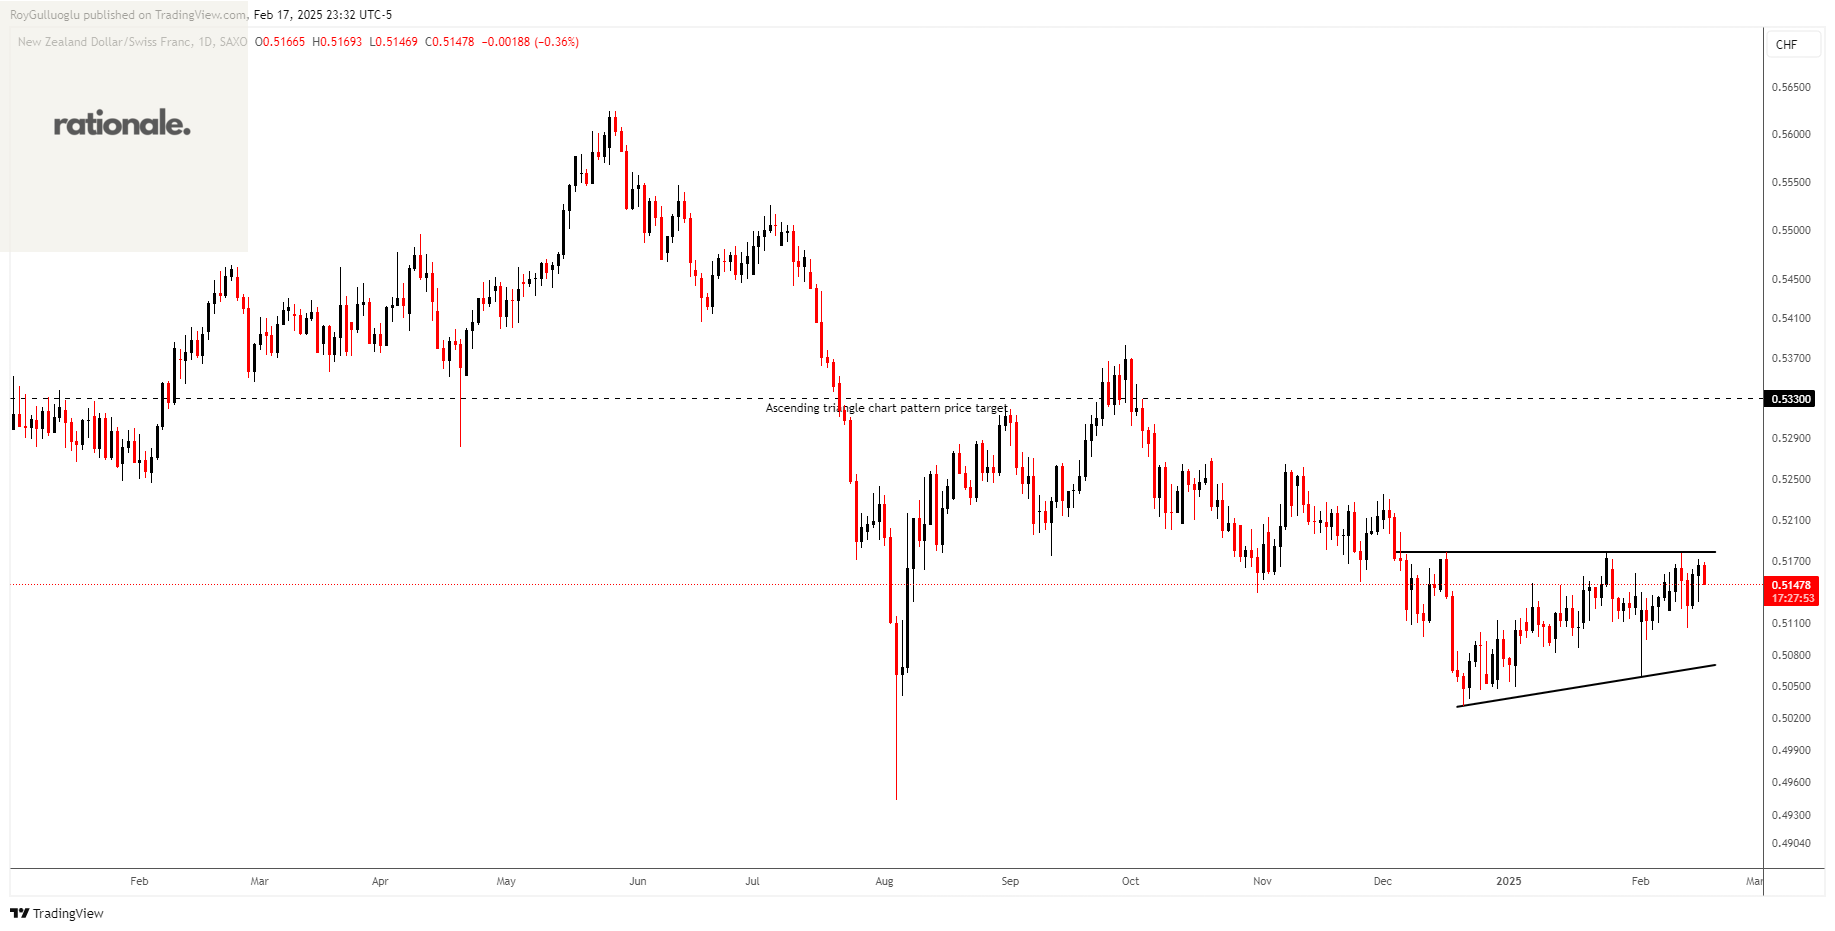
The above daily chart formed an approximately 2-month-long ascending triangle chart pattern as a bullish reversal after a downtrend.
The horizontal boundary at 0.51786 levels acts as a resistance within this pattern.
A daily close above 0.523 levels would validate the breakout from the 2-month-long ascending triangle chart pattern.
Based on this chart pattern, the potential price target is approximately 0.533 levels.
VN301!(Vietnam Index Futures)-Long Idea
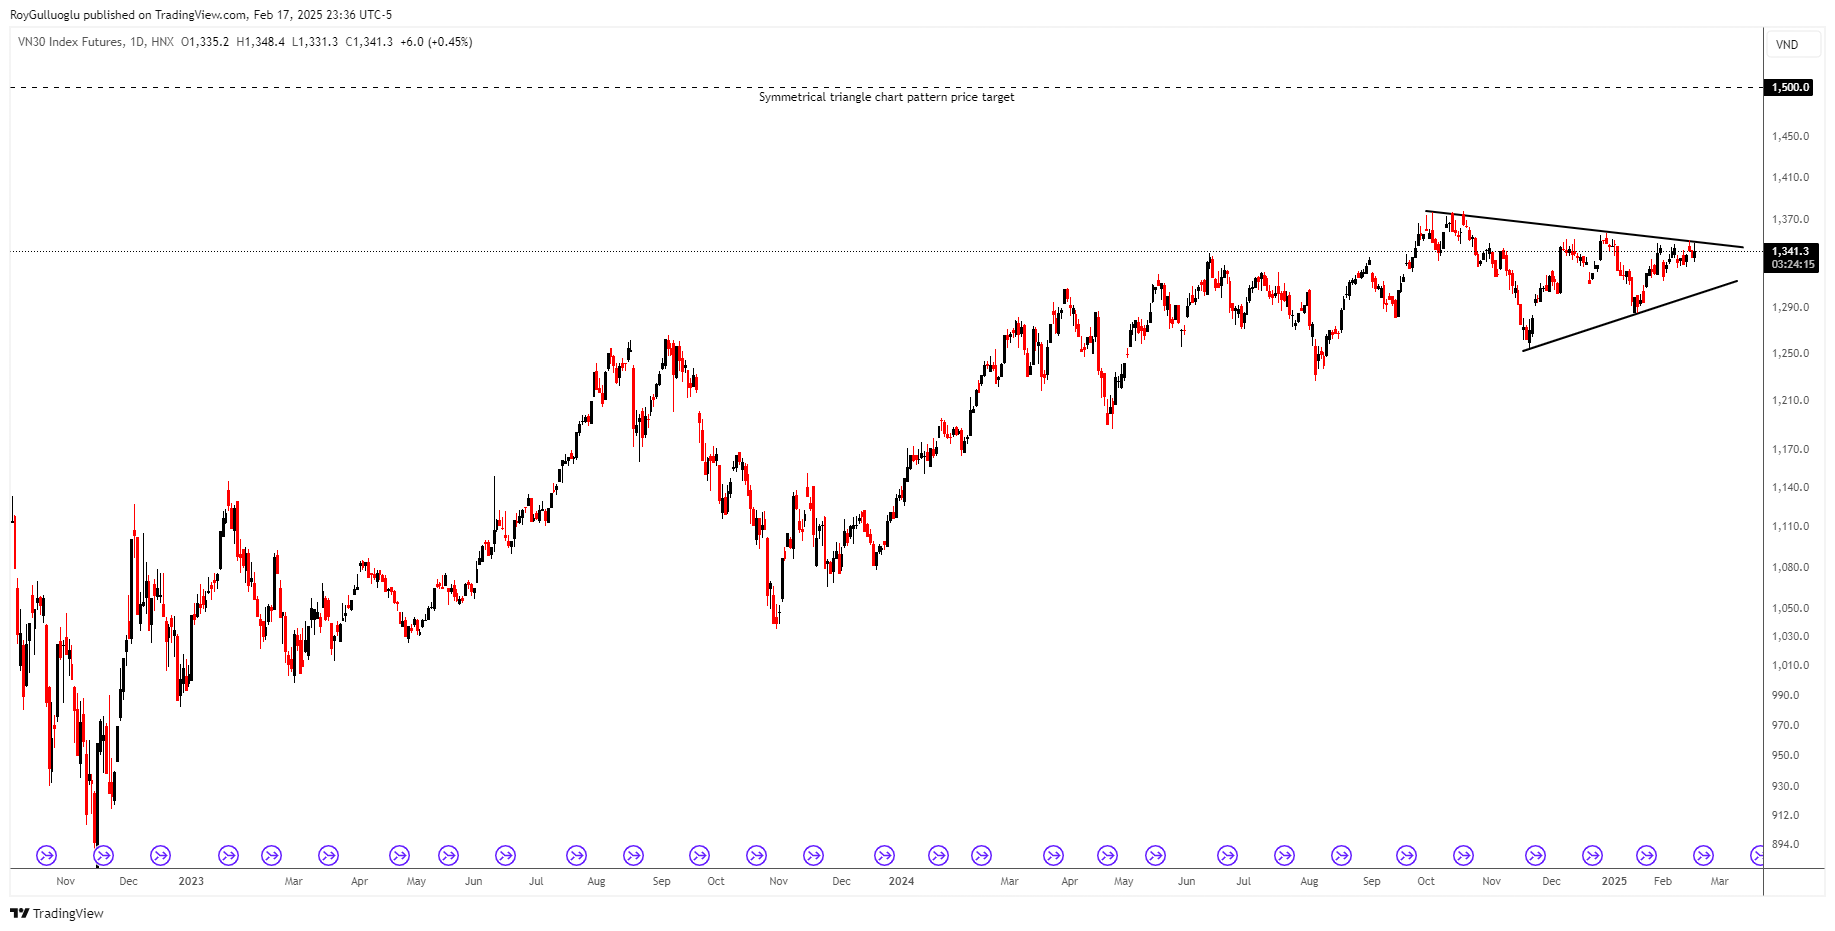
The above daily chart formed an approximately 3-month-long symmetrical triangle chart pattern as a bullish continuation after an uptrend.
A daily close above 1361.8(%1 or %1.5 low of the support for FX, Futures) levels would validate the breakout from the 3-month-long symmetrical triangle chart pattern.
Based on this chart pattern, the potential price target is approximately 1500 levels.