

Trade Ideas Fx-Futures-Etf-Crypto
ZL1!(CBOT), CC1!(ICEUS), CL1!(NYMEX), USDCHF

ZL1!(Soybean Oil Futures)-Long Idea
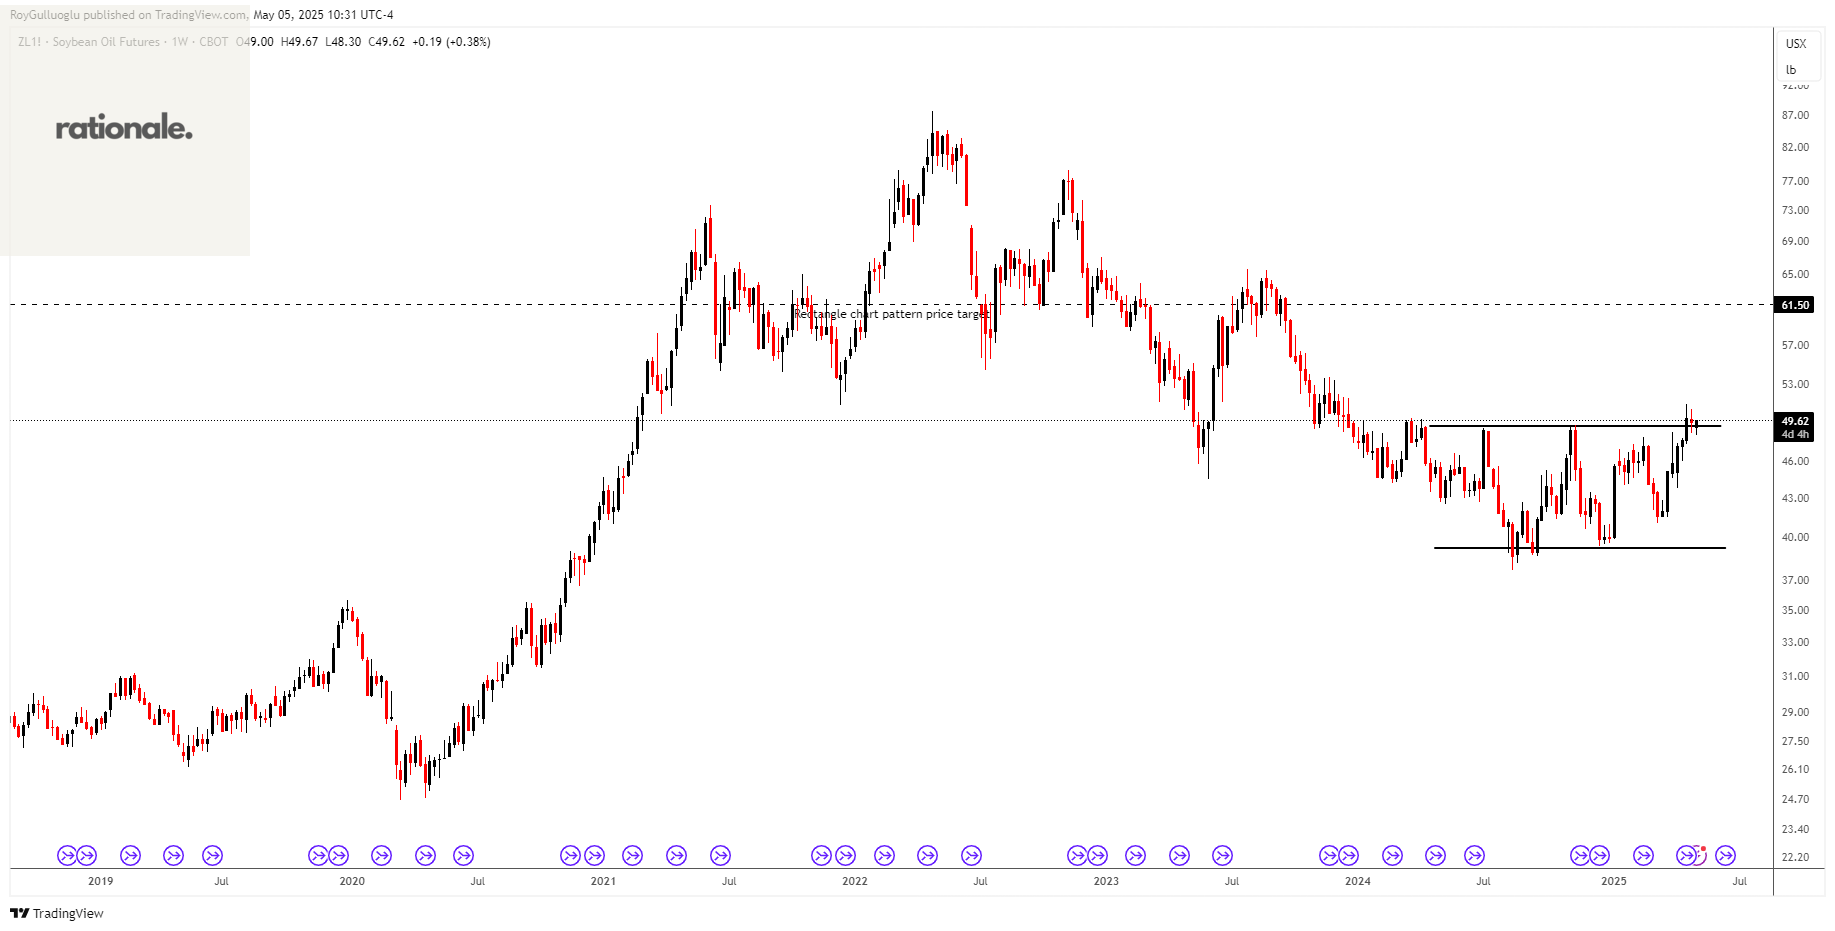
The above weekly chart formed an approximately 17-month-long rectangle chart pattern as a bullish reversal after a downtrend.
The horizontal boundary at 49.1 levels acts as a resistance within this pattern.
A daily close above 50.57 levels would validate the breakdown from the 17-month-long rectangle chart pattern.
Based on this chart pattern, the potential price target is approximately 61.5 levels.
CC1!(Cocoa Futures)-Long Idea
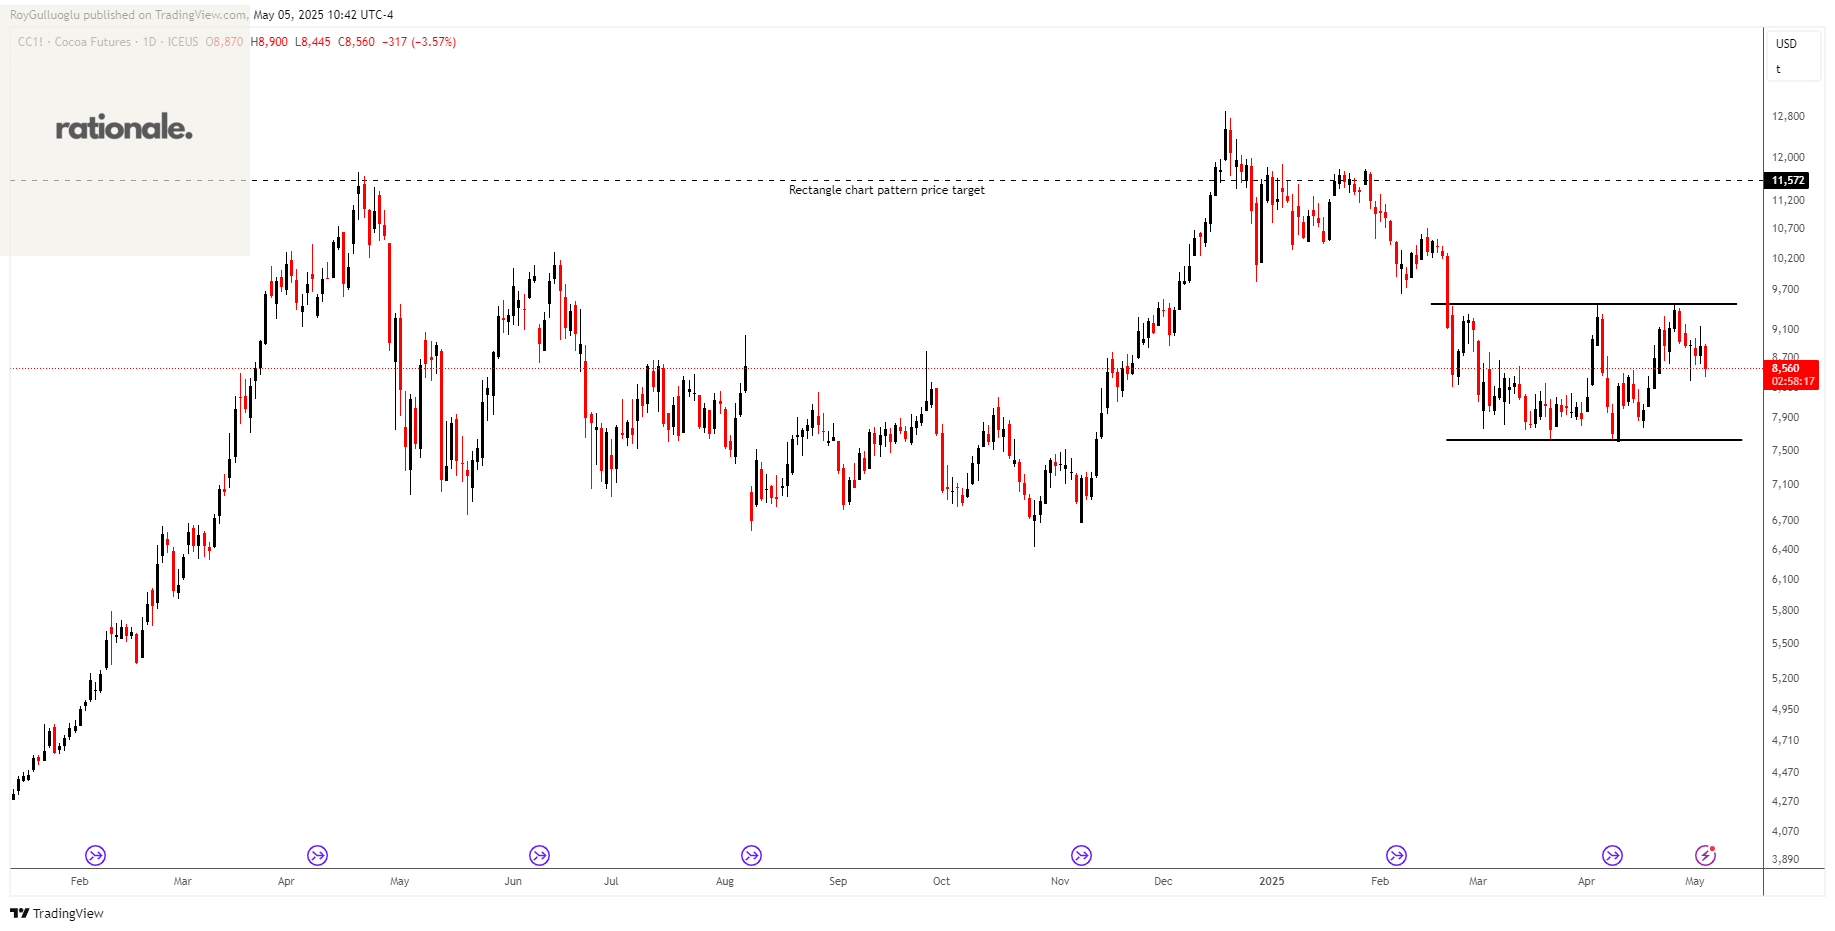
The above daily chart formed an approximately 17-month-long rectangle chart pattern as a bullish reversal after a downtrend.
The horizontal boundary at 9497 levels acts as a resistance within this pattern.
A daily close above 9781 levels would validate the breakdown from the 17-month-long rectangle chart pattern.
Based on this chart pattern, the potential price target is approximately 11572 levels.
CL1!(Light Crude Oil Futures)-Short Idea
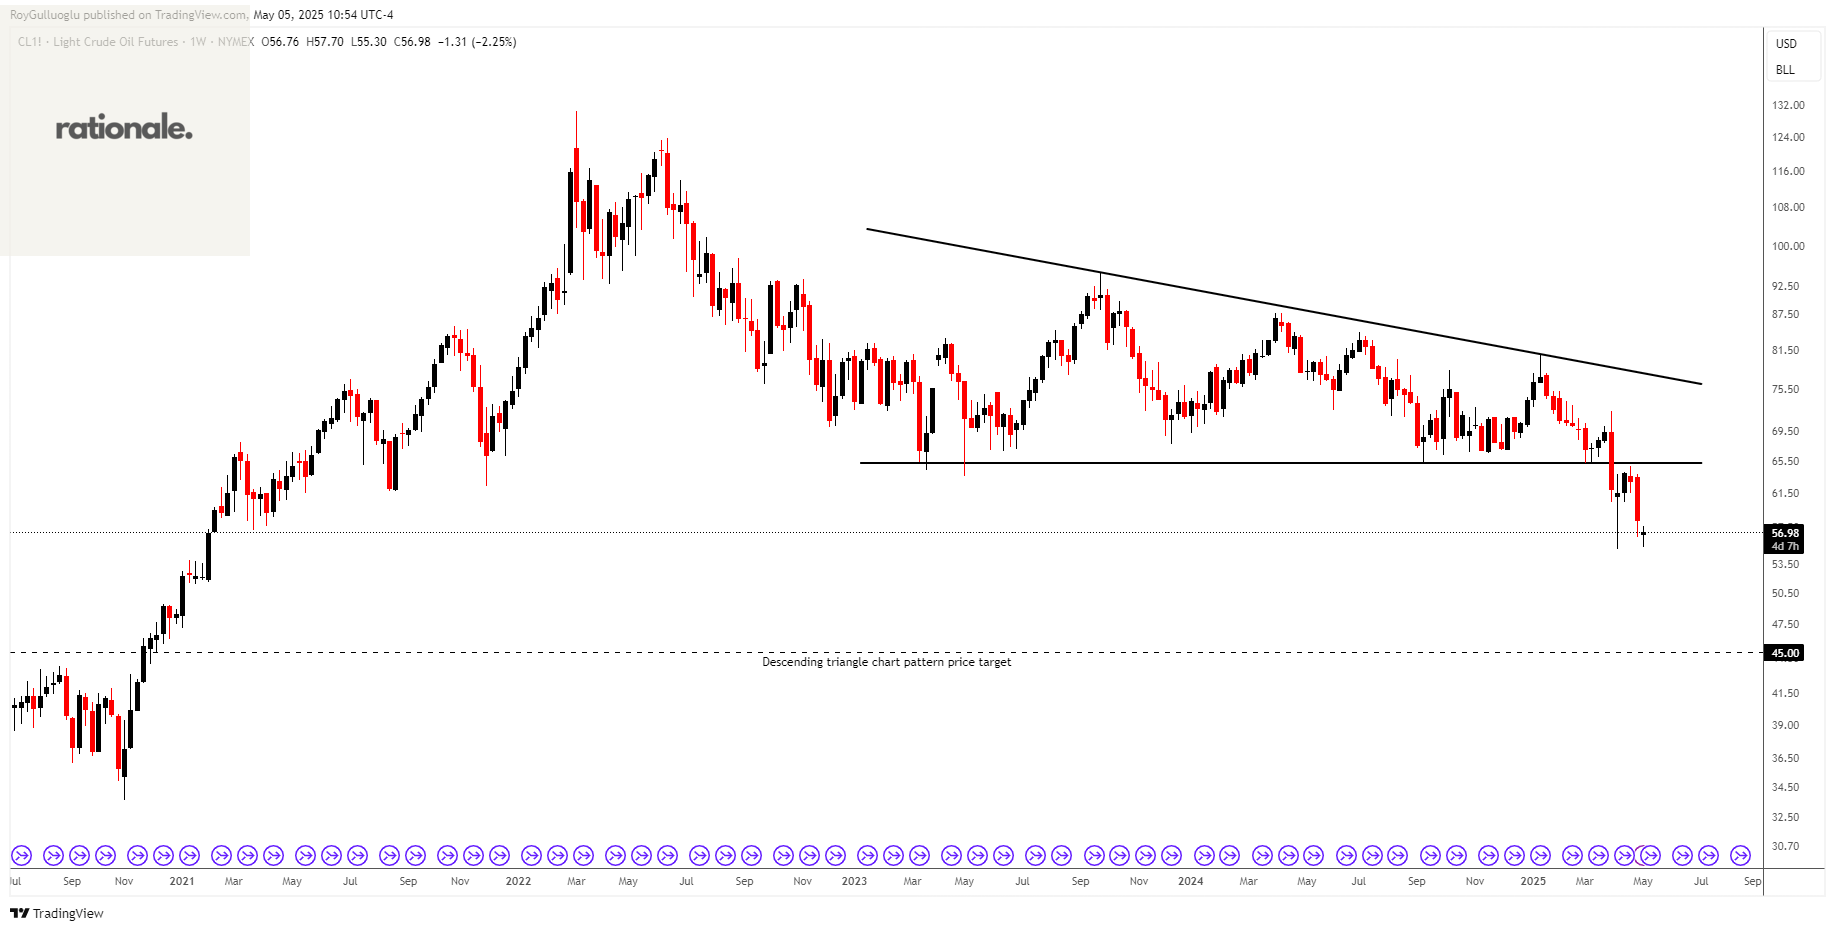
The above weekly chart formed an approximately 27-month-long descending triangle chart pattern as a bearish reversal after an uptrend.
The horizontal boundary at 65.27 levels acted as a resistance within this pattern.
A daily close below 63.312 levels validated the breakdown from the 27-month-long descending triangle chart pattern.
Based on this chart pattern, the potential price target is approximately 45 levels.
USDCHF-Short Idea
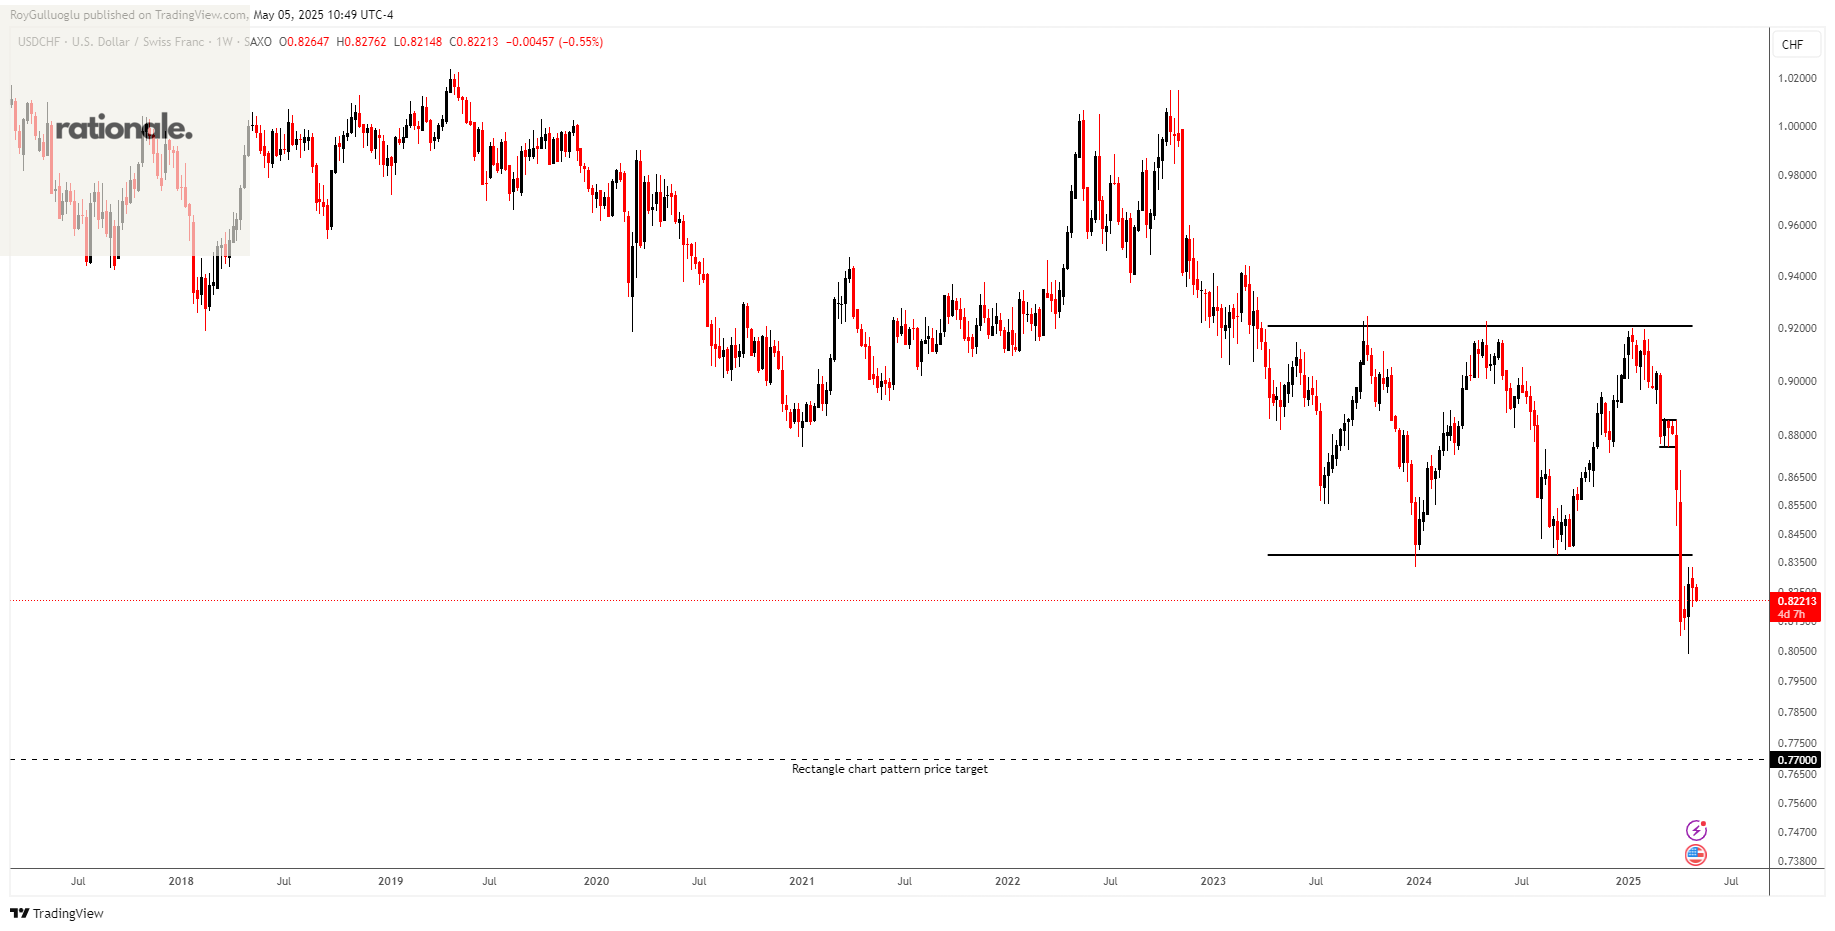
The above weekly chart formed an approximately 25-month-long rectangle chart pattern as a bullish reversal after a downtrend.
The horizontal boundary at 0.83748 levels acted as a support within this pattern.
A daily close below 0.8291 levels validated the breakdown from the 25-month-long rectangle chart pattern.
Based on this chart pattern, the potential price target is approximately 0.77 levels.
Teşekkürler Roy