

New setups
TICKERS: NIFTY1!, LTCUSDT, MANAUSDT, MATICUSDT, AVAXUSDT, BNBUSDT
NIFTY1!(NIFTY 50 Index Futures)-Long Idea
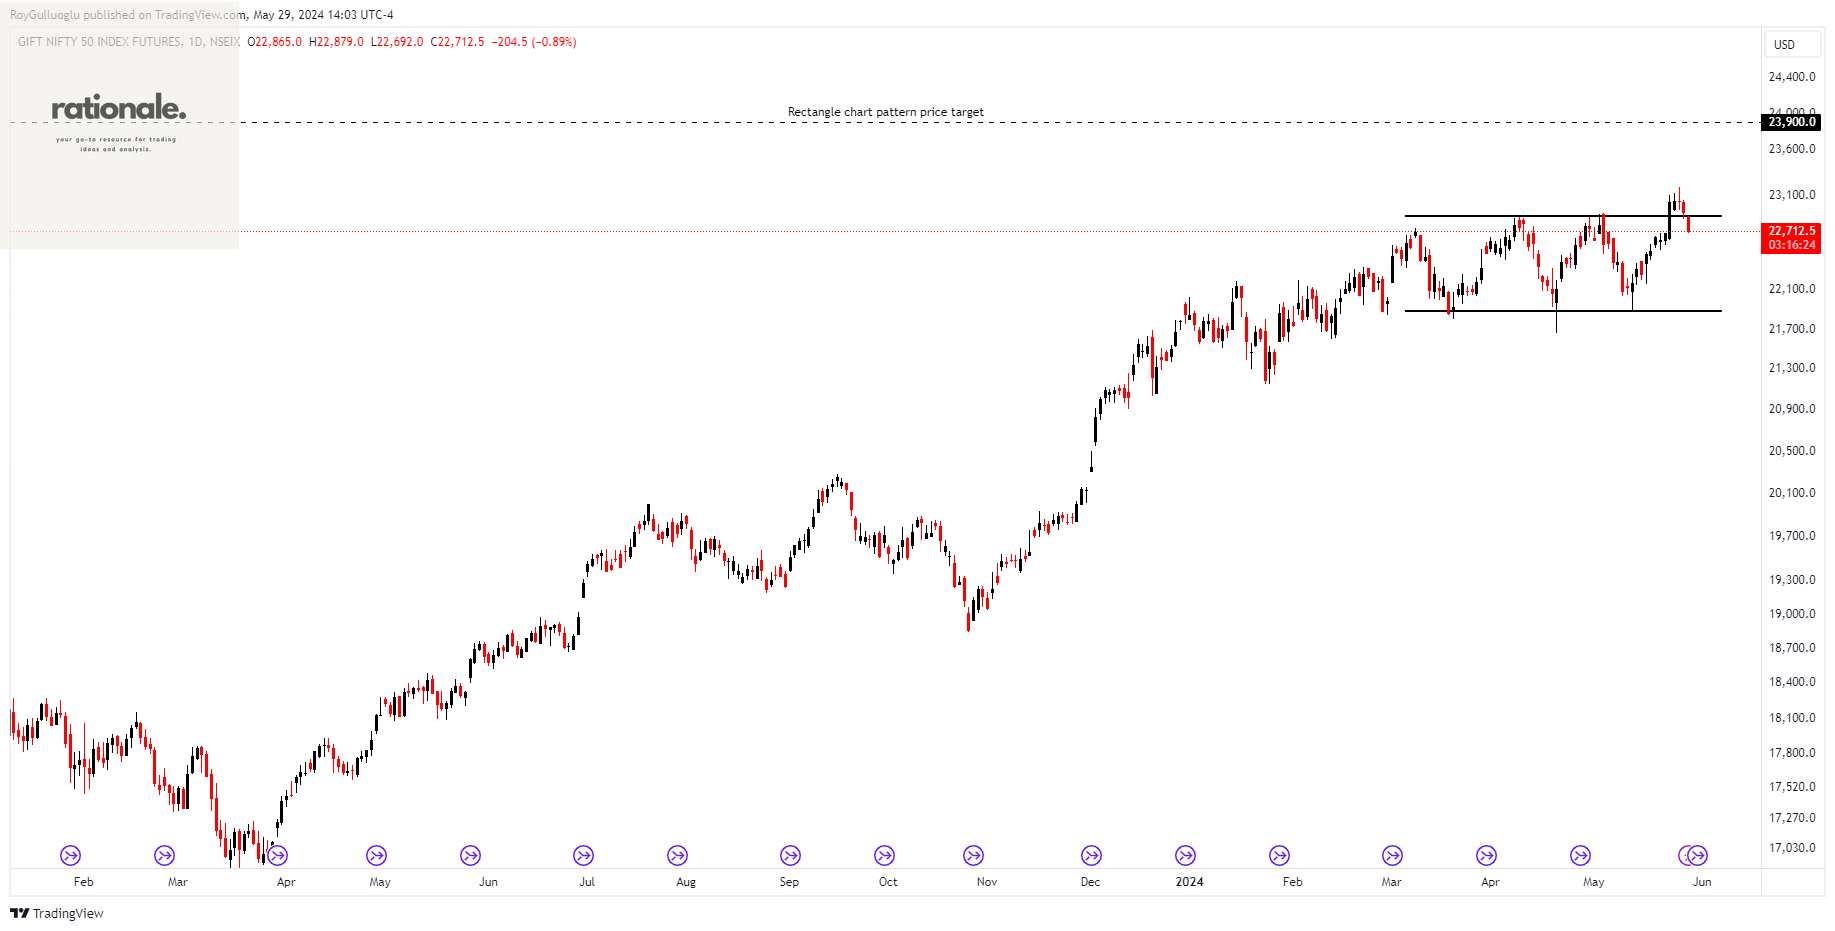
Nifty 50 Index Futures are financial derivatives that derive their value from the Nifty 50 Index, which is a stock market index comprising 50 of the largest and most liquid companies listed on the National Stock Exchange (NSE) of India.
The above daily chart formed an approximately 2-month-long rectangle chart pattern as a bullish continuation after an uptrend.
Within this pattern, the horizontal boundary at 22875 levels acts as strong support.
A daily close above 23100 levels would validate the breakout from the -month-long rectangle chart pattern.
Based on this chart pattern, the potential price target is 23900 levels.
LTCUSDT - Long Idea
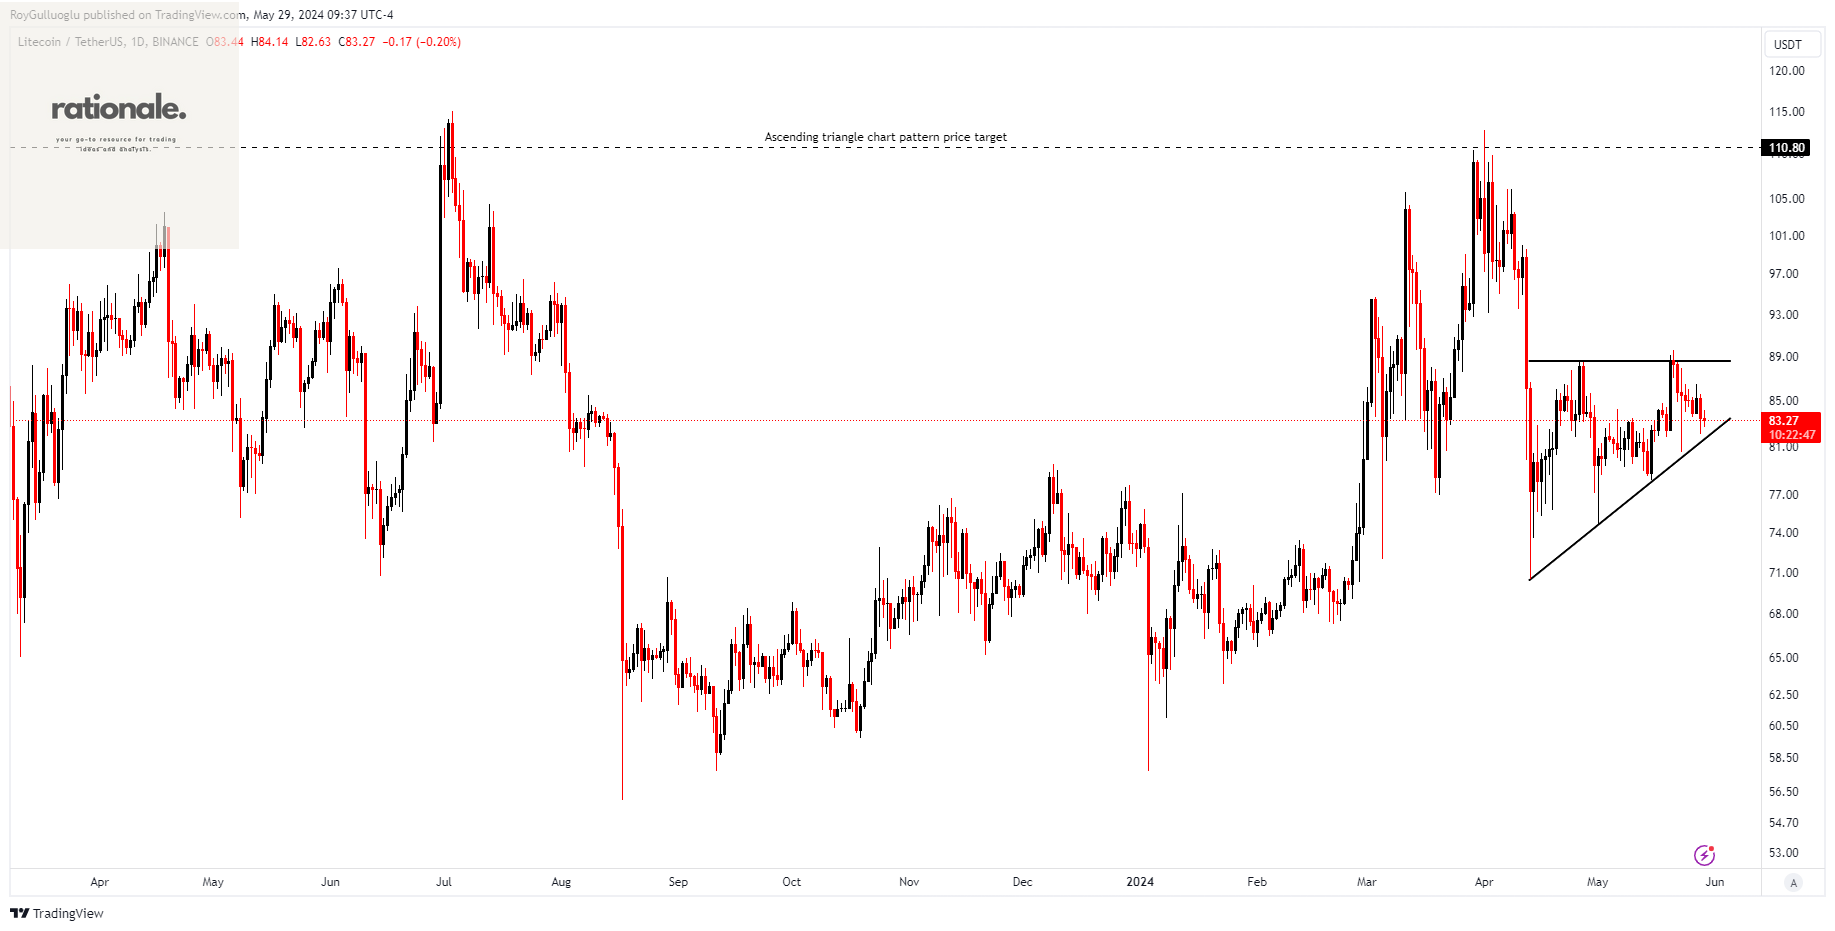
The above daily chart formed an approximately 2-month-long ascending triangle chart pattern as a bullish reversal after a downtrend.
Within this pattern, the horizontal boundary at 88.55 levels acts as a resistance.
A daily close above 91.2 levels would validate the breakout from the 2-month-long ascending triangle chart pattern.
Based on this chart pattern, the potential price target is 110.8 levels.
MANAUSDT - Long Idea
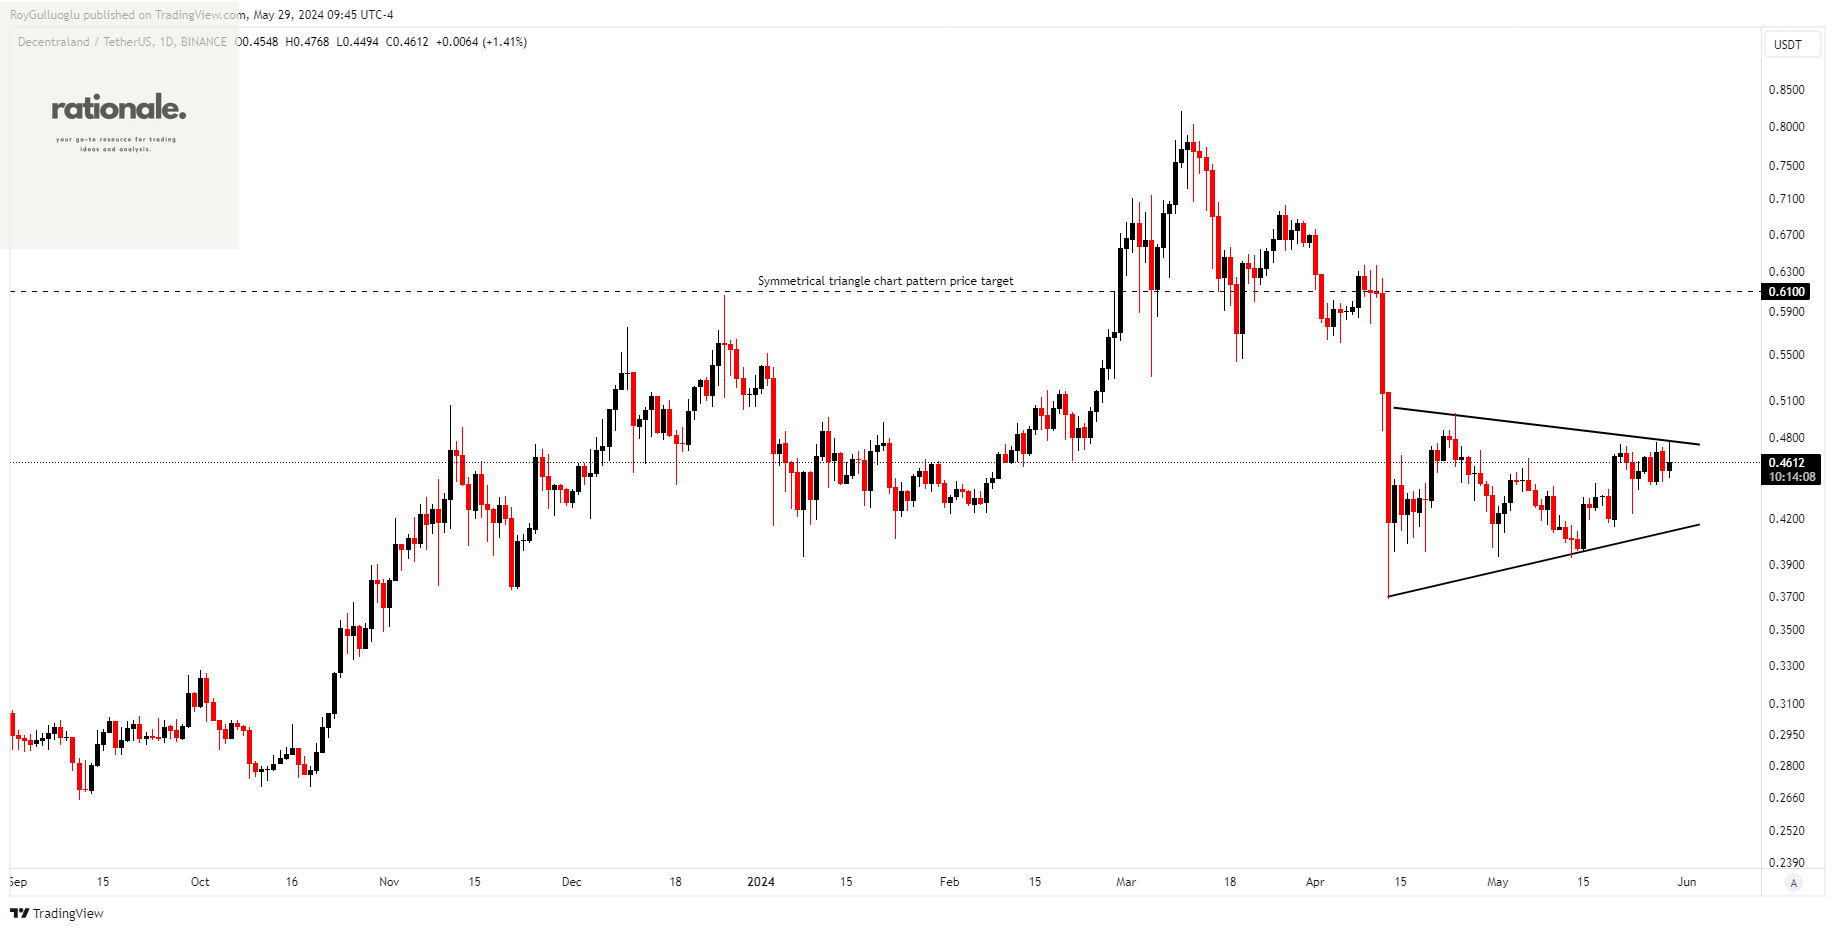
The above daily chart formed an approximately 2-month-long ascending triangle chart pattern as a bullish reversal after a downtrend.
Within this pattern, the horizontal boundary at 0.4768 levels acts as a resistance.
A daily close above 0.4911 levels would validate the breakout from the 2-month-long ascending triangle chart pattern.
Based on this chart pattern, the potential price target is 0.61 levels.
MATICUSDT - Long Idea
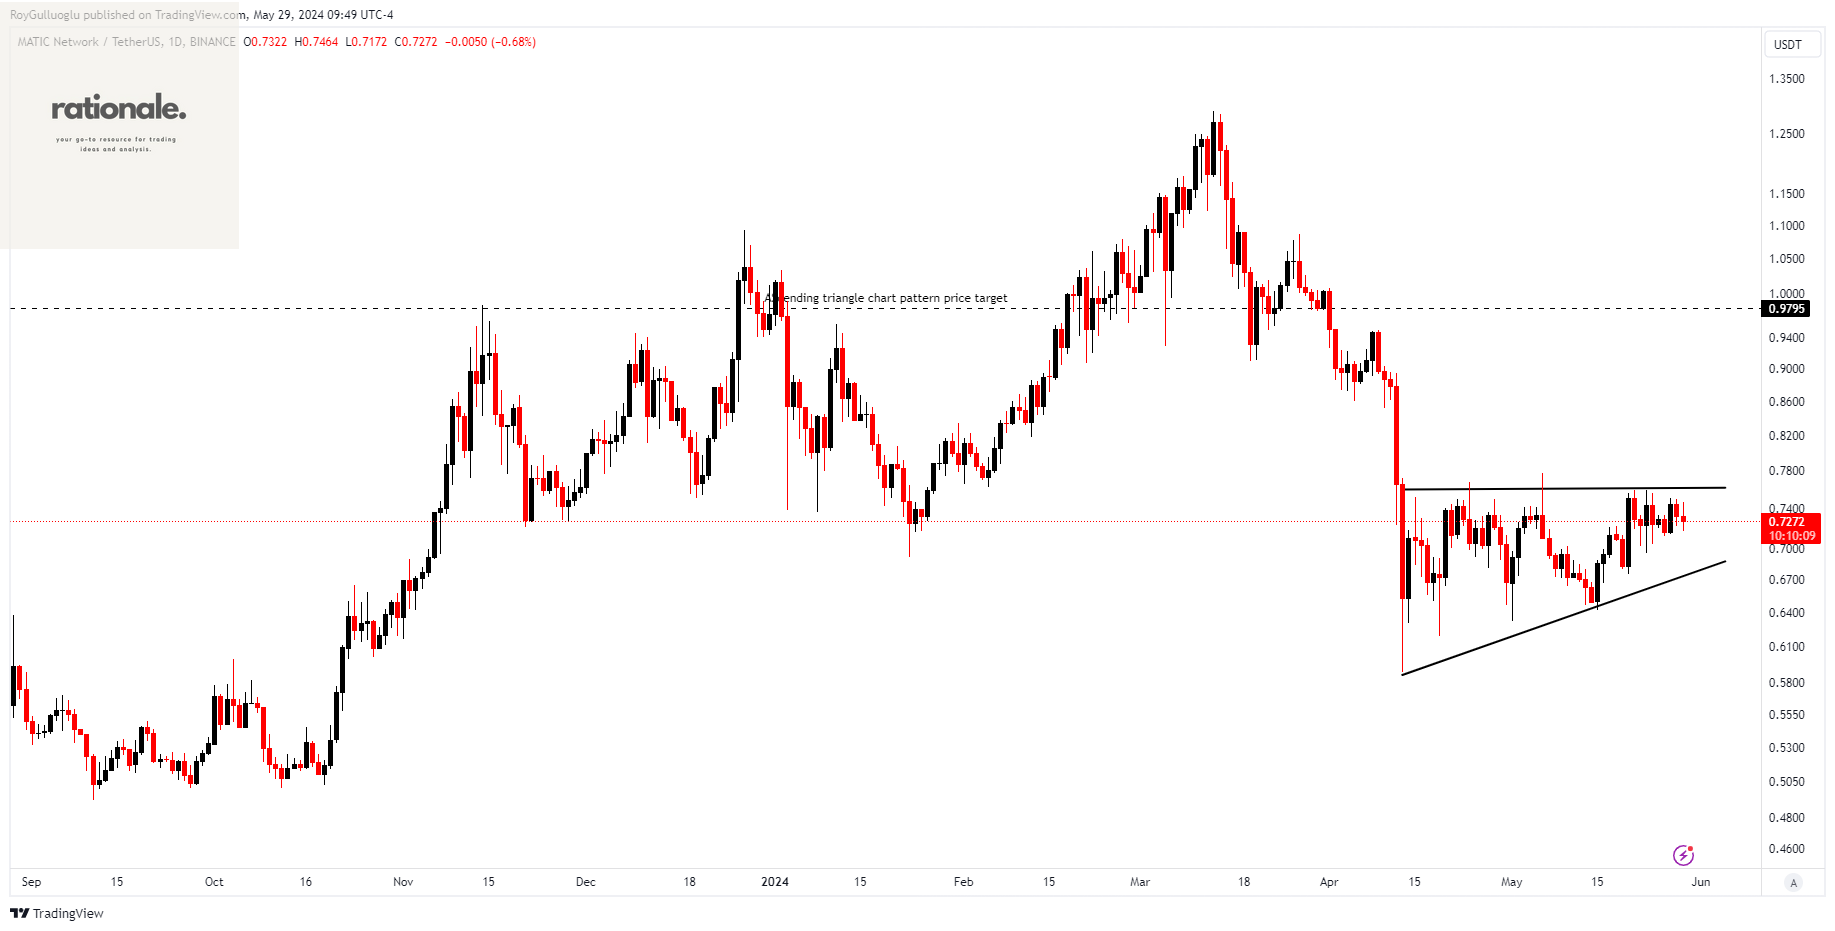
The above daily chart formed an approximately 2-month-long ascending triangle chart pattern as a bullish reversal after a downtrend.
Within this pattern, the horizontal boundary at 0.762 levels acts as a resistance.
A daily close above 0.7848 levels would validate the breakout from the 2-month-long ascending triangle chart pattern.
Based on this chart pattern, the potential price target is 0.9795 levels.
AVAXUSDT - Long Idea
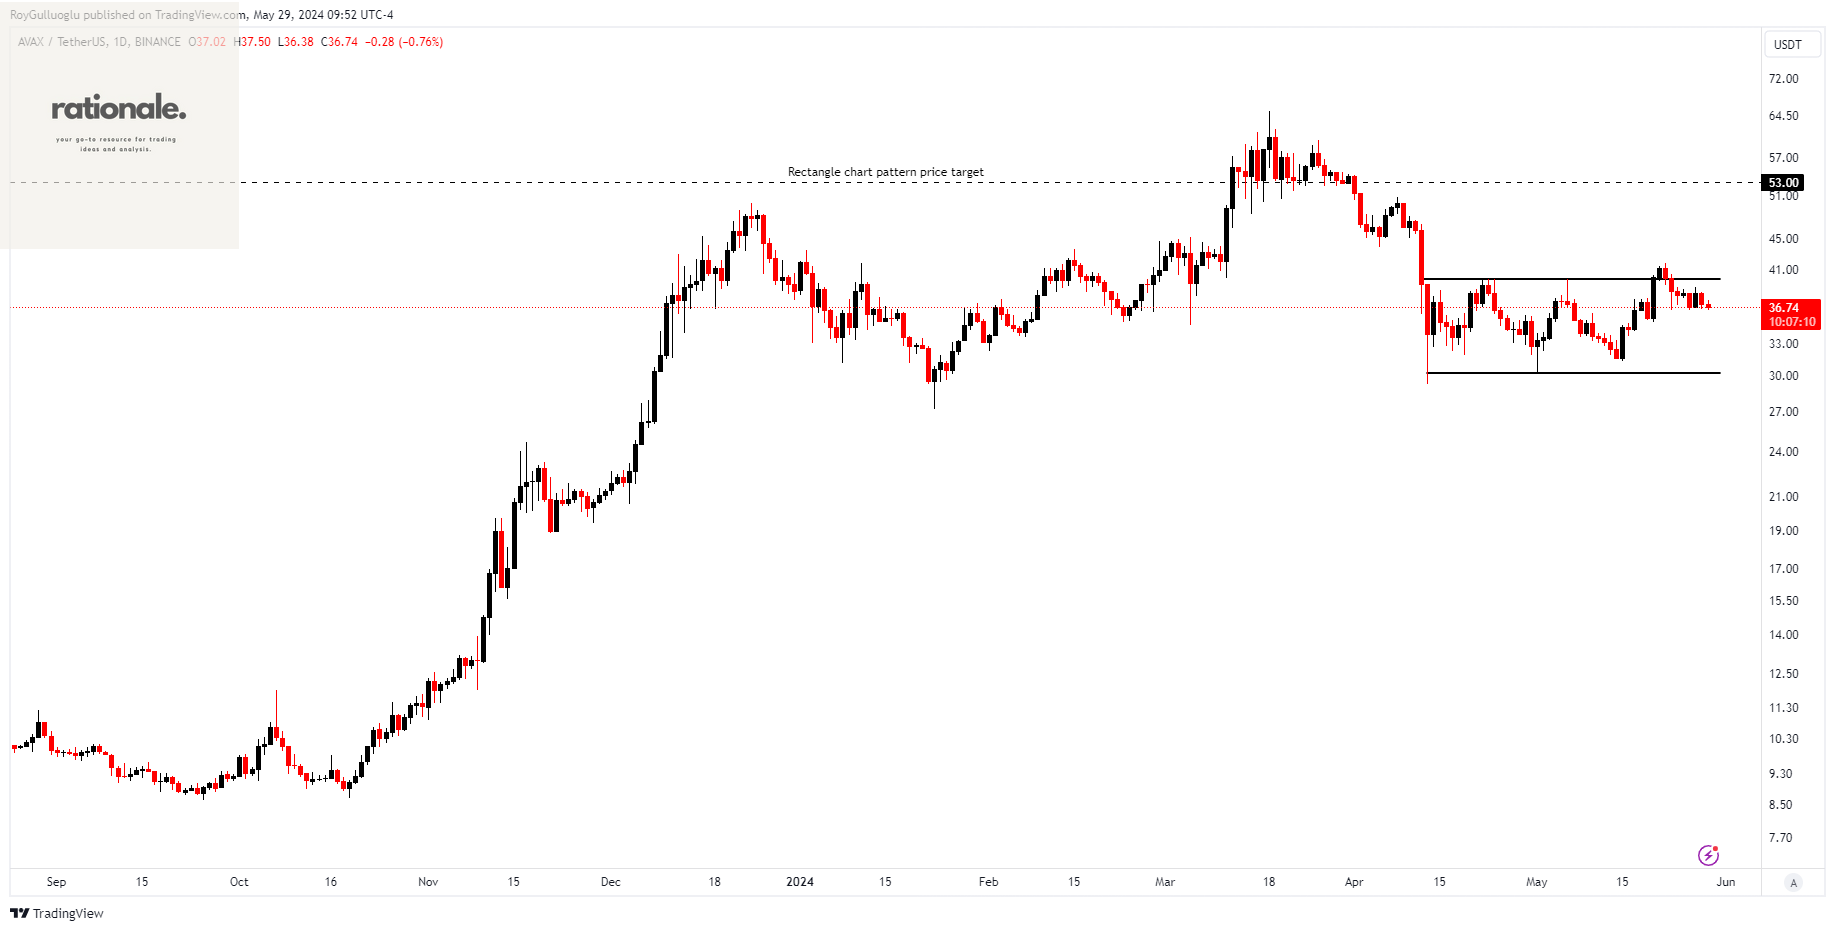
The above daily chart formed an approximately 2-month-long rectangle chart pattern as a bullish reversal after a downtrend.
Within this pattern, the horizontal boundary at 39.84 levels acts as a resistance.
A daily close above 41.03 levels would validate the breakout from the 2-month-long rectangle chart pattern.
Based on this chart pattern, the potential price target is 53 levels.
BNBUSDT - Long Idea
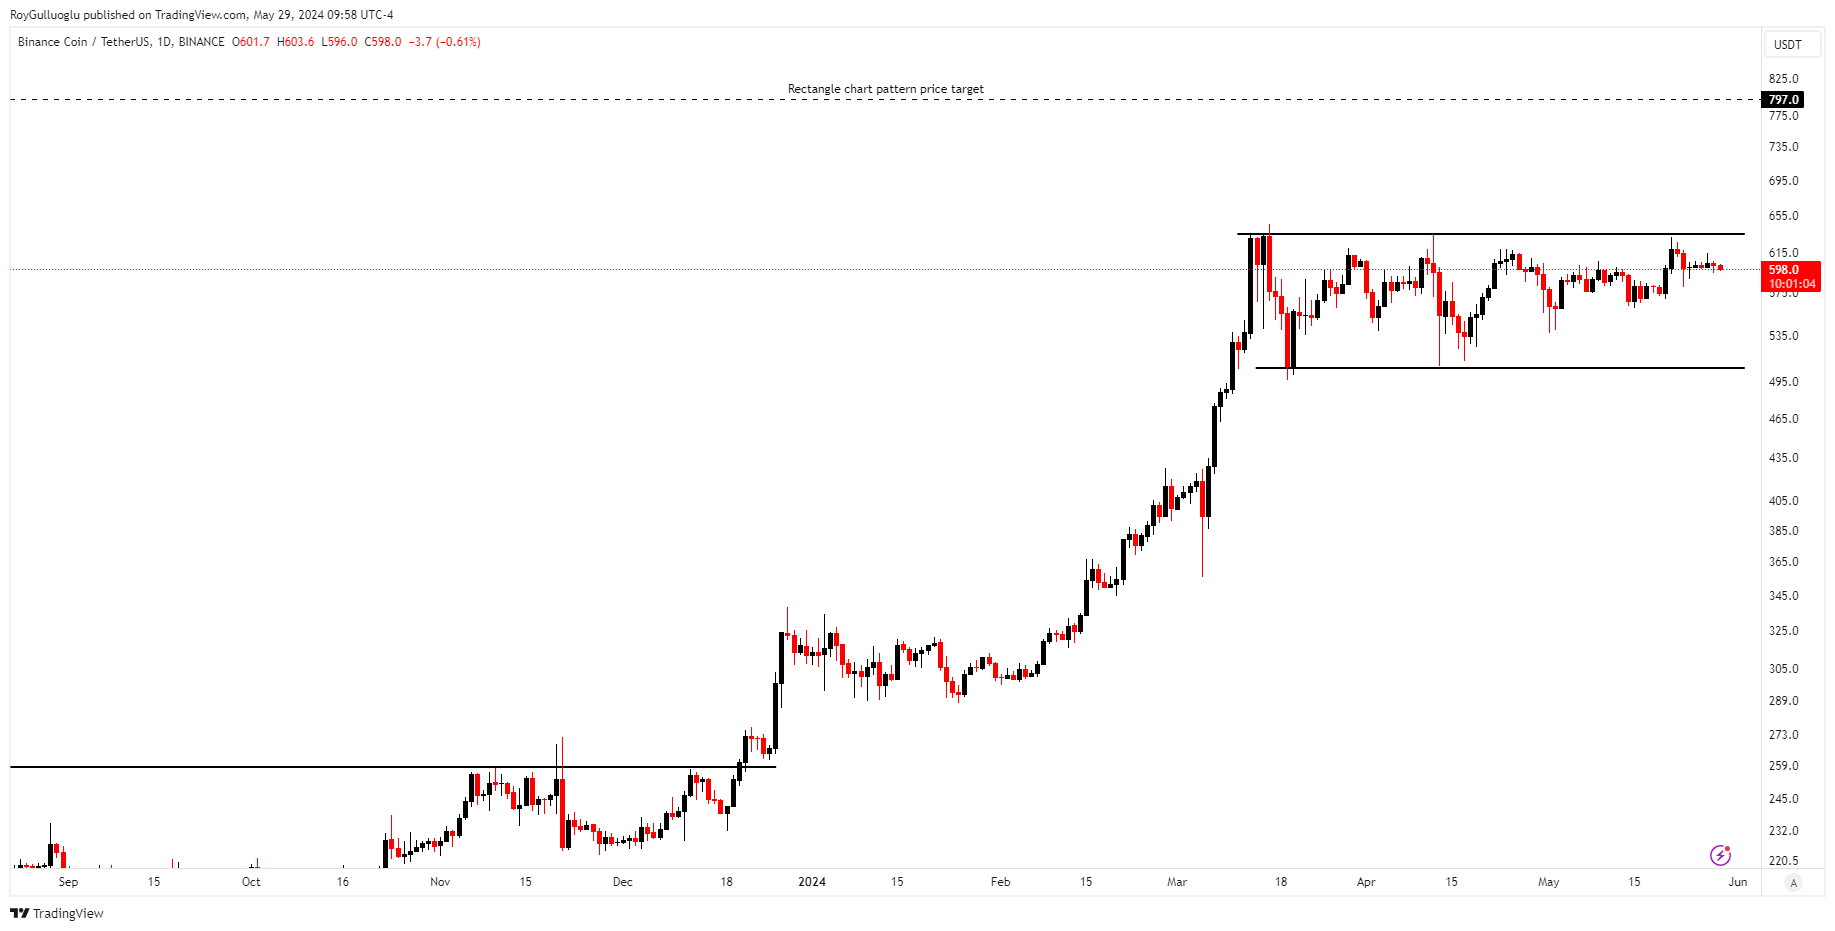
The above daily chart formed an approximately 3-month-long rectangle chart pattern as a bullish continuation after an uptrend.
Within this pattern, the horizontal boundary at 634.2 levels acts as a resistance.
A daily close above 653.2 levels would validate the breakout from the 3-month-long rectangle chart pattern.
Based on this chart pattern, the potential price target is 797 levels.
Teşekkürler