

New setups
HG1!(Copper Futures)-Long Idea
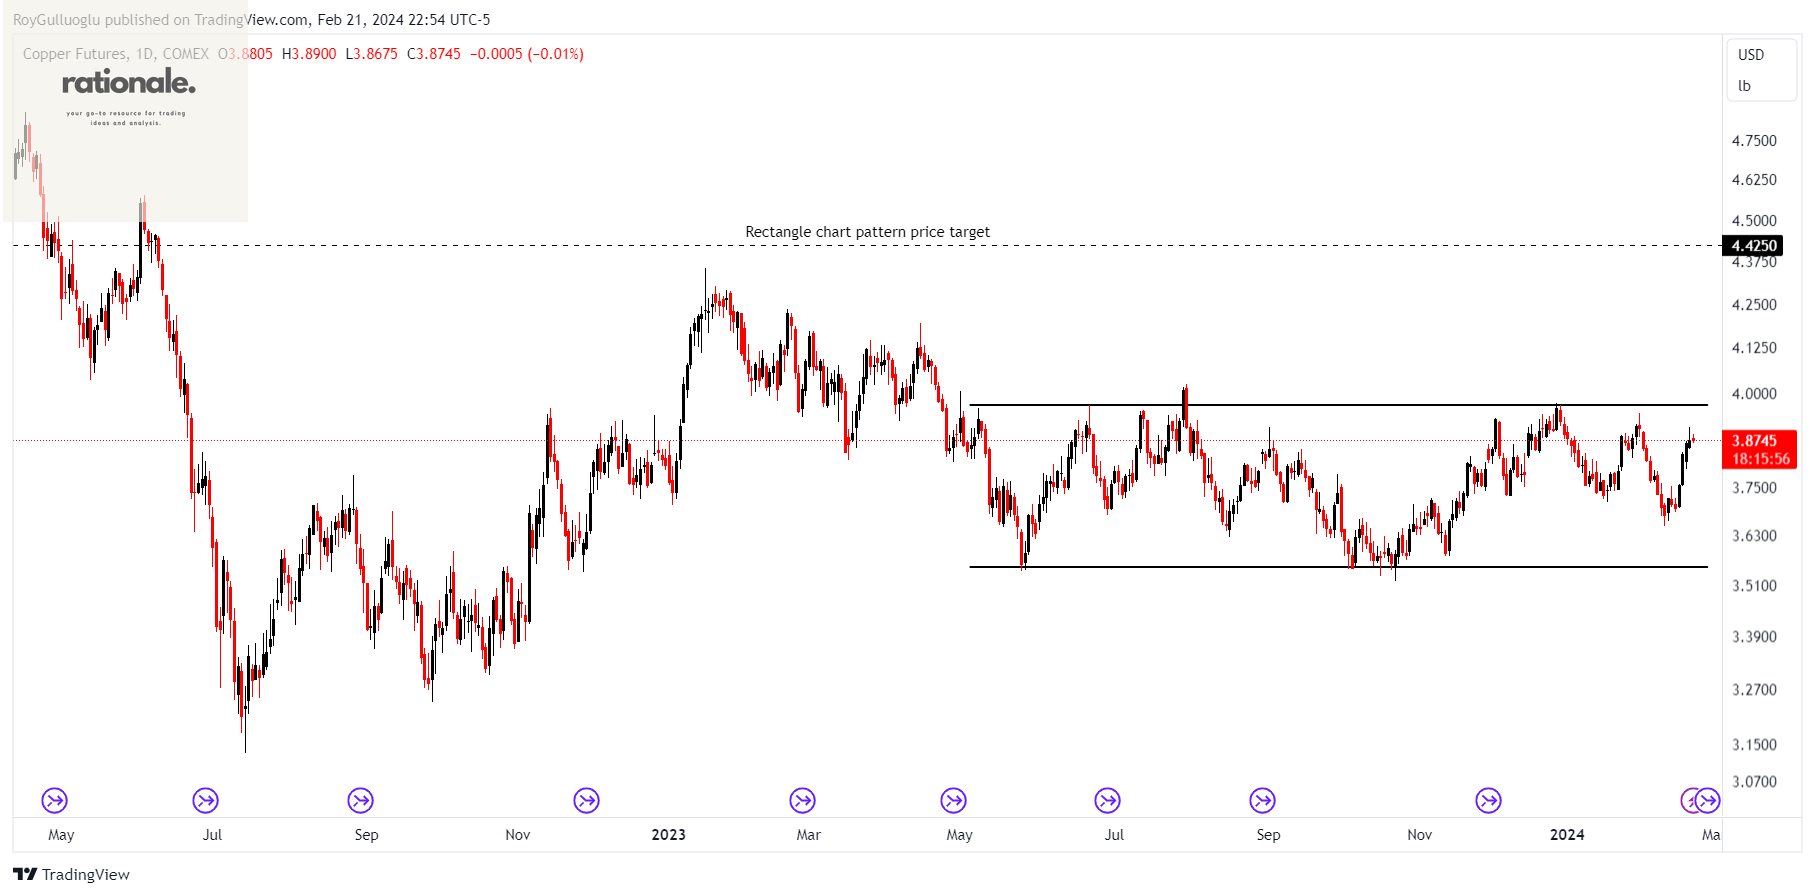
The above daily chart formed an approximately 7-month-long rectangle chart pattern as a bullish reversal after a downtrend.
Within this pattern, the horizontal boundary at 3.9665 levels acts as a resistance.
A daily close above 4.085 levels would validate the breakout from the 7-month-long rectangle chart pattern.
Based on this chart pattern, the potential price target is 4.425 levels.
Chinese indices have started to respond after the interest rate cut affected mortgage rates especially led by the real estate sector. As the market perceives the announced support measures transitioning into concrete actions, there is a growing sense of positivity on the pricing front. This positiveness has been influential on copper prices as well.
An article on the relationship between the Chinese economy and copper.
Bottom line: Copper is another instrument that can be used as a “China reversal” discourse bet.
CT1!(Cotton No.2 Futures)-Long Idea
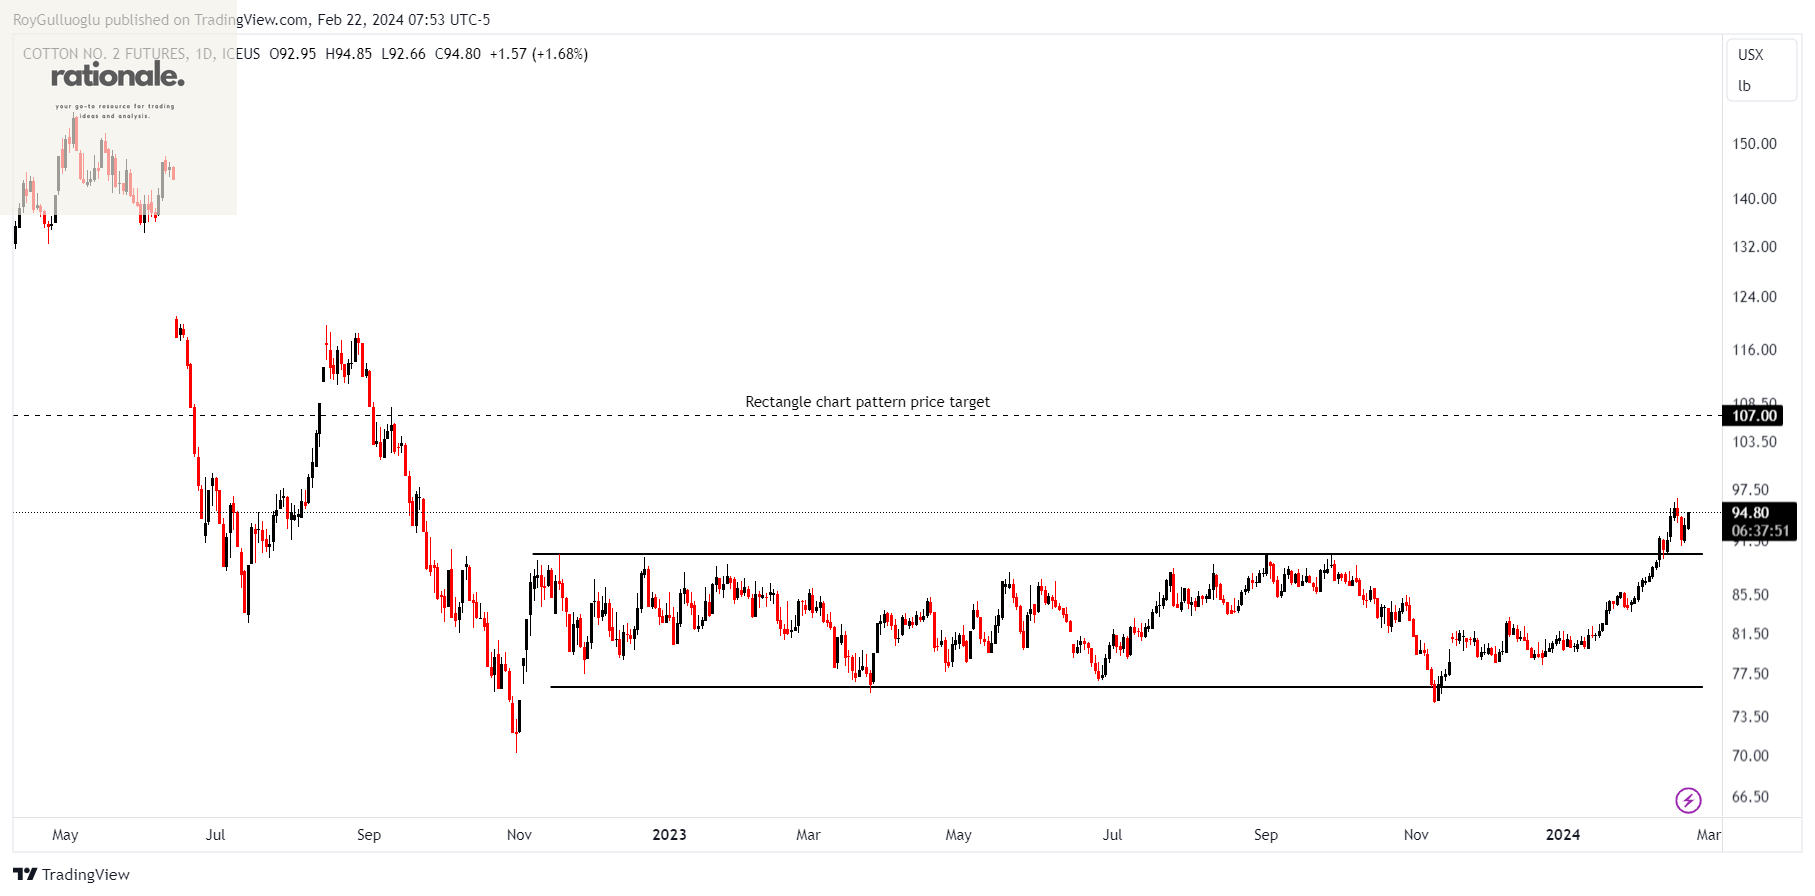
The above daily chart formed an approximately 10-month-long rectangle chart pattern as a bullish reversal after a downtrend.
Within this pattern, the horizontal boundary at 89.9 levels acted as a resistance.
A daily close above 92.6 levels validated the breakout from the 10-month-long rectangle chart pattern.
Based on this chart pattern, the potential price target is 107 levels.
Vanguard FTSE All-World ex-US Index Fund-(VEU/ARCA)-Long Idea
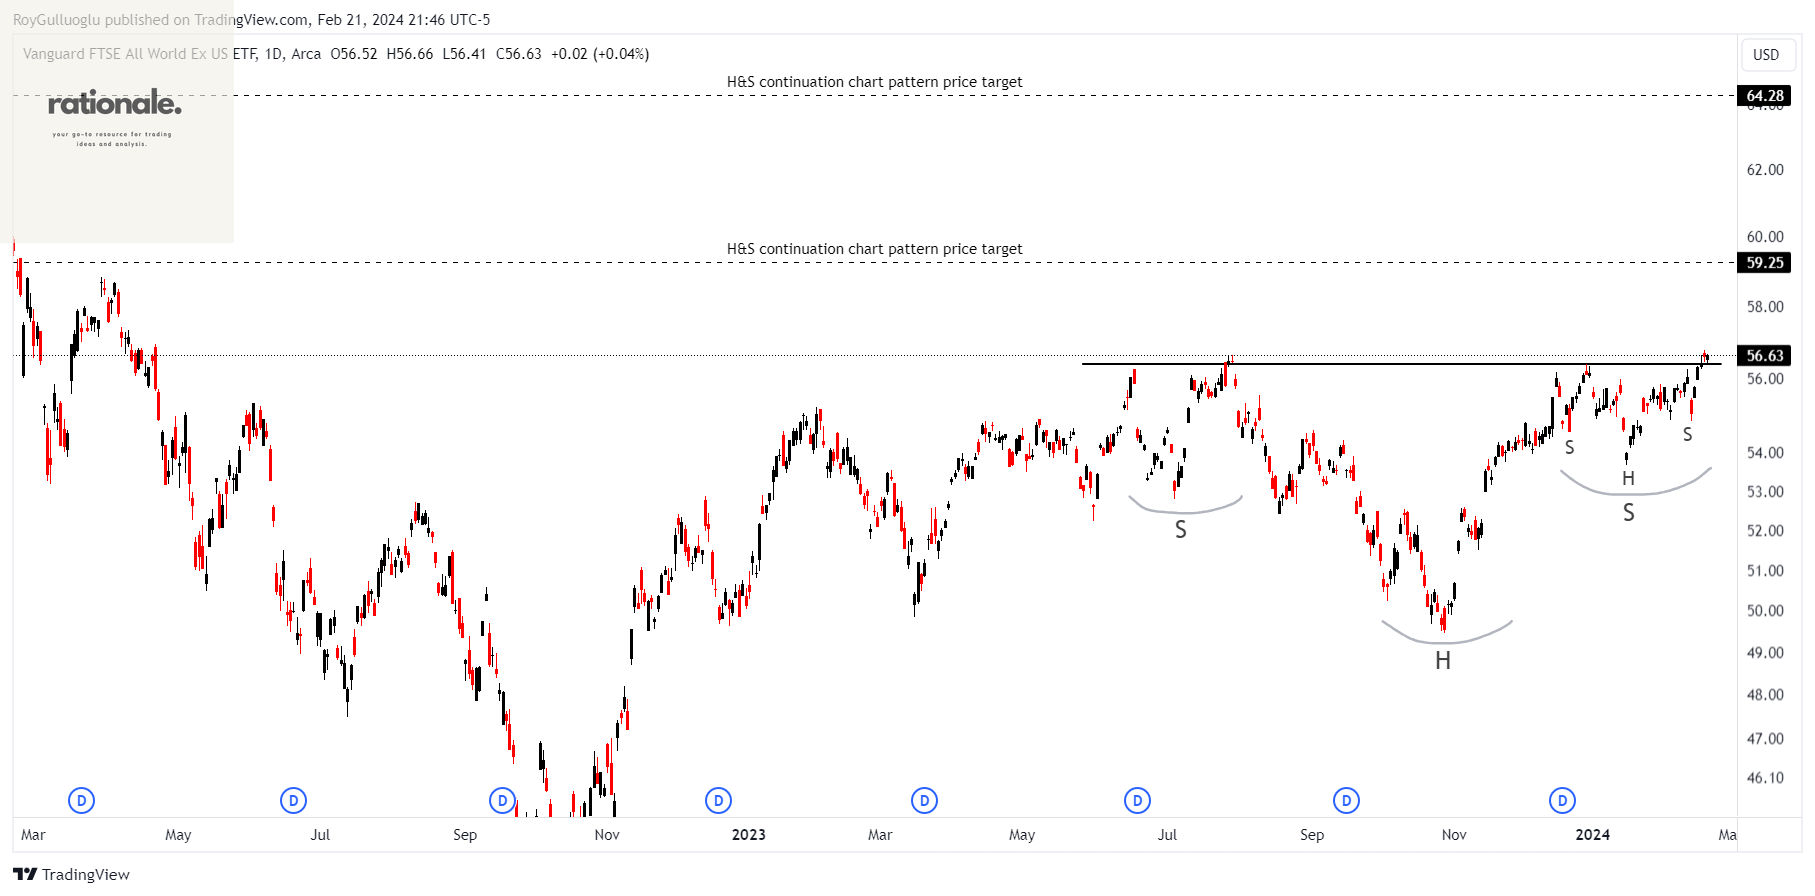
The fund follows an indexing investment strategy, aiming to replicate the performance of the FTSE All-World ex-U.S. Index. The goal is to hold each stock in a proportion that mirrors its weighting in the index, thereby closely tracking the index's overall performance.
The above daily chart formed approximately a 5-month-long and 2-month-long both intertwined H&S continuation chart patterns as a bullish continuation after an uptrend.
Within this pattern, the horizontal boundary at 56.4 levels acts as a resistance.
A daily close above 58 levels would validate the breakout from both chart patterns.
Based on this chart pattern, the potential price targets are 59.25 and 64.28 levels respectively.
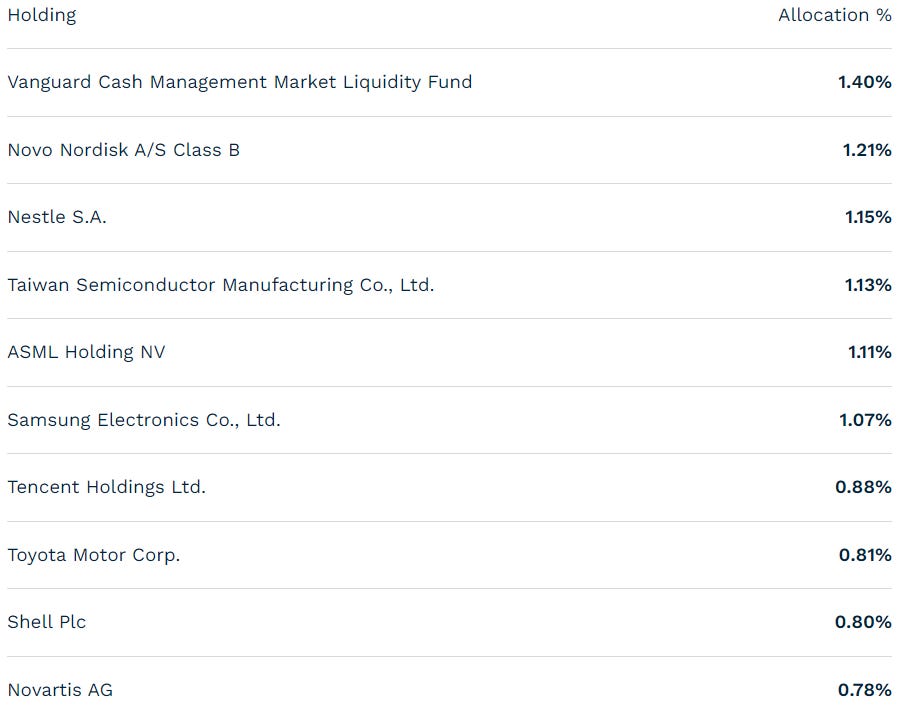
Top 10 holdings
iShares JP Morgan USD Emerging Markets Bond ETF-(EMB/ARCA)-Long Idea
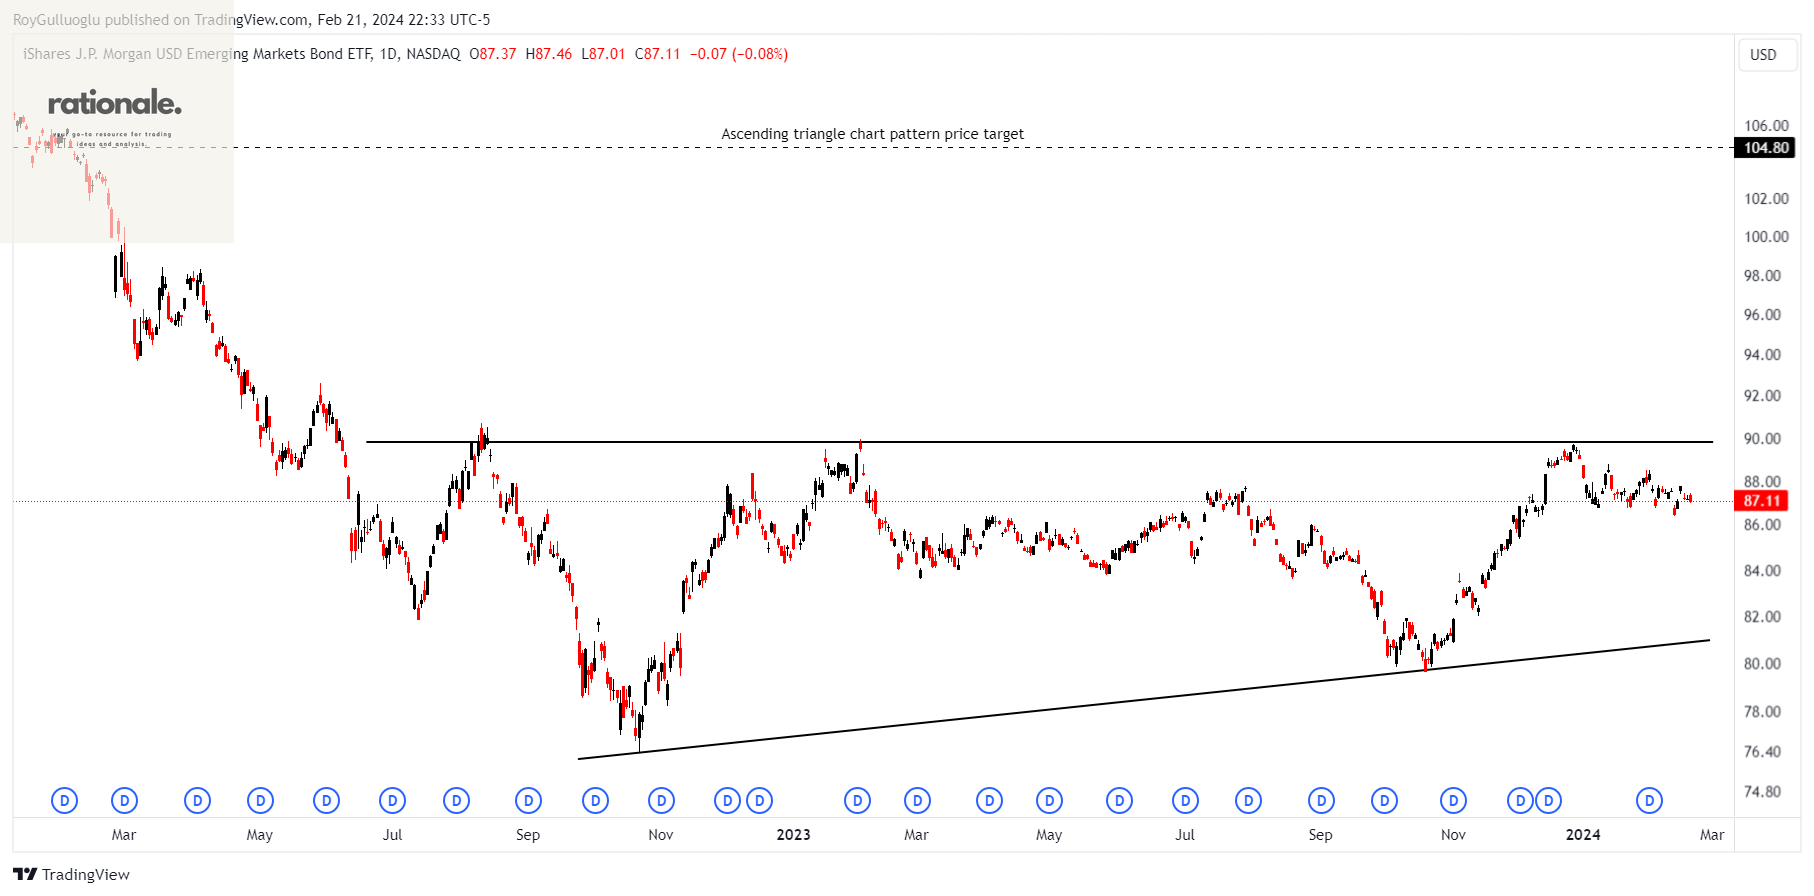
EMB follows an index that includes sovereign debt issued by emerging-market countries, denominated in US dollars. The selected countries must have outstanding debt exceeding $1 billion, with a minimum remaining maturity of two years.
The above daily chart formed an approximately year-long ascending triangle chart pattern as a bullish reversal after a downtrend.
Within this pattern, the horizontal boundary at 89.8 levels acts as a resistance.
A daily close above 92.49 levels would validate the breakout from the year-long ascending triangle chart pattern.
Based on this chart pattern, the potential price target is 104.8 levels.
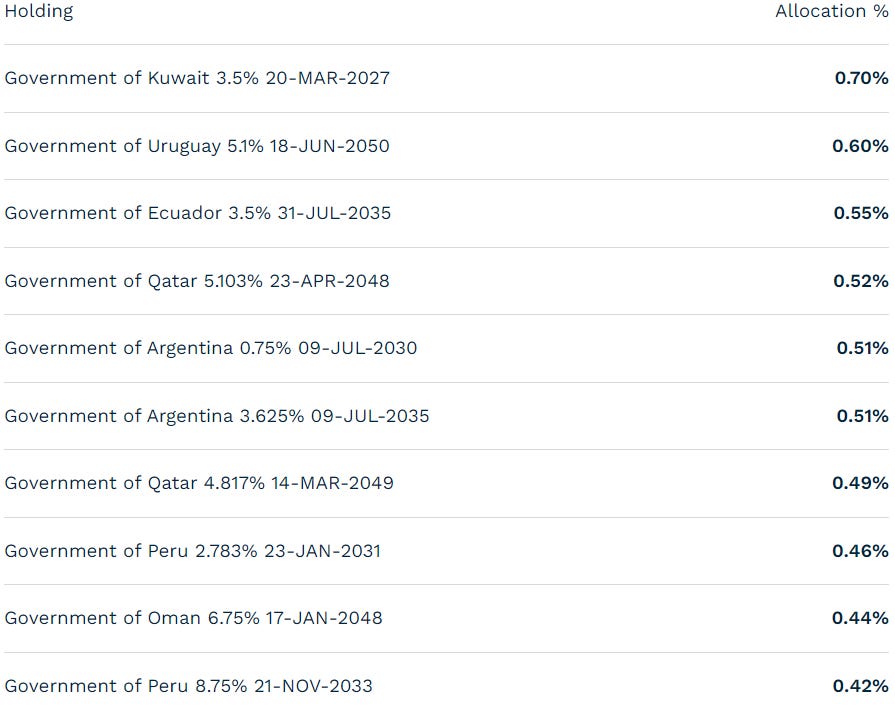
Top 10 holdings
EGLDUSDT-Long Idea
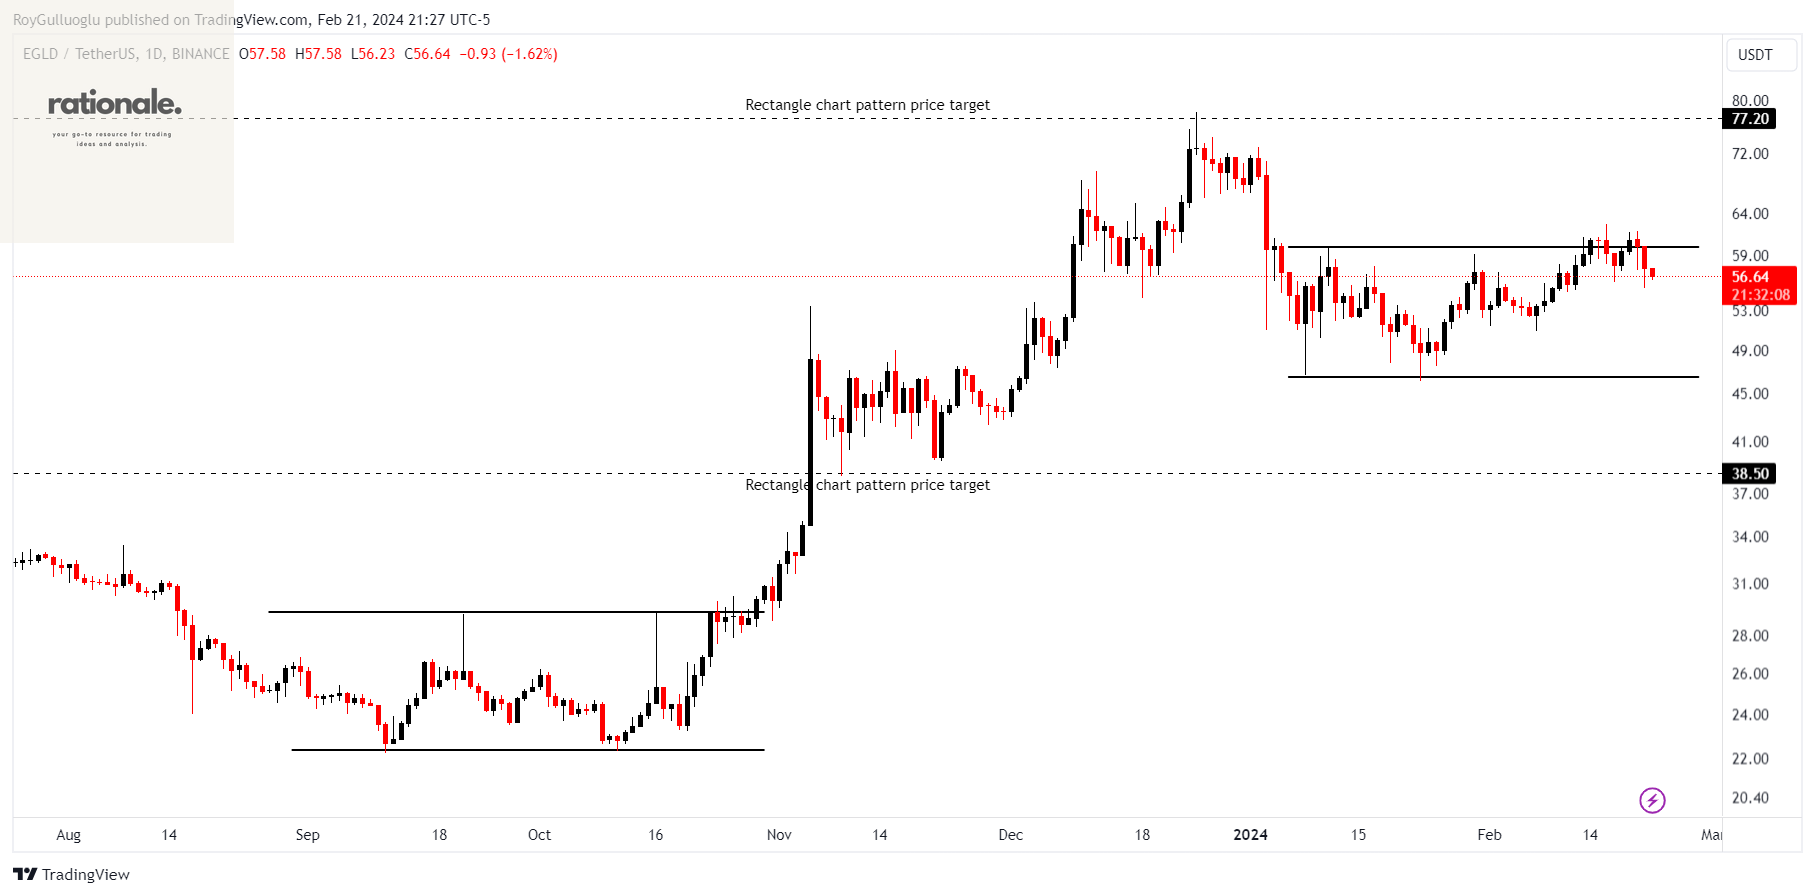
The above daily chart formed an approximately 2-month-long rectangle chart pattern as a bullish reversal after a downtrend.
The horizontal boundary at 60 levels acts as a resistance within this pattern.
A daily close above 61.8 levels would validate the breakout from the 2-month-long rectangle chart pattern.
Based on this chart pattern, the potential price target is 77.2 levels.
APEUSDT-Long Idea
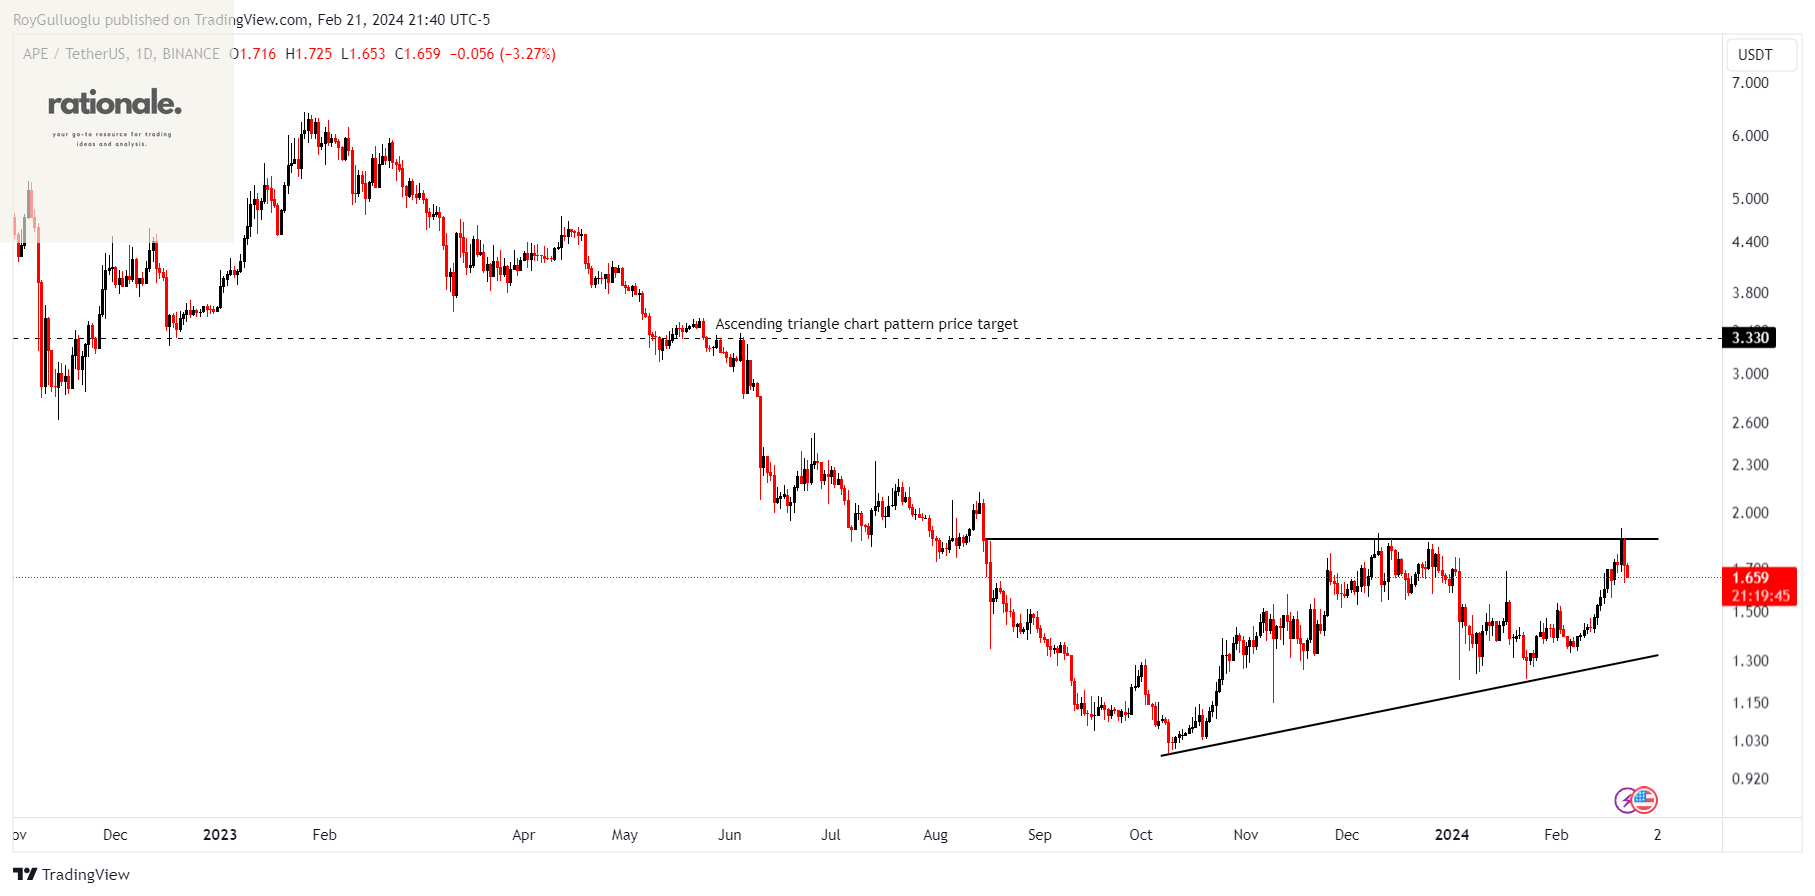
The above daily chart formed an approximately 6-month-long ascending triangle chart pattern as a bullish reversal after a downtrend.
The horizontal boundary at 1.85 levels acts as a resistance within this pattern.
A daily close above 1.905 levels would validate the breakout from the 6-month-long ascending triangle chart pattern.
Based on this chart pattern, the potential price target is 3.33 levels.
Follow-ups
MXNJPY - Long Idea
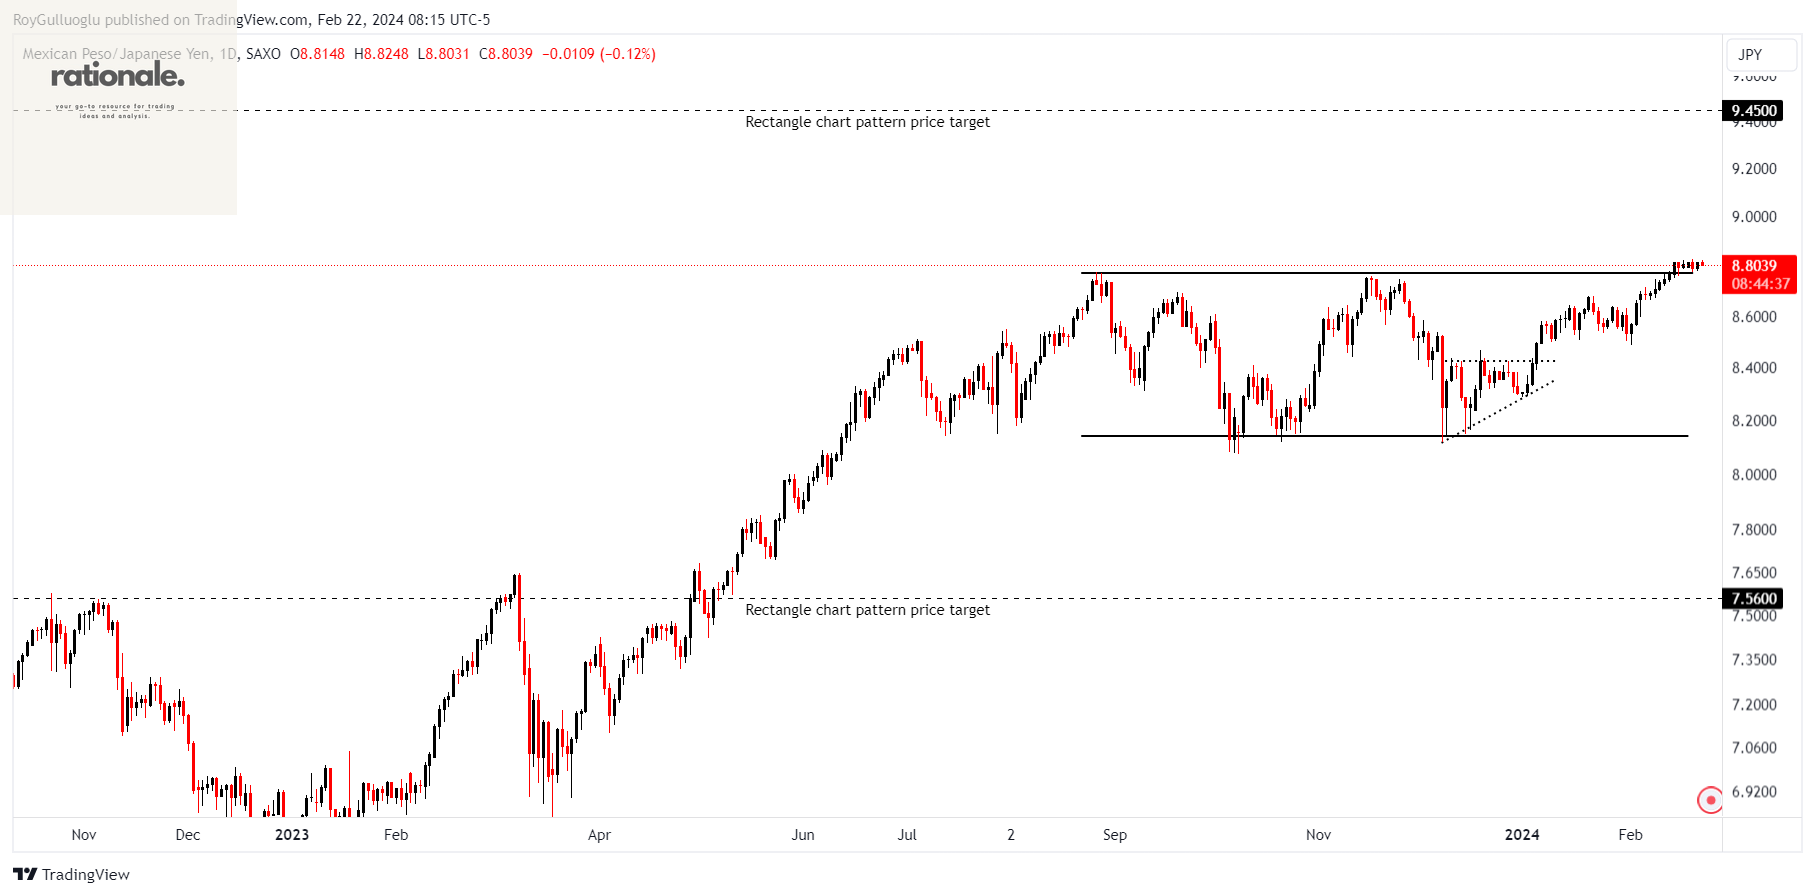
You can click the MXNJPY ticker above to access the first report explaining the RATIONALE behind the trade idea.
CHZUSDT - Long Idea
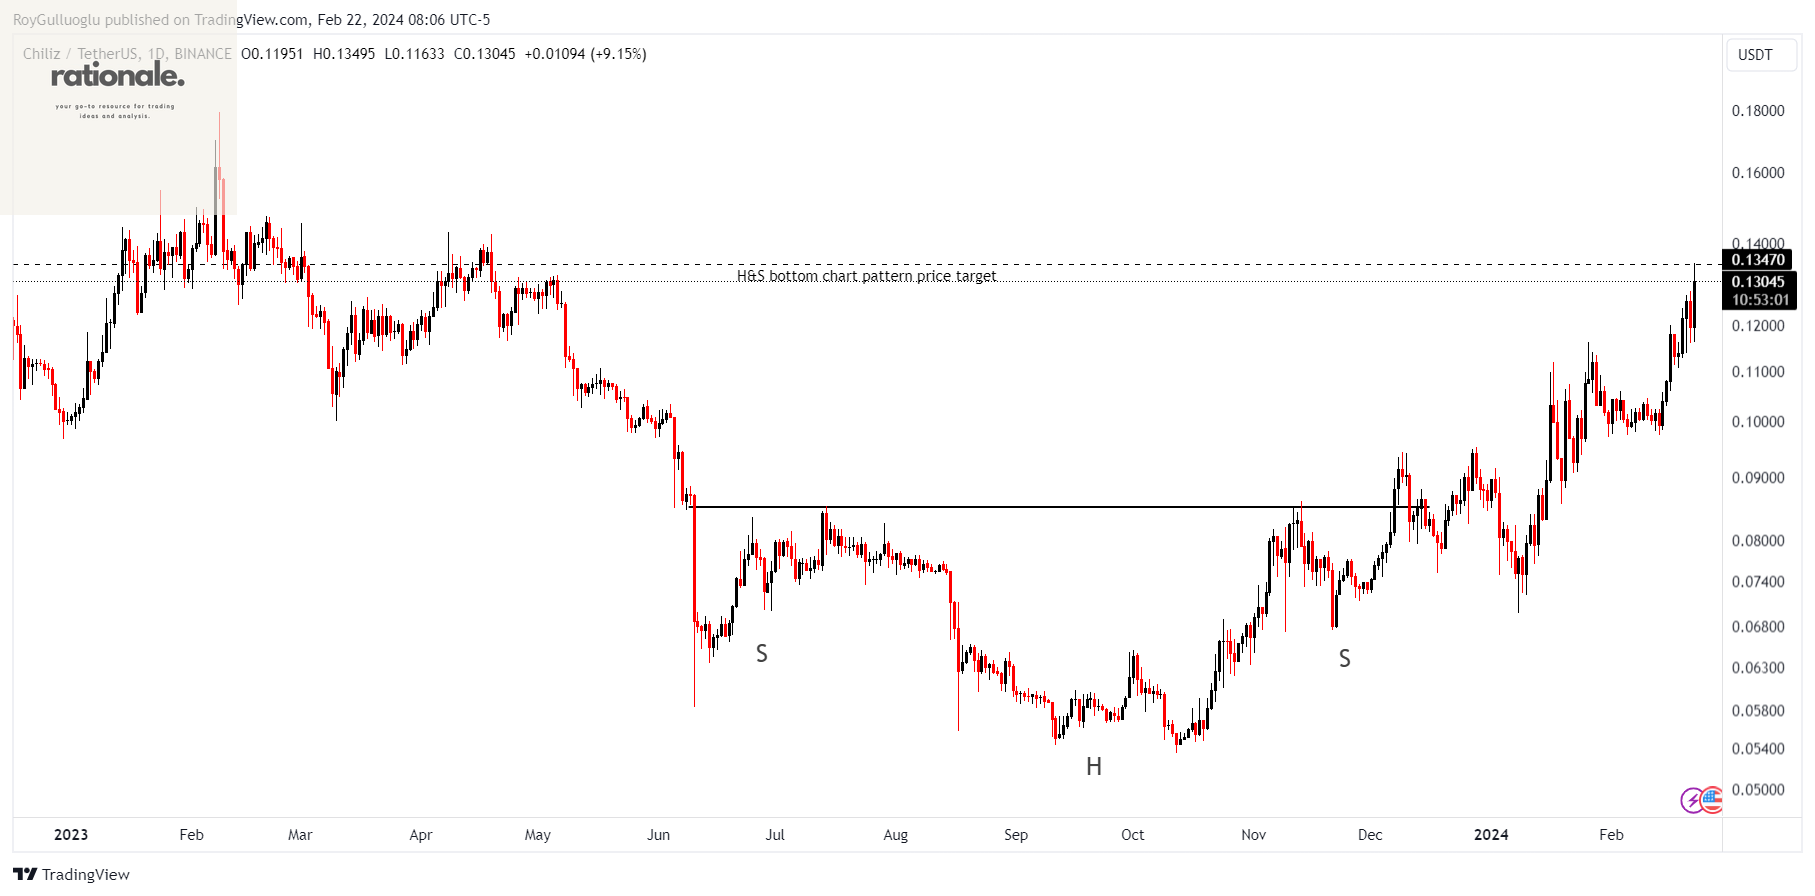
You can click the CHZUSDT ticker above to access the first report explaining the RATIONALE behind the trade idea.