


ZS1!(Soybean Futures)-Long Idea
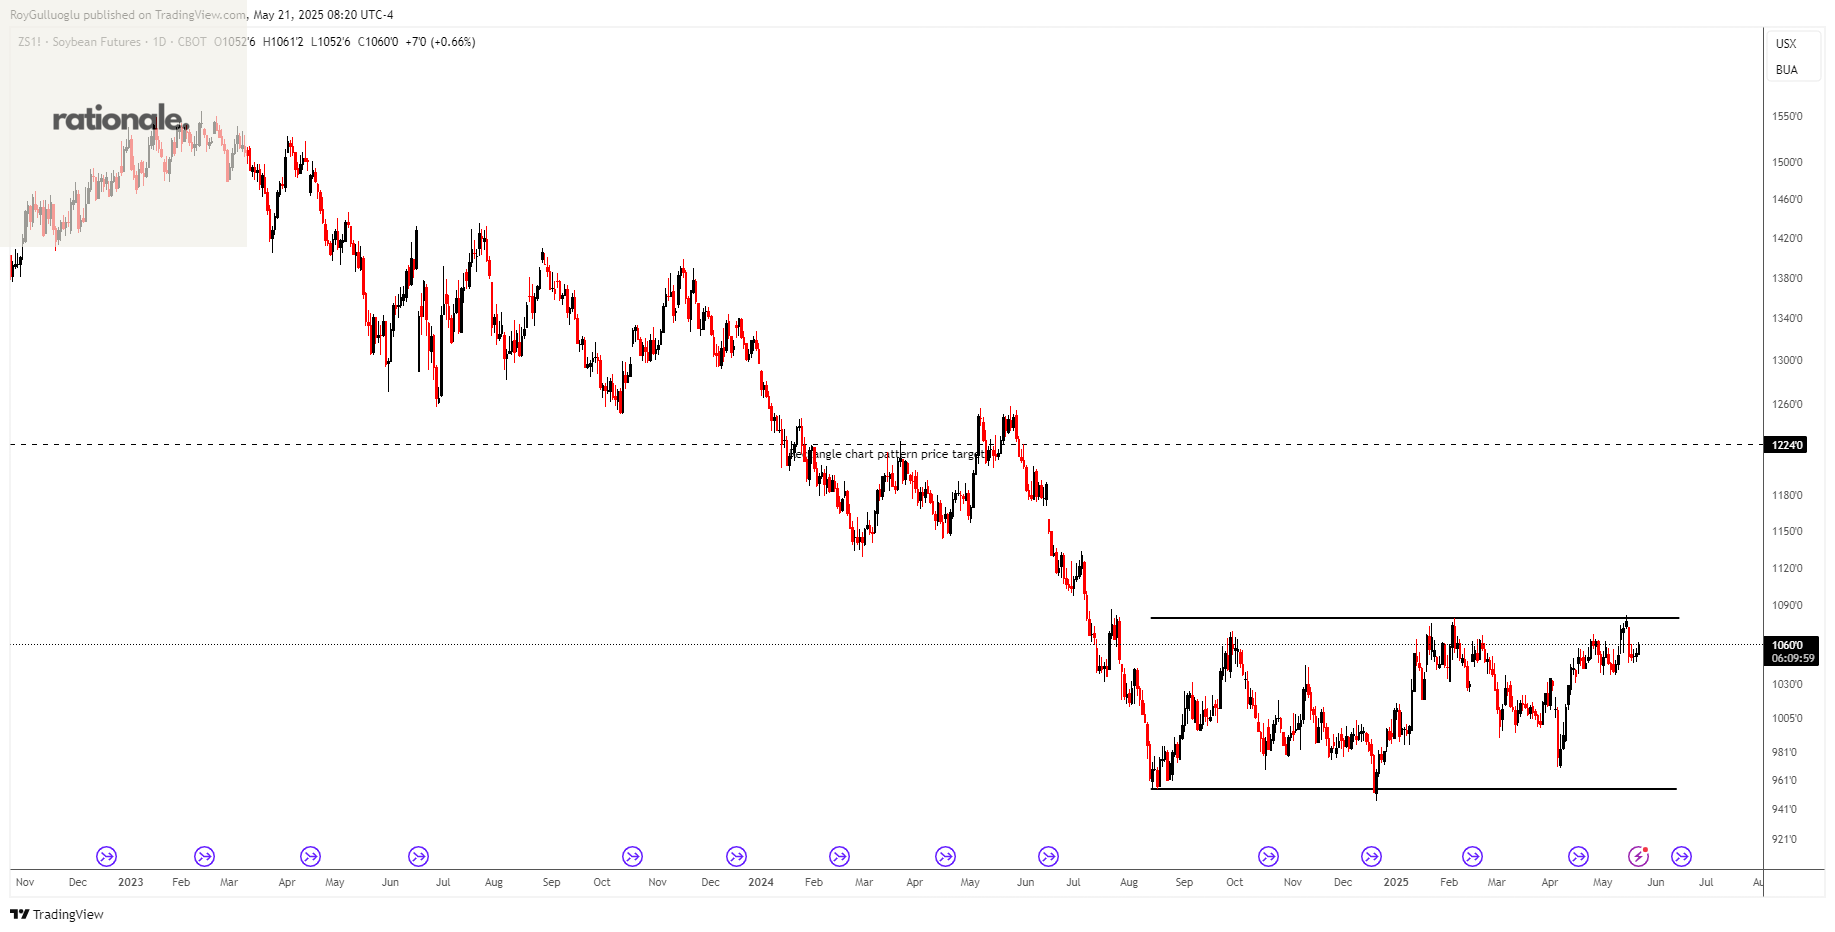
The above weekly chart formed an approximately 6-month-long rectangle chart pattern as a bullish reversal after a downtrend.
The horizontal boundary at 1080 levels acts as a resistance within this pattern.
A daily close above 1110 levels would validate the breakdown from the 6-month-long rectangle chart pattern.
Based on this chart pattern, the potential price target is approximately 1220 levels.
XU030D1!(BIST30 Futures)-Long/Short Idea
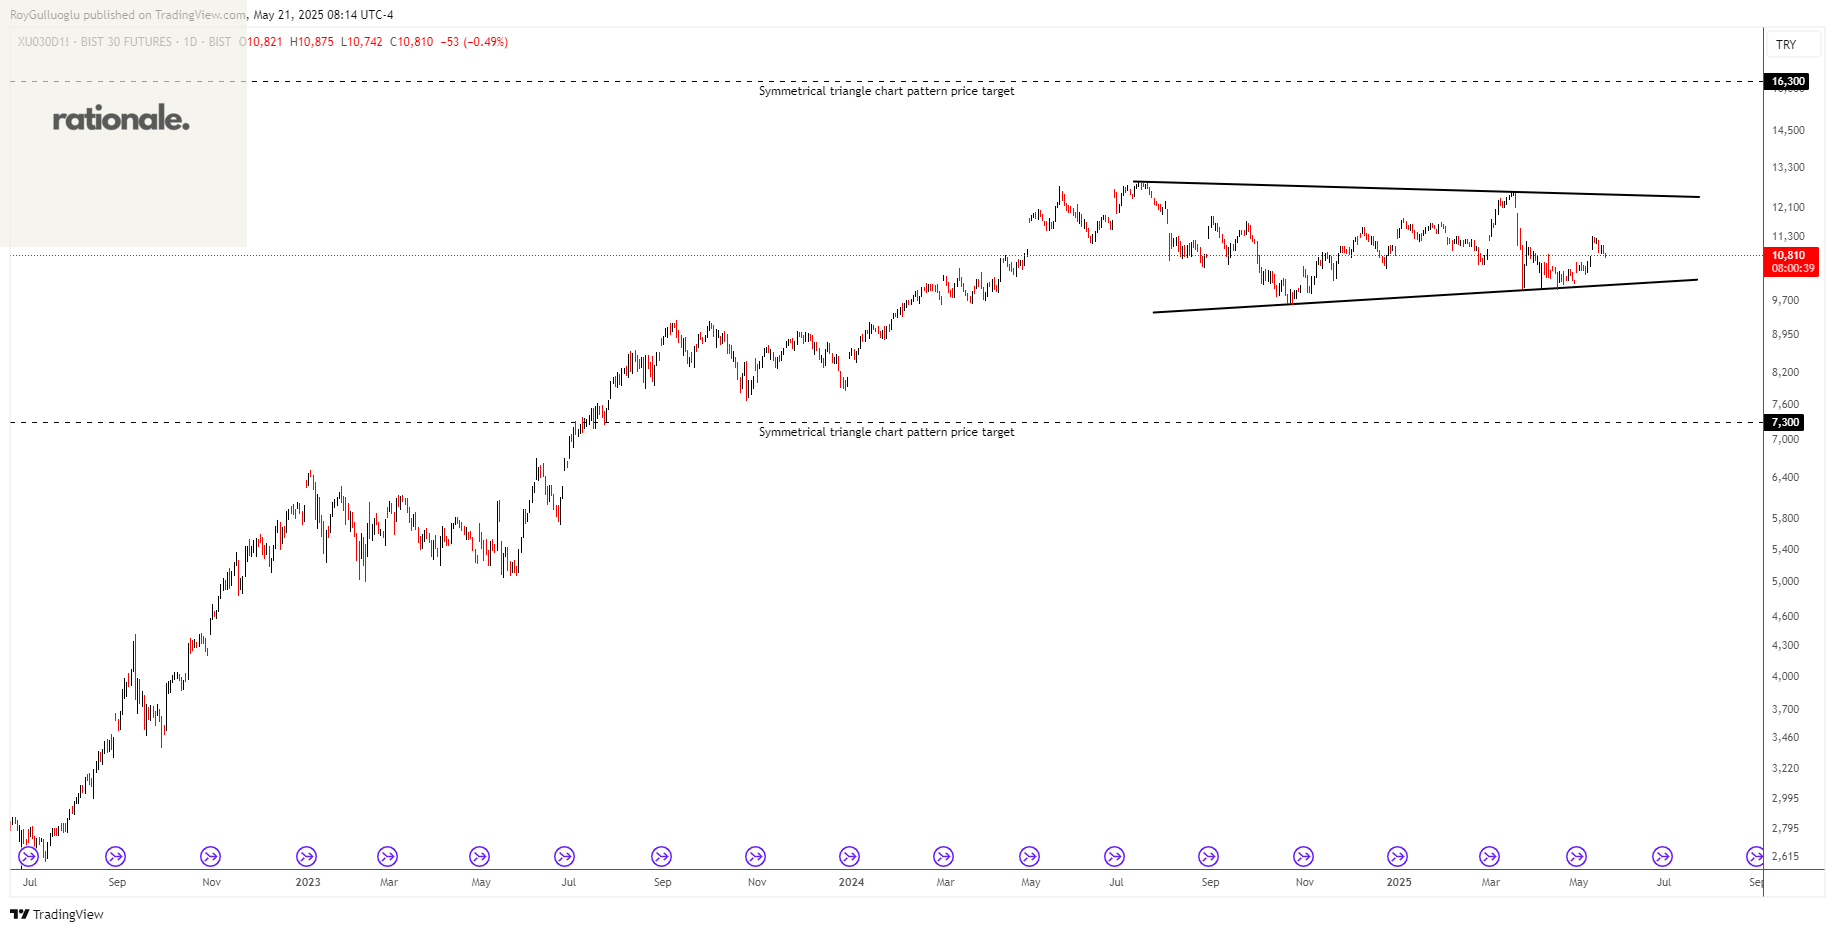
The above daily chart formed an approximately 7-month-long symmetrical triangle chart pattern as a bearish reversal or bullish continuation after an uptrend.
A daily close below 9700 levels would validate the breakdown and a daily close above 12950 would validate the breakout from the 7-month-long symmetrical triangle chart pattern.
Based on the chart patterns, the potential price targets are 7300 and 16300 levels respectively.