

Trade Ideas Fx-Futures-Etf-Crypto
EGLDUSDT, BNBUSDT, HOTUSDT, KDAUSDT, LITUSDT, PHAUSDT, YGGUSDT

EGLDUSDT-Long Idea
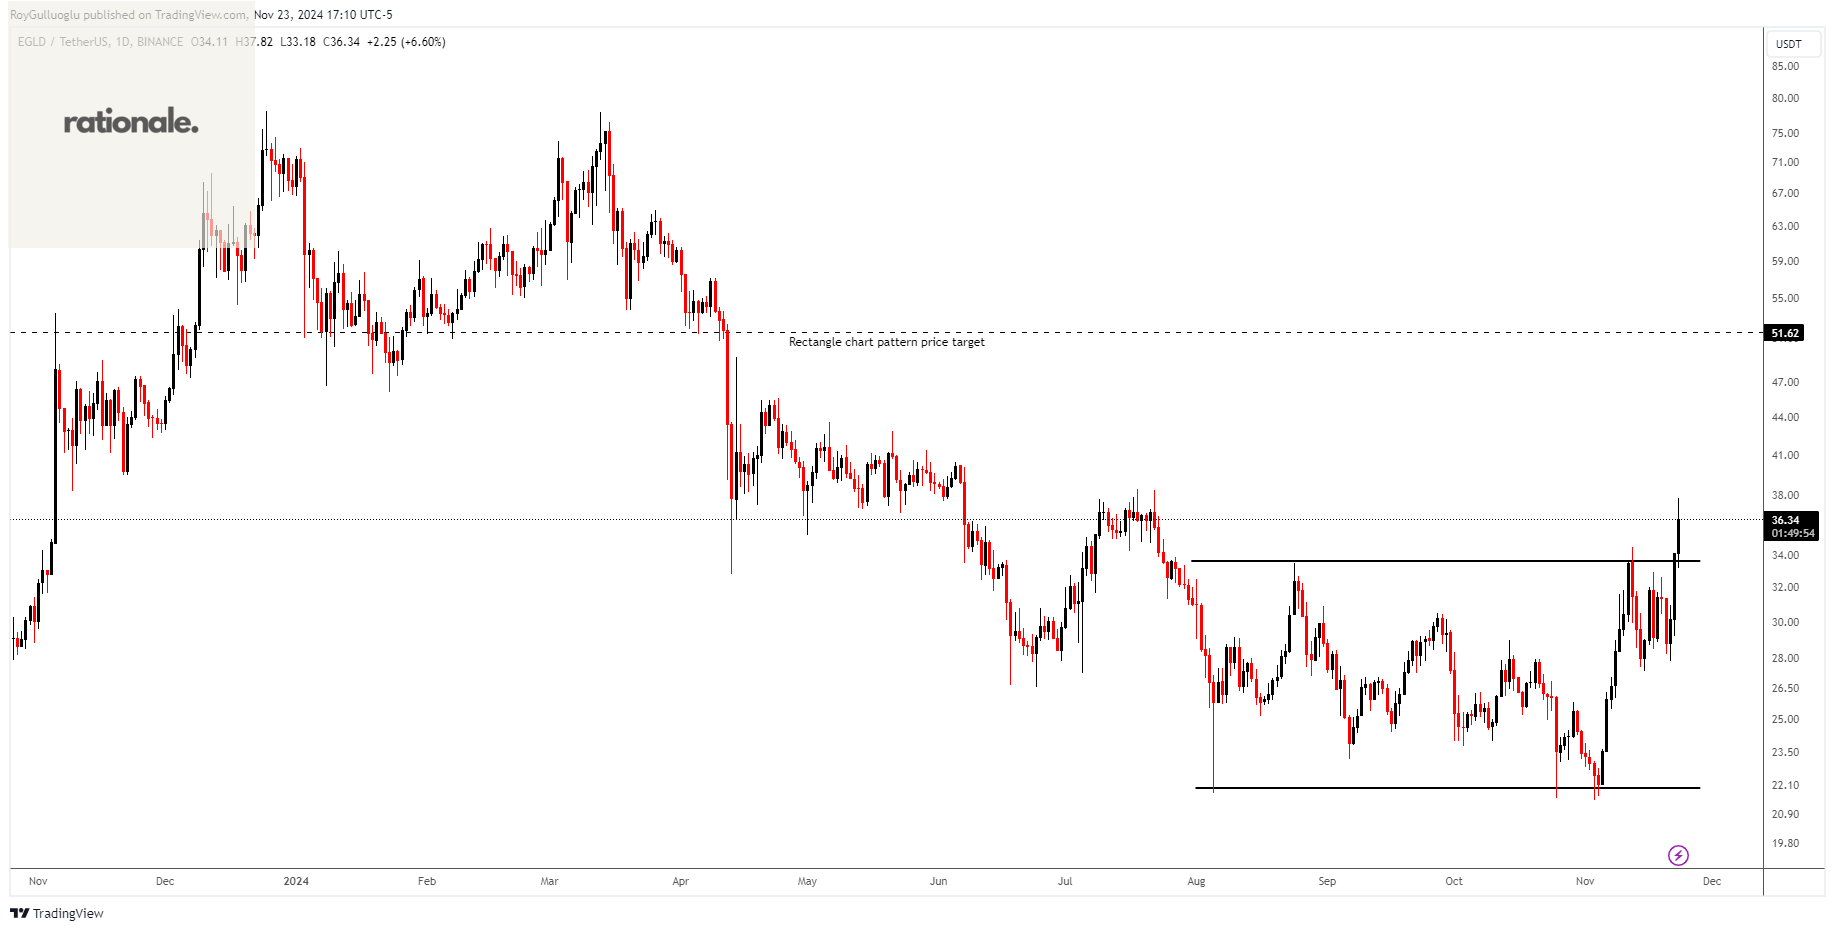
The above daily chart formed an approximately 4-month-long rectangle chart pattern as a bullish reversal after a downtrend.
The horizontal boundary at 33.58 levels acted as a resistance within this pattern.
A daily close above 34.58 levels validated the breakout from the 4-month-long rectangle chart pattern.
Based on this chart pattern, the potential price target is approximately 51.62 levels.
BNBUSDT-Long Idea
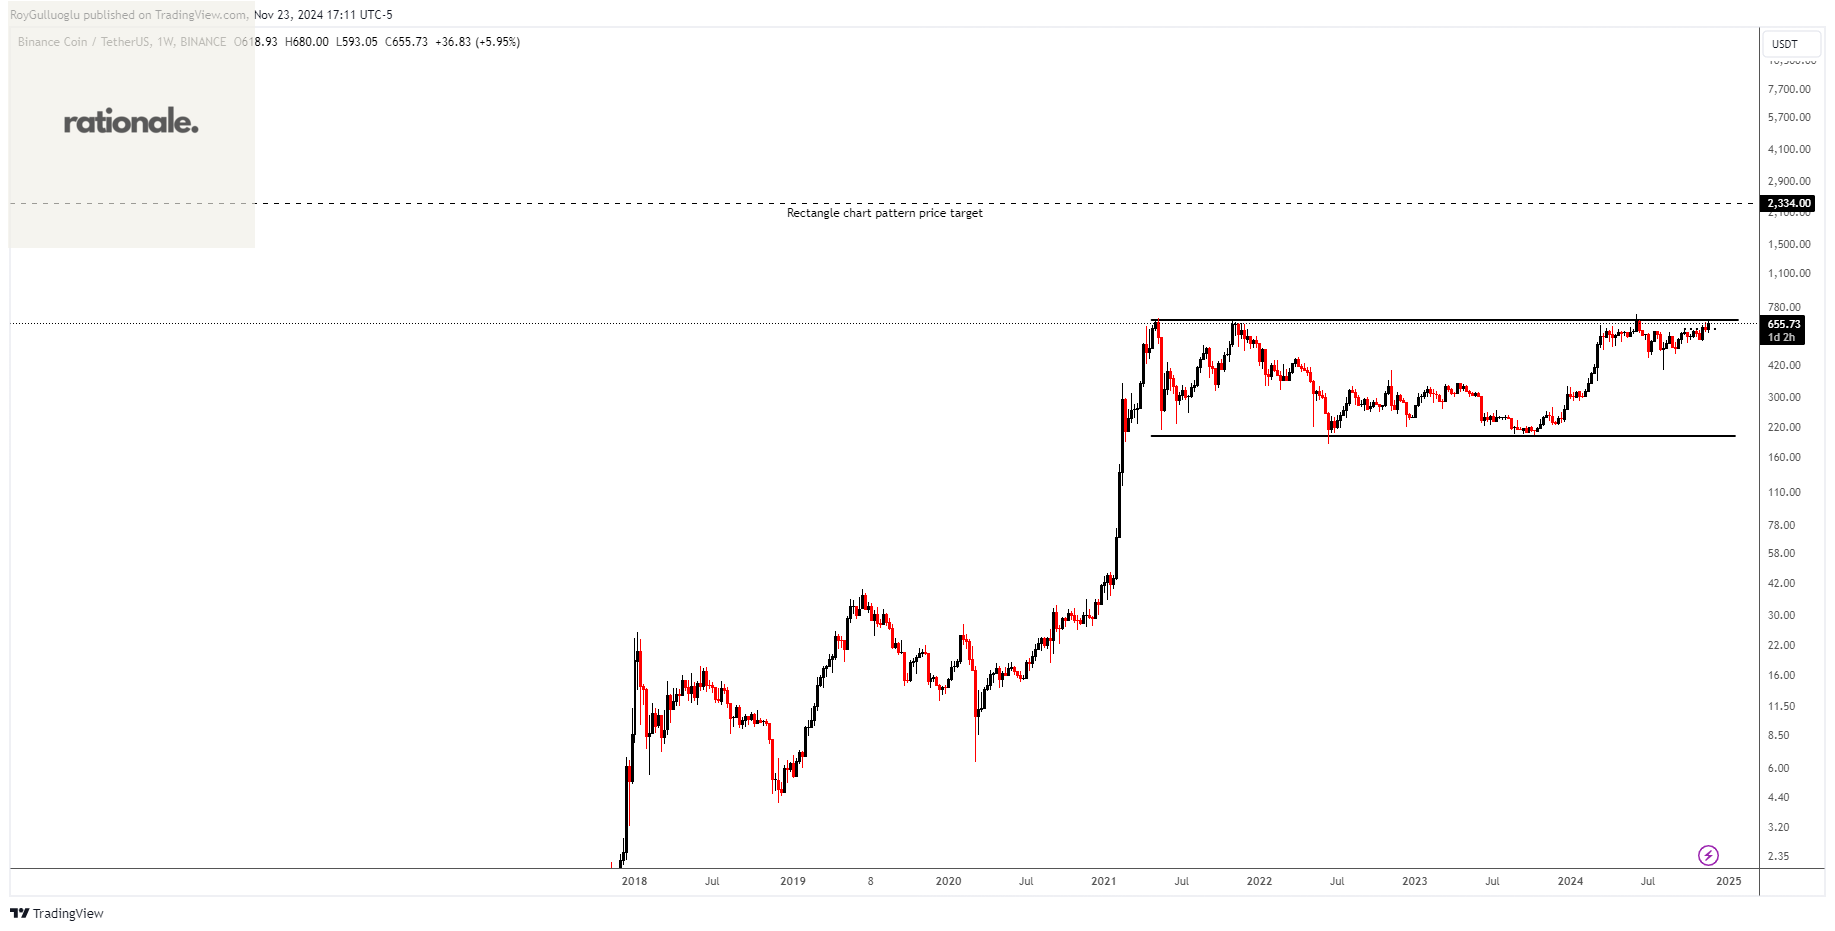
The above weekly chart formed an approximately 45-month-long rectangle chart pattern as a bullish reversal after a downtrend.
The horizontal boundary at 680 levels acts as a resistance within this pattern.
A daily close above 700 levels would validate the breakout from the 45-month-long rectangle chart pattern.
Based on this chart pattern, the potential price target is approximately 2334 levels.
HOTUSDT-Long Idea
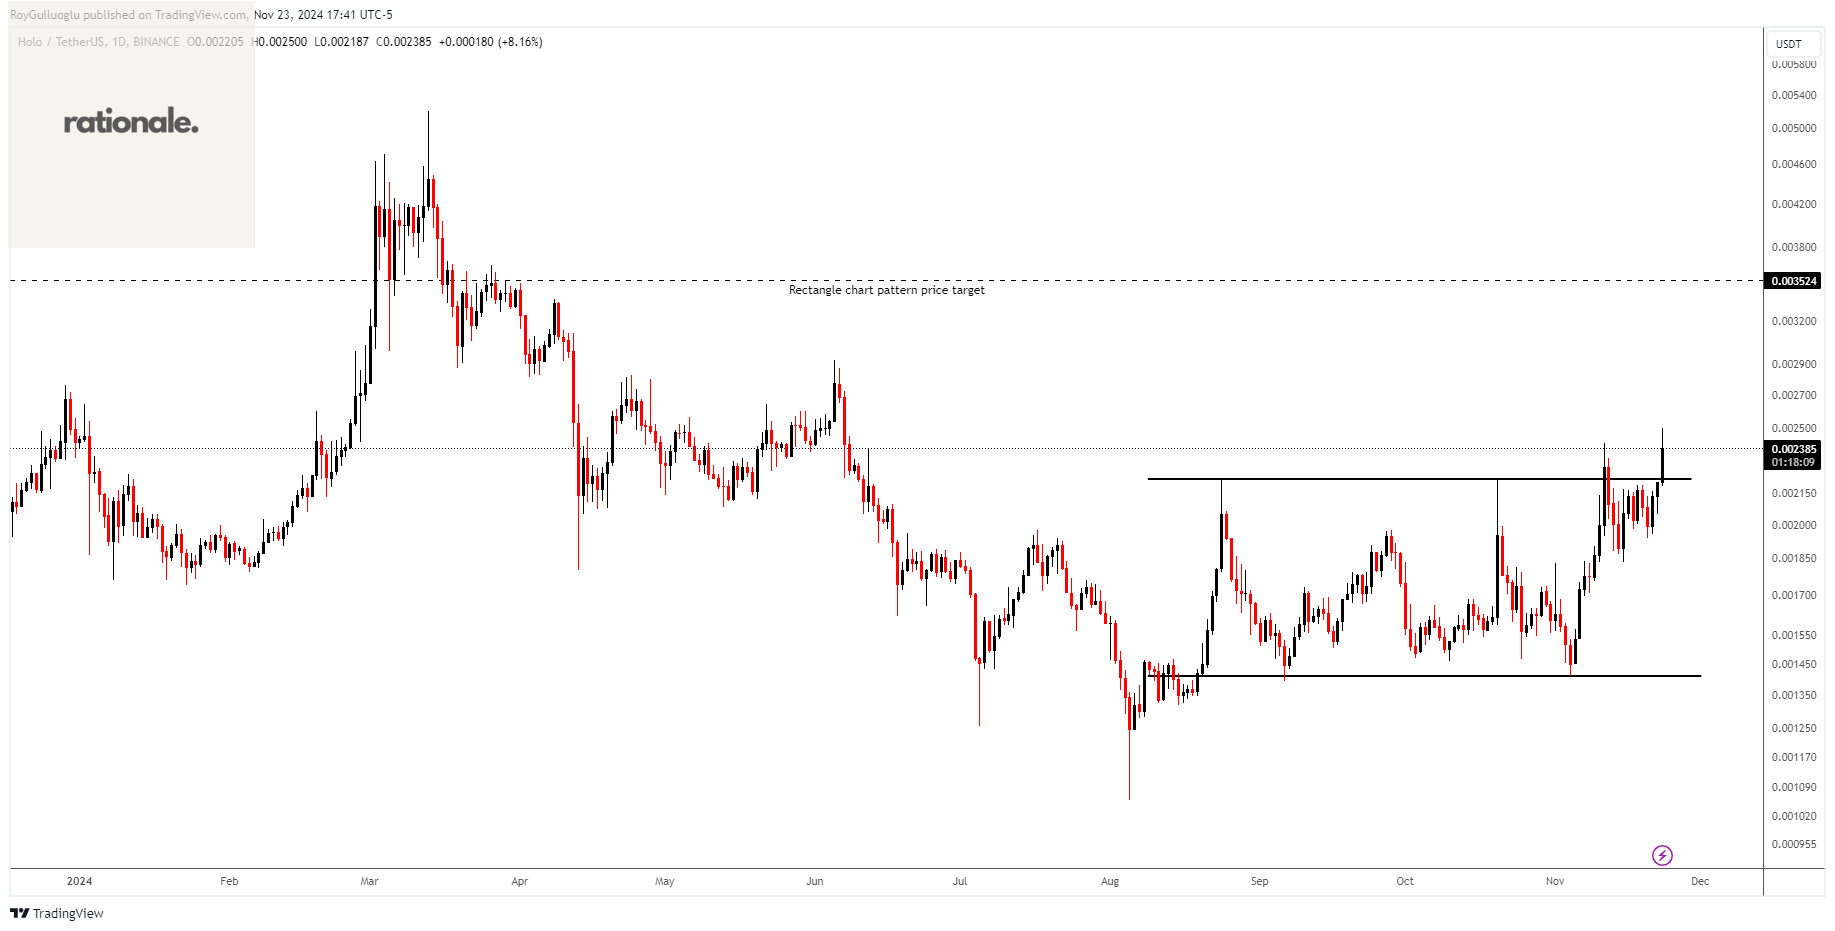
The above daily chart formed an approximately 3-month-long rectangle chart pattern as a bullish reversal after a downtrend.
The horizontal boundary at 0.002225 levels acted as a resistance within this pattern.
A daily close above 0.002291 levels validated the breakout from the 3-month-long rectangle chart pattern.
Based on this chart pattern, the potential price target is approximately 0.003524 levels.
KDAUSDT-Long Idea
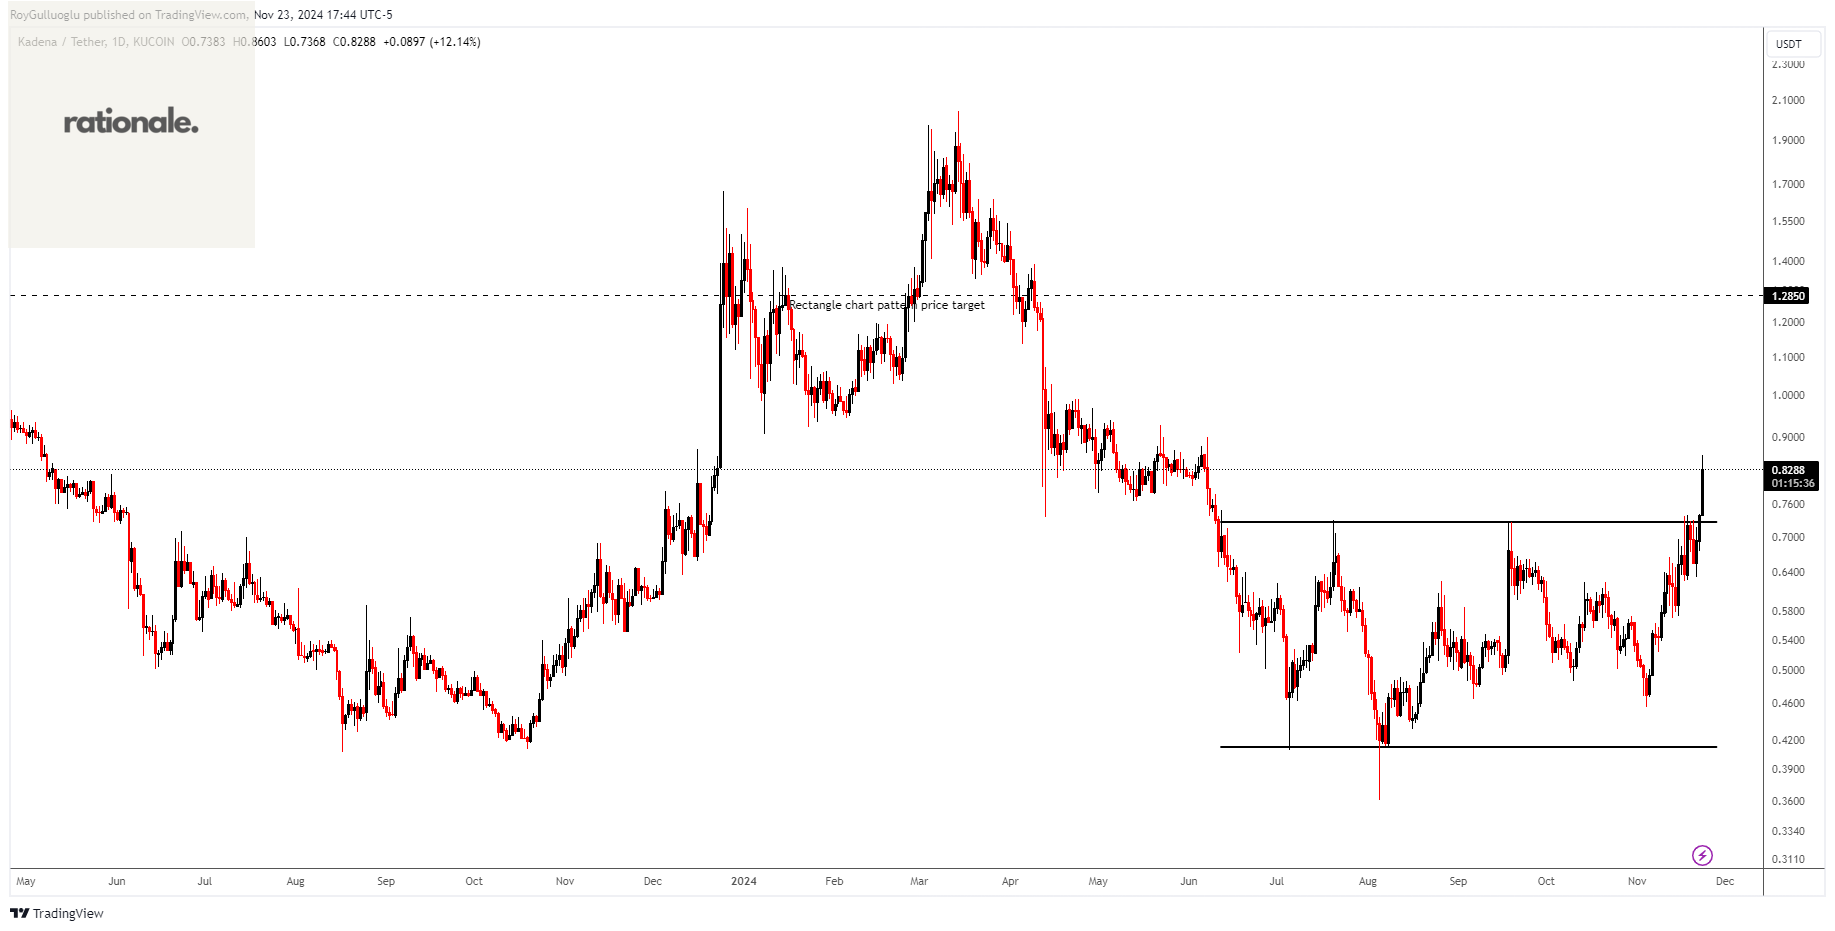
The above daily chart formed an approximately 5-month-long rectangle chart pattern as a bullish reversal after a downtrend.
The horizontal boundary at 0.7262 levels acted as a resistance within this pattern.
A daily close above 0.7480 levels validated the breakout from the 5-month-long rectangle chart pattern.
Based on this chart pattern, the potential price target is approximately 1.2850 levels.
LITUSDT-Long Idea
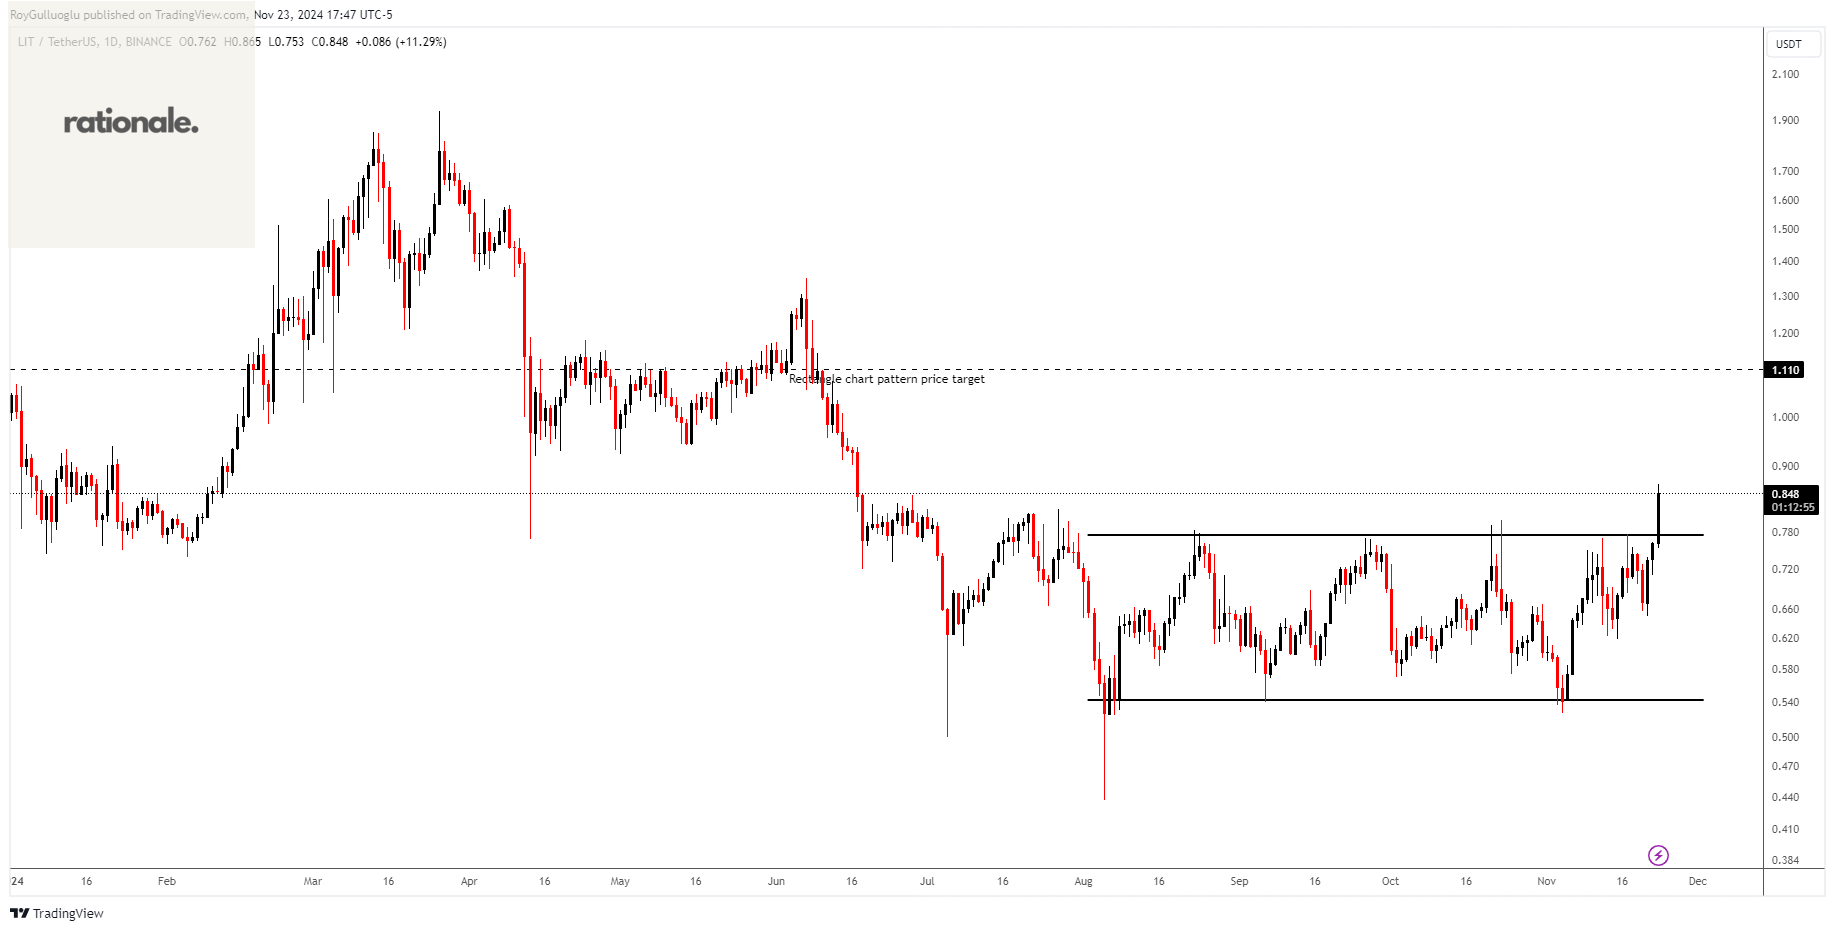
The above daily chart formed an approximately 3-month-long rectangle chart pattern as a bullish reversal after a downtrend.
The horizontal boundary at 0.775 levels acted as a resistance within this pattern.
A daily close above 0.7983 levels validated the breakout from the 3-month-long rectangle chart pattern.
Based on this chart pattern, the potential price target is approximately 1.11 levels.
PHAUSDT-Long Idea
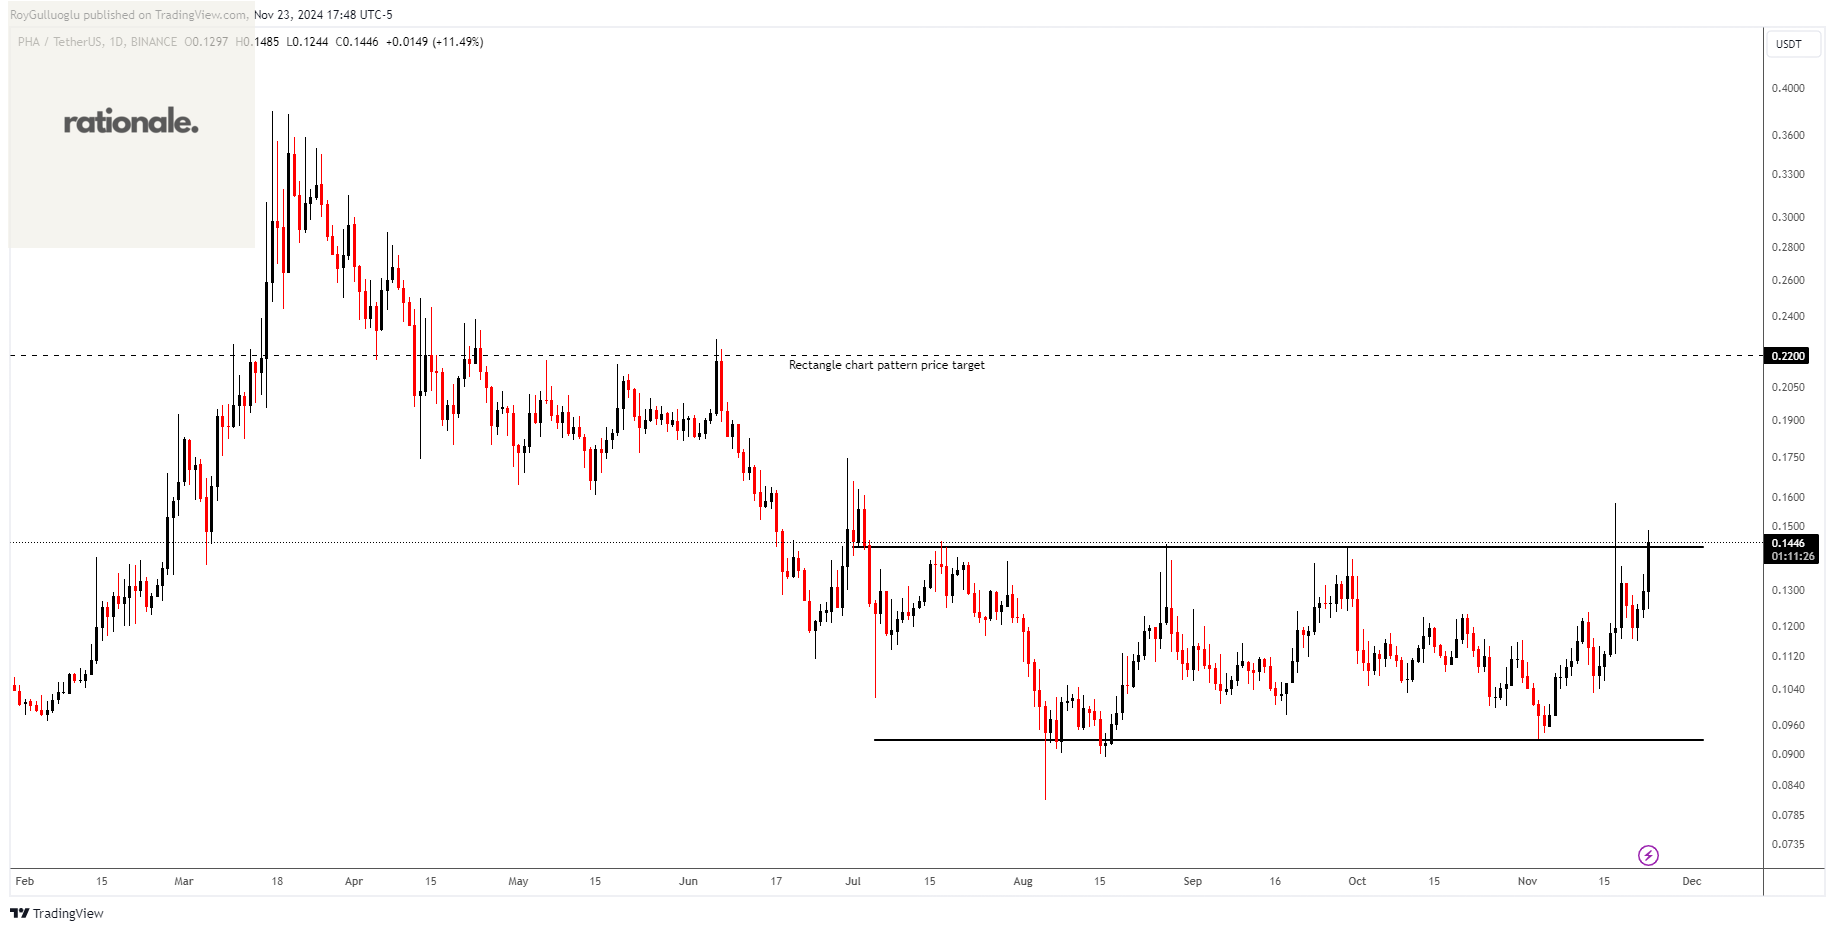
The above daily chart formed an approximately 5-month-long rectangle chart pattern as a bullish reversal after a downtrend.
The horizontal boundary at 0.143 levels acts as a resistance within this pattern.
A daily close above 0.1473 levels would validate the breakout from the 5-month-long rectangle chart pattern.
Based on this chart pattern, the potential price target is approximately 0.22 levels.
YGGUSDT-Long Idea
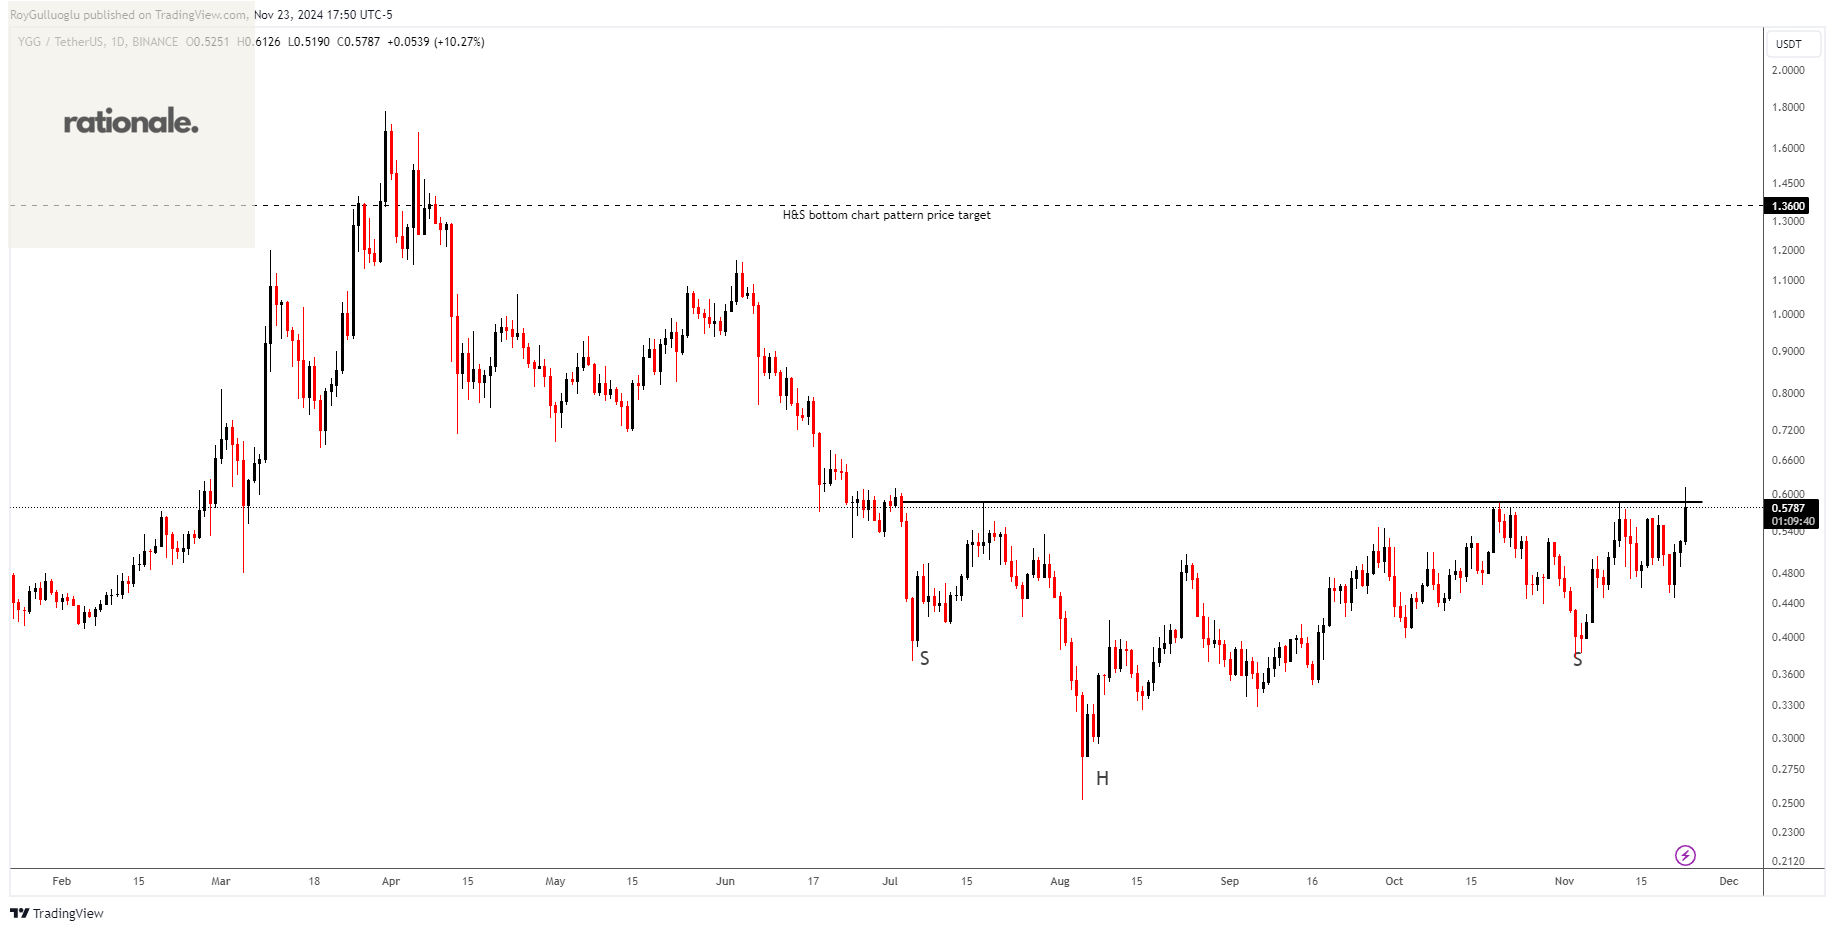
The above daily chart formed an approximately 5-month-long rectangle chart pattern as a bullish reversal after a downtrend.
The horizontal boundary at 0.5862 levels acts as a resistance within this pattern.
A daily close above 0.6037 levels would validate the breakout from the 5-month-long rectangle chart pattern.
Based on this chart pattern, the potential price target is approximately 1.36 levels.