

Trade Ideas Fx-Futures-Etf-Crypto
XRPUSDT, AVAXUSDT, ALICEUSDT, MXNJPY, TIP(ARCA)

XRPUSDT-Long Idea
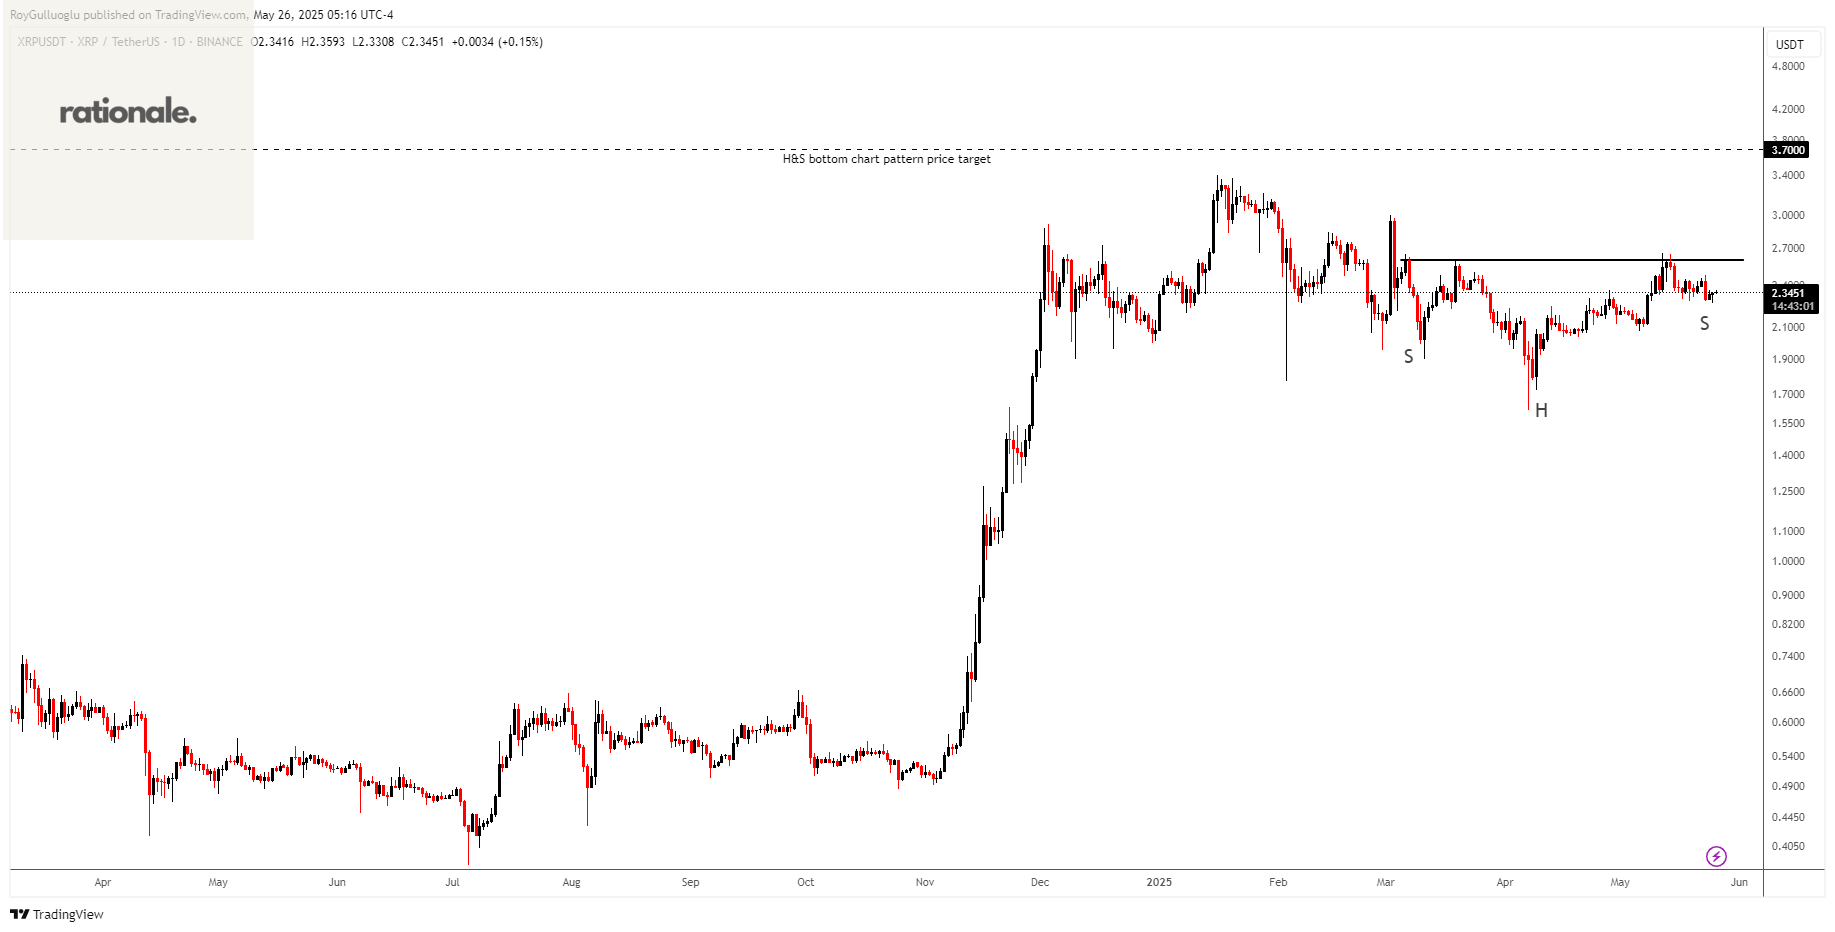
The above daily chart might form an approximately 3-month-long H&S bottom chart pattern as a bullish reversal after a downtrend.
The horizontal boundary at 2.6 levels acts as a resistance within this pattern.
A daily close above 2.678 levels would validate the breakout from the 3-month-long H&S bottom chart pattern.
Based on this chart pattern, the potential price target is approximately 3.7 levels.
AVAXUSDT-Long Idea
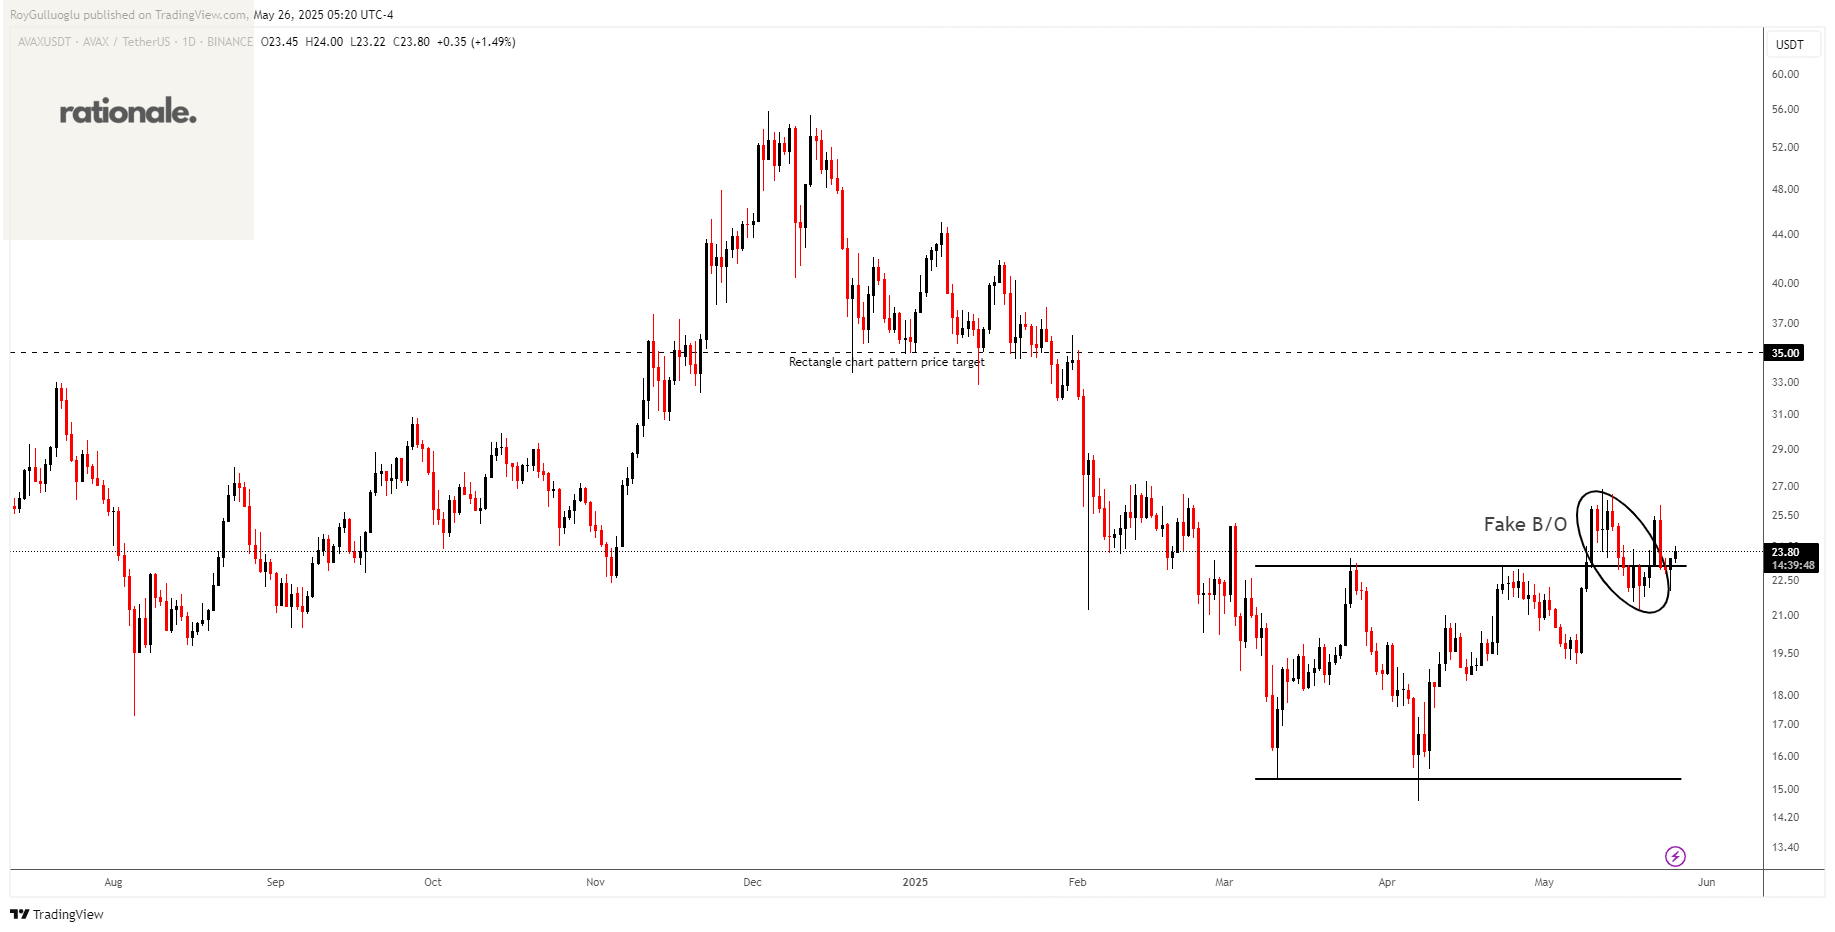
The above daily chart formed an approximately 2-month-long rectangle chart pattern as a bullish reversal after a downtrend.
The horizontal boundary at 23.1 levels acts as a resistance within this pattern.
A daily close above 23.79 levels would validate the breakout from the 2-month-long rectangle chart pattern.
Based on this chart pattern, the potential price target is approximately 35 levels.
ALICEUSDT-Long Idea
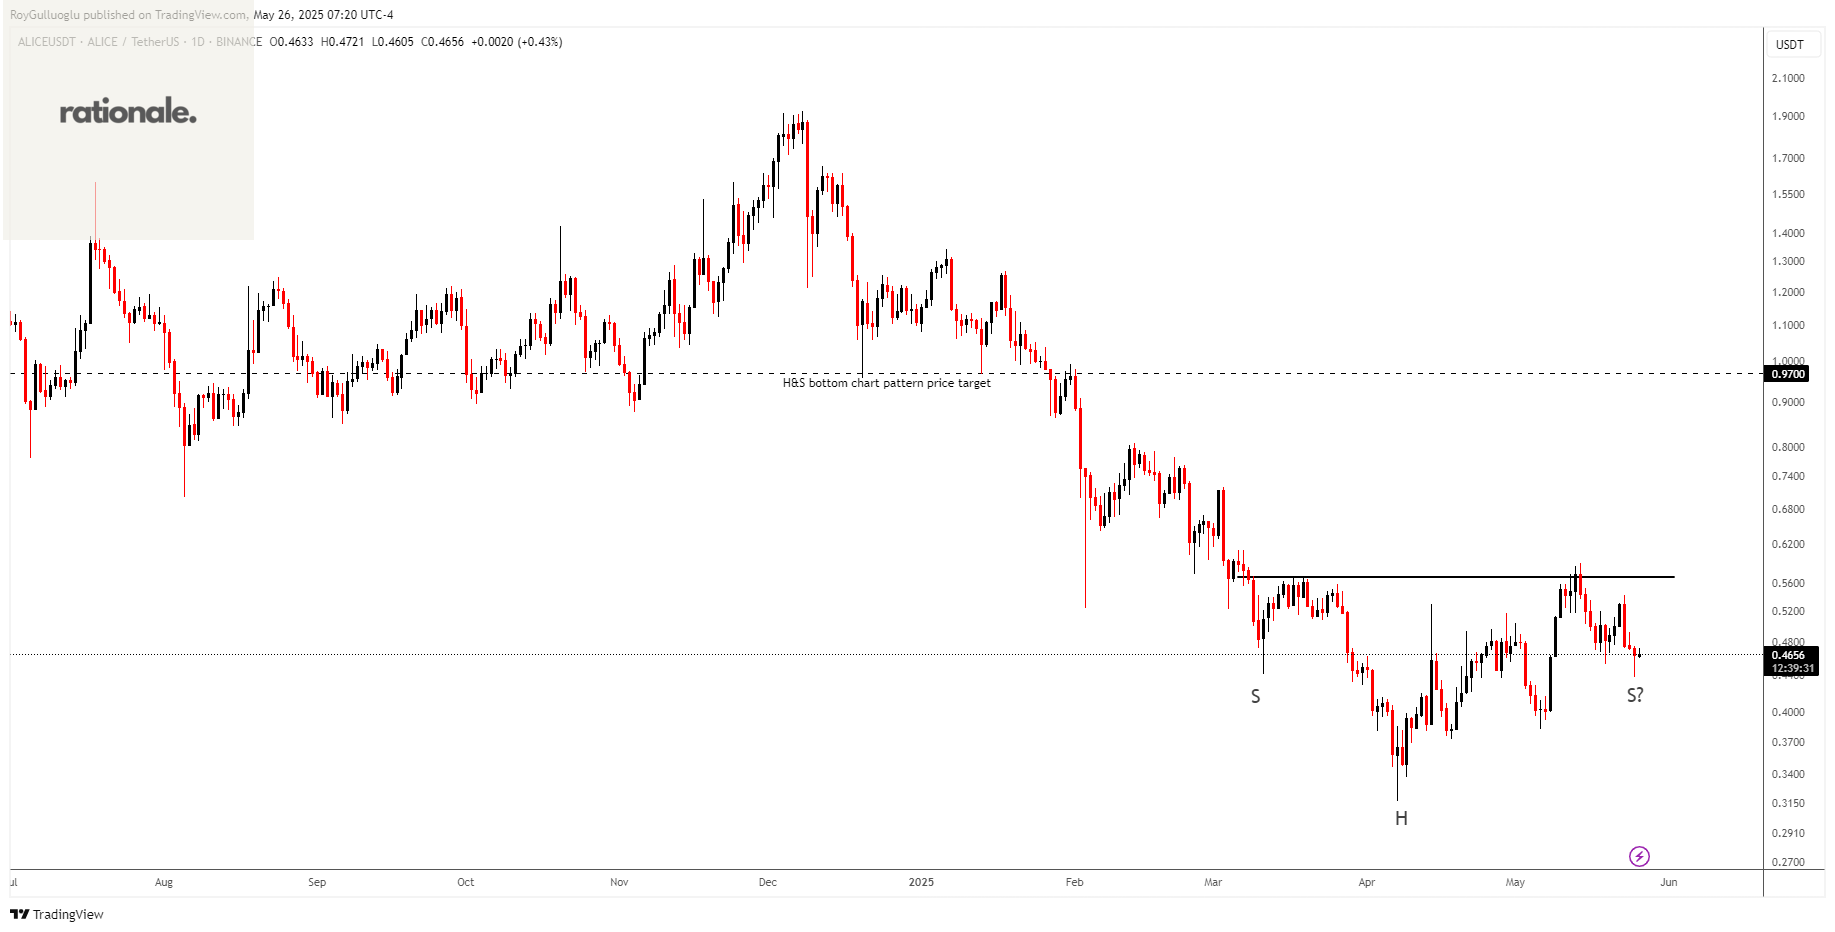
The above daily chart might form an approximately 3-month-long H&S bottom chart pattern as a bullish reversal after a downtrend.
The horizontal boundary at 0.5693 levels acts as a resistance within this pattern.
A daily close above 0.5863 levels would validate the breakout from the 3-month-long H&S bottom chart pattern.
Based on this chart pattern, the potential price target is approximately 0.97 levels.
MXNJPY-Short Idea
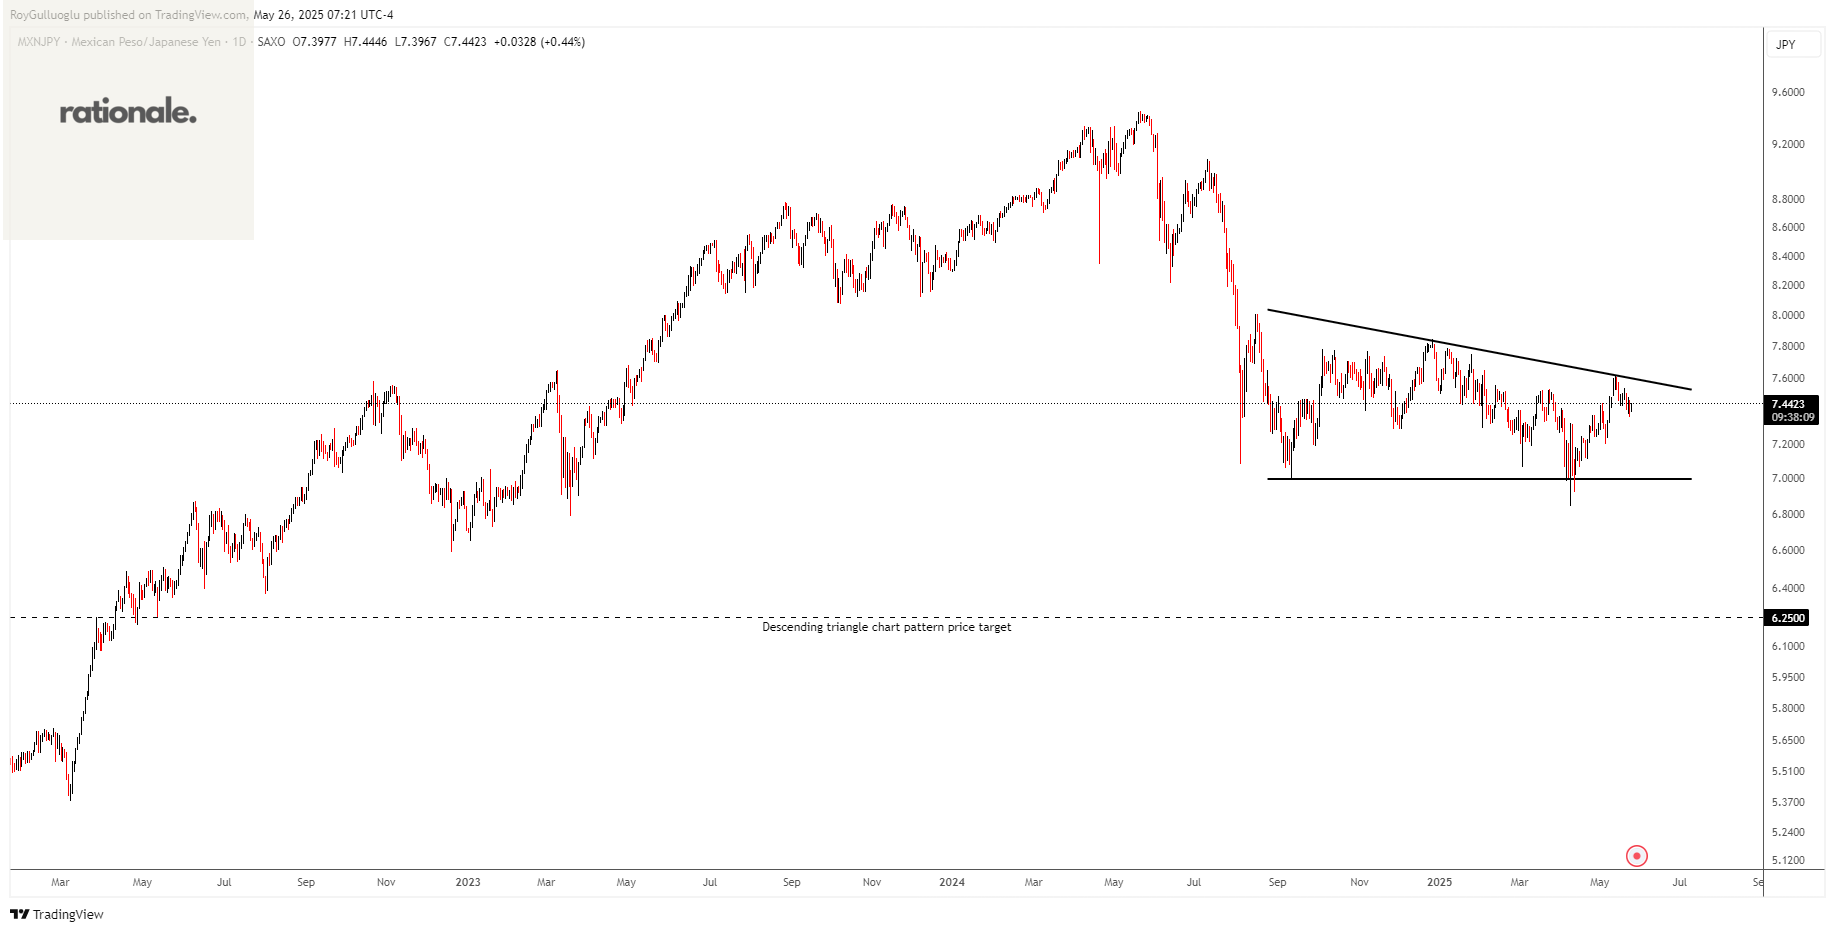
The above daily chart formed an approximately 6-month-long descending triangle chart pattern as a bearish continuation after a downtrend.
The horizontal boundary at 6.9947 levels acts as a support within this pattern.
A daily close below 6.9247 levels would validate the breakout from the 6-month-long descending triangle chart pattern.
Based on this chart pattern, the potential price target is approximately 6.25 levels.
iShares TIPS Bond ETF-(TIP/ARCA)-Long Idea
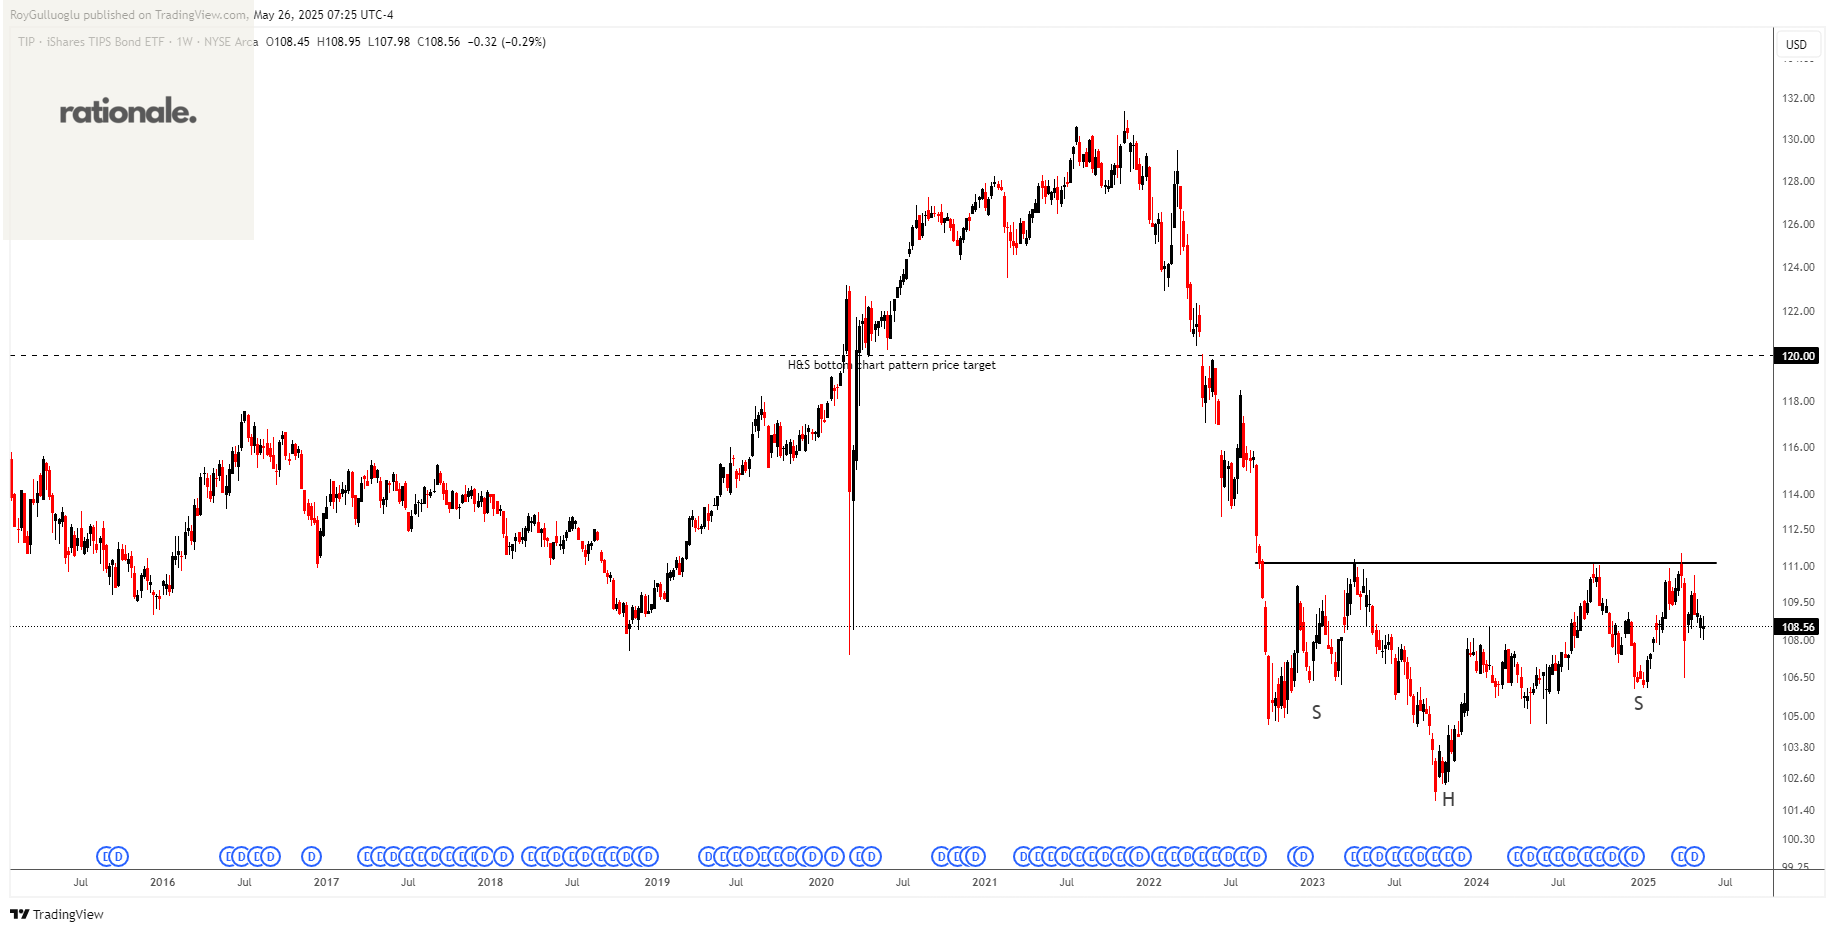
The above daily chart formed an approximately 5-month-long H&S bottom chart pattern as a bullish reversal after a downtrend.
The horizontal boundary at 111.13 levels acts as a resistance within this pattern.
A daily close above 111.81(ATR(10/30)/2+boundary) levels would validate the breakout from the 5-month-long H&S bottom chart pattern.
Based on this chart pattern, the potential price target is approximately 120 levels.
Teşekkürler Roy