

Trade Ideas Fx-Futures-Etf-Crypto
AW1!(CBOT), MBB(NASDAQ), ADAUSDT, XLMUSDT

AW1!(Bloomberg Commodity Index Futures)-Long Idea
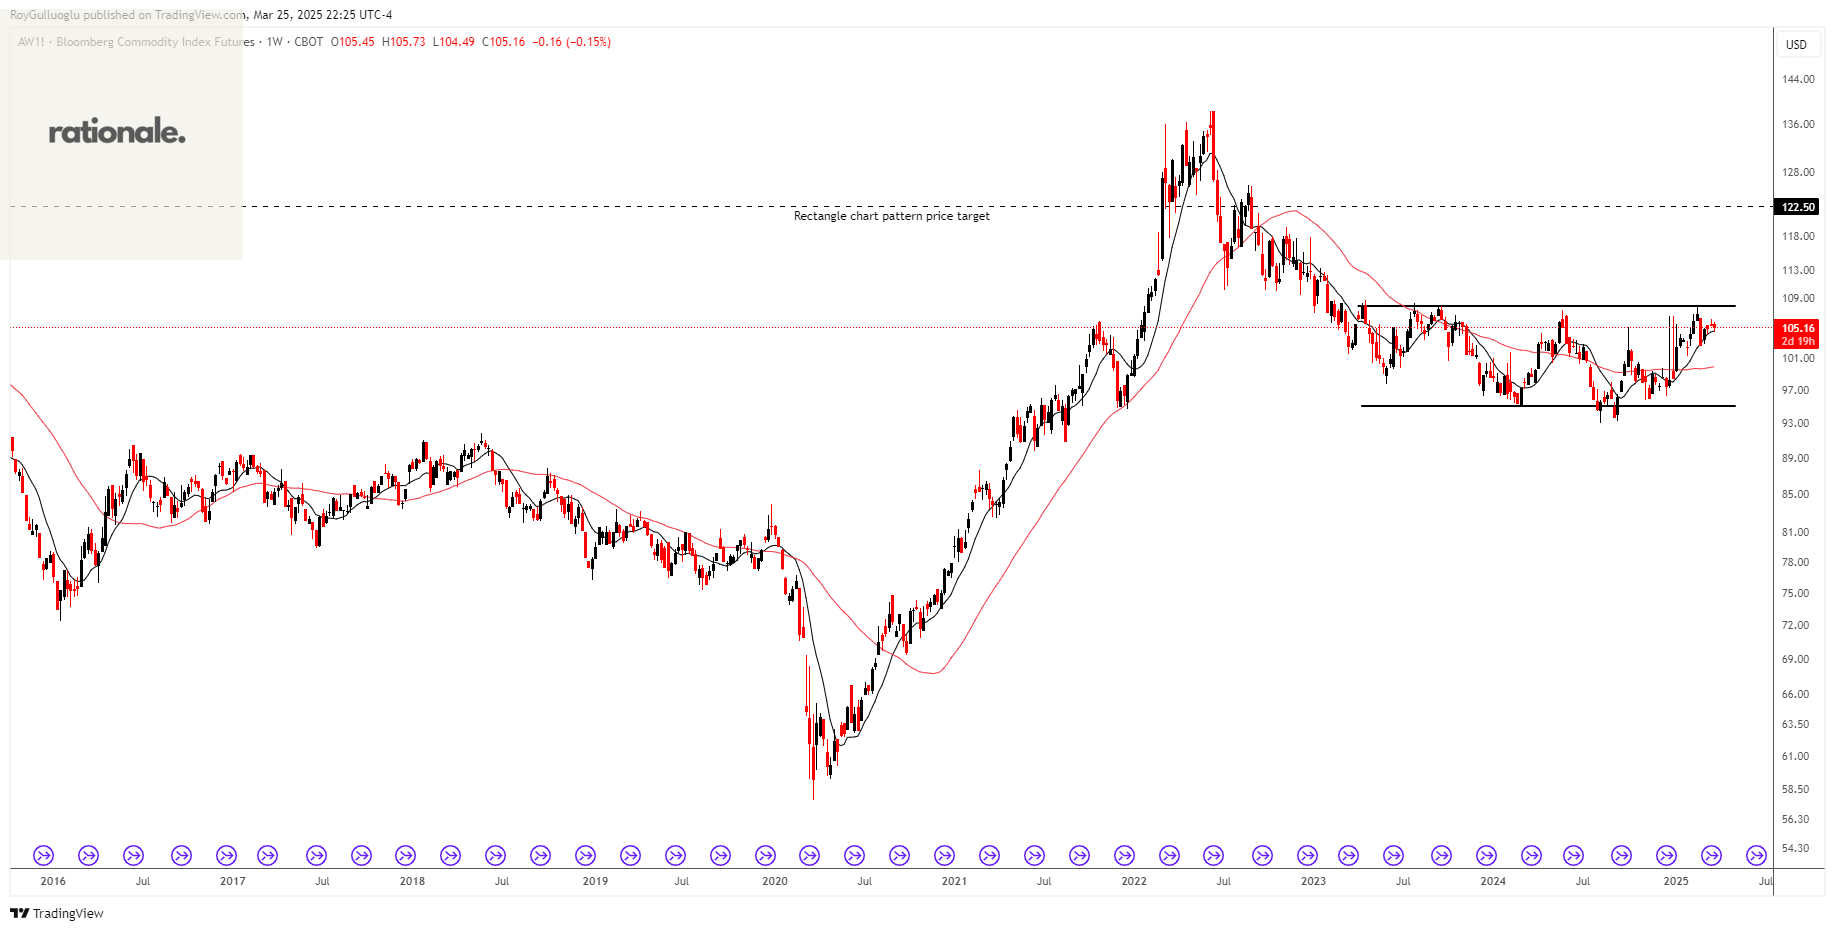
The Bloomberg Commodities Index, known as BCOM, is a leading commodities benchmark providing broad-based exposure to commodities, without a single commodity or commodity sector dominating the index. BCOM is constructed using 24 of the most traded commodities futures contracts across six sectors, reweighted and rebalanced annually on a price-percentage basis.
The above weekly chart formed an approximately 25-month-long rectangle chart pattern as a bullish reversal after a downtrend.
The horizontal boundary at 107.93 levels acts as a resistance within this pattern.
A daily close above 111.17 levels would validate the breakdown from the 25-month-long rectangle chart pattern.
Based on this chart pattern, the potential price target is approximately 122.5 levels.
iShares MBS ETF-(MBB/NASDAQ)-Long Idea
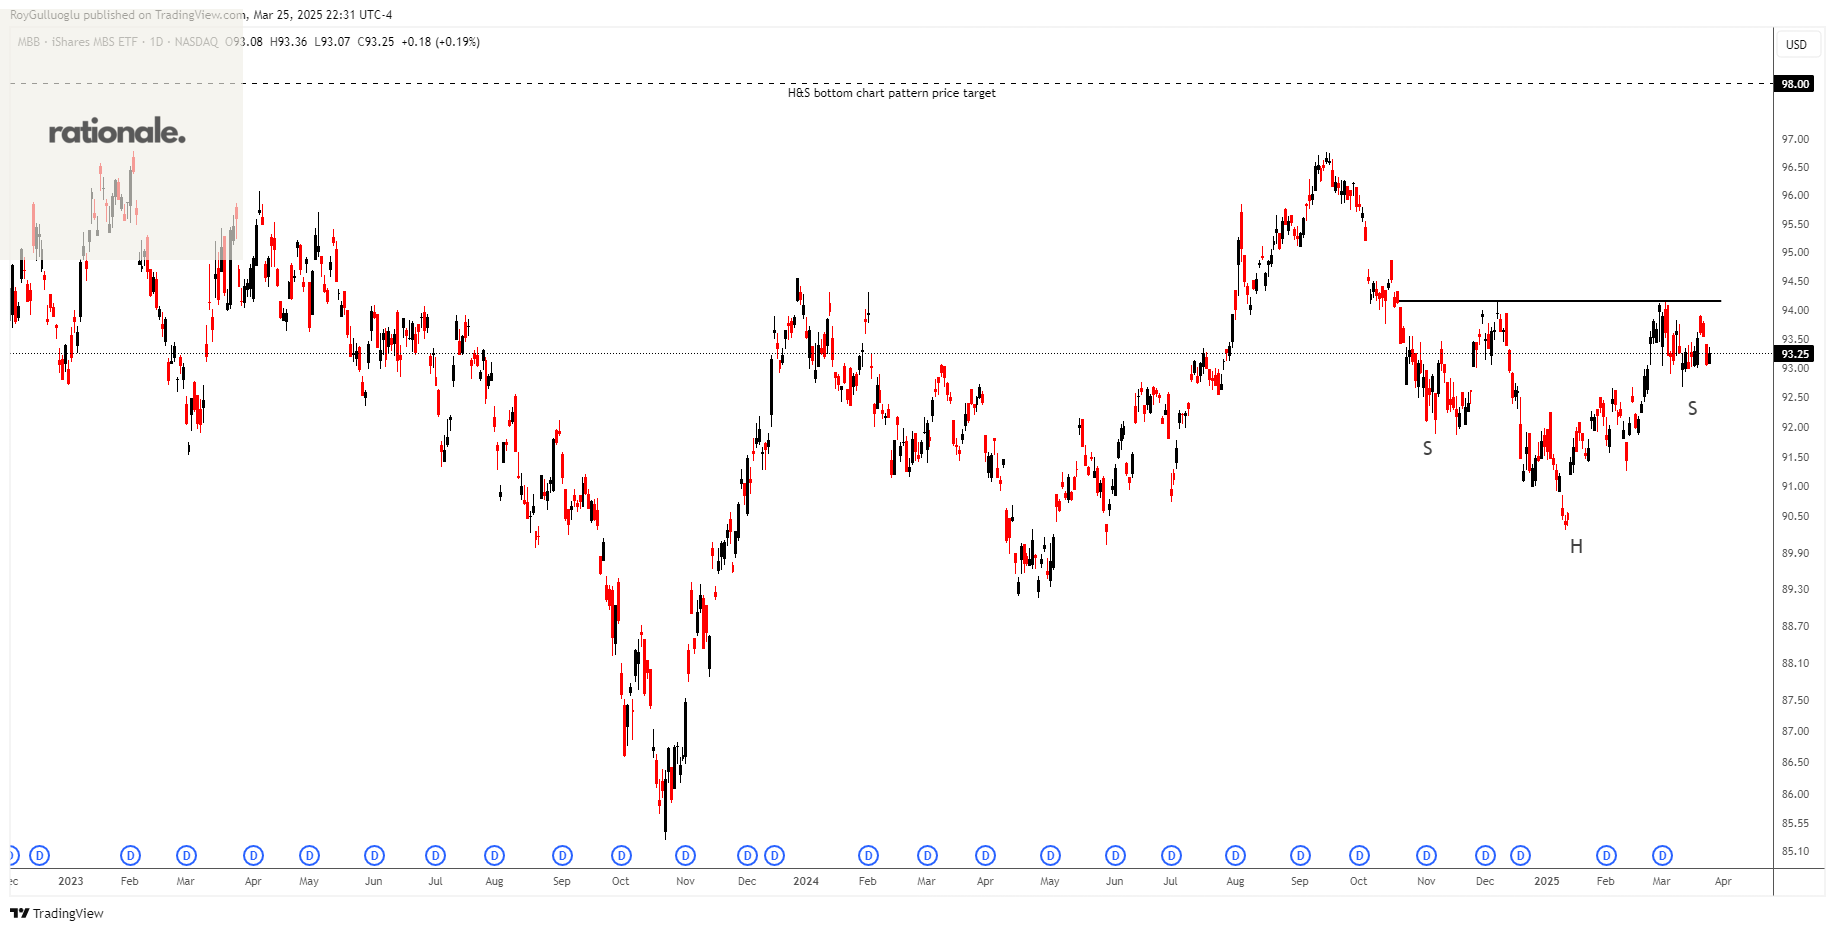
The iShares MBS ETF (MBB) seeks to track the investment results of an index composed of investment-grade mortgage-backed pass-through securities issued and/or guaranteed by U.S. government agencies.
The above daily chart formed an approximately 3-month-long H&S bottom chart pattern as a bullish reversal after a downtrend.
The horizontal boundary at 94.16 levels acts as a resistance within this pattern.
A daily close above 94.5(ATR(10/30)/2+boundary) levels would validate the breakout from the 23-month-long H&S bottom chart pattern.
Based on this chart pattern, the potential price target is approximately 98 levels.
ADAUSDT-Long Idea
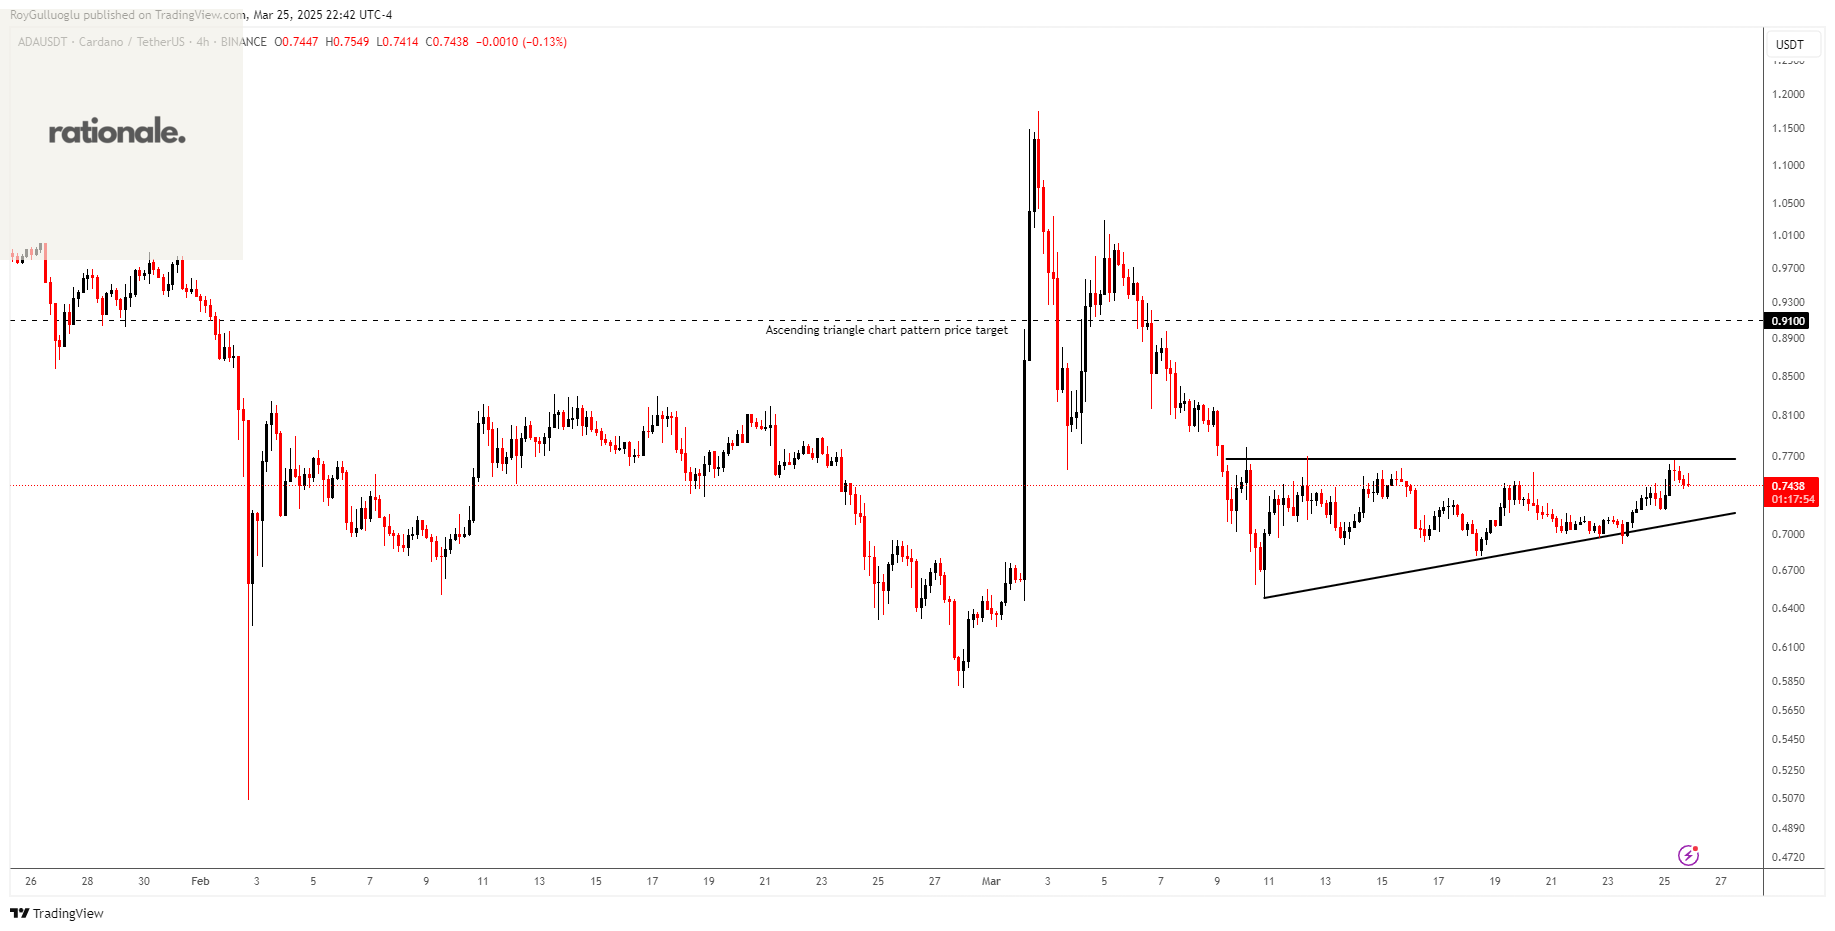
The above 4-hour chart formed an ascending triangle chart pattern as a bullish reversal after a downtrend.
The horizontal boundary at 0.7675 levels acts as a resistance within this pattern.
A daily close above 0.79 levels would validate the breakout from the ascending triangle chart pattern.
Based on this chart pattern, the potential price target is approximately 0.91 levels.
XLMUSDT-Long Idea
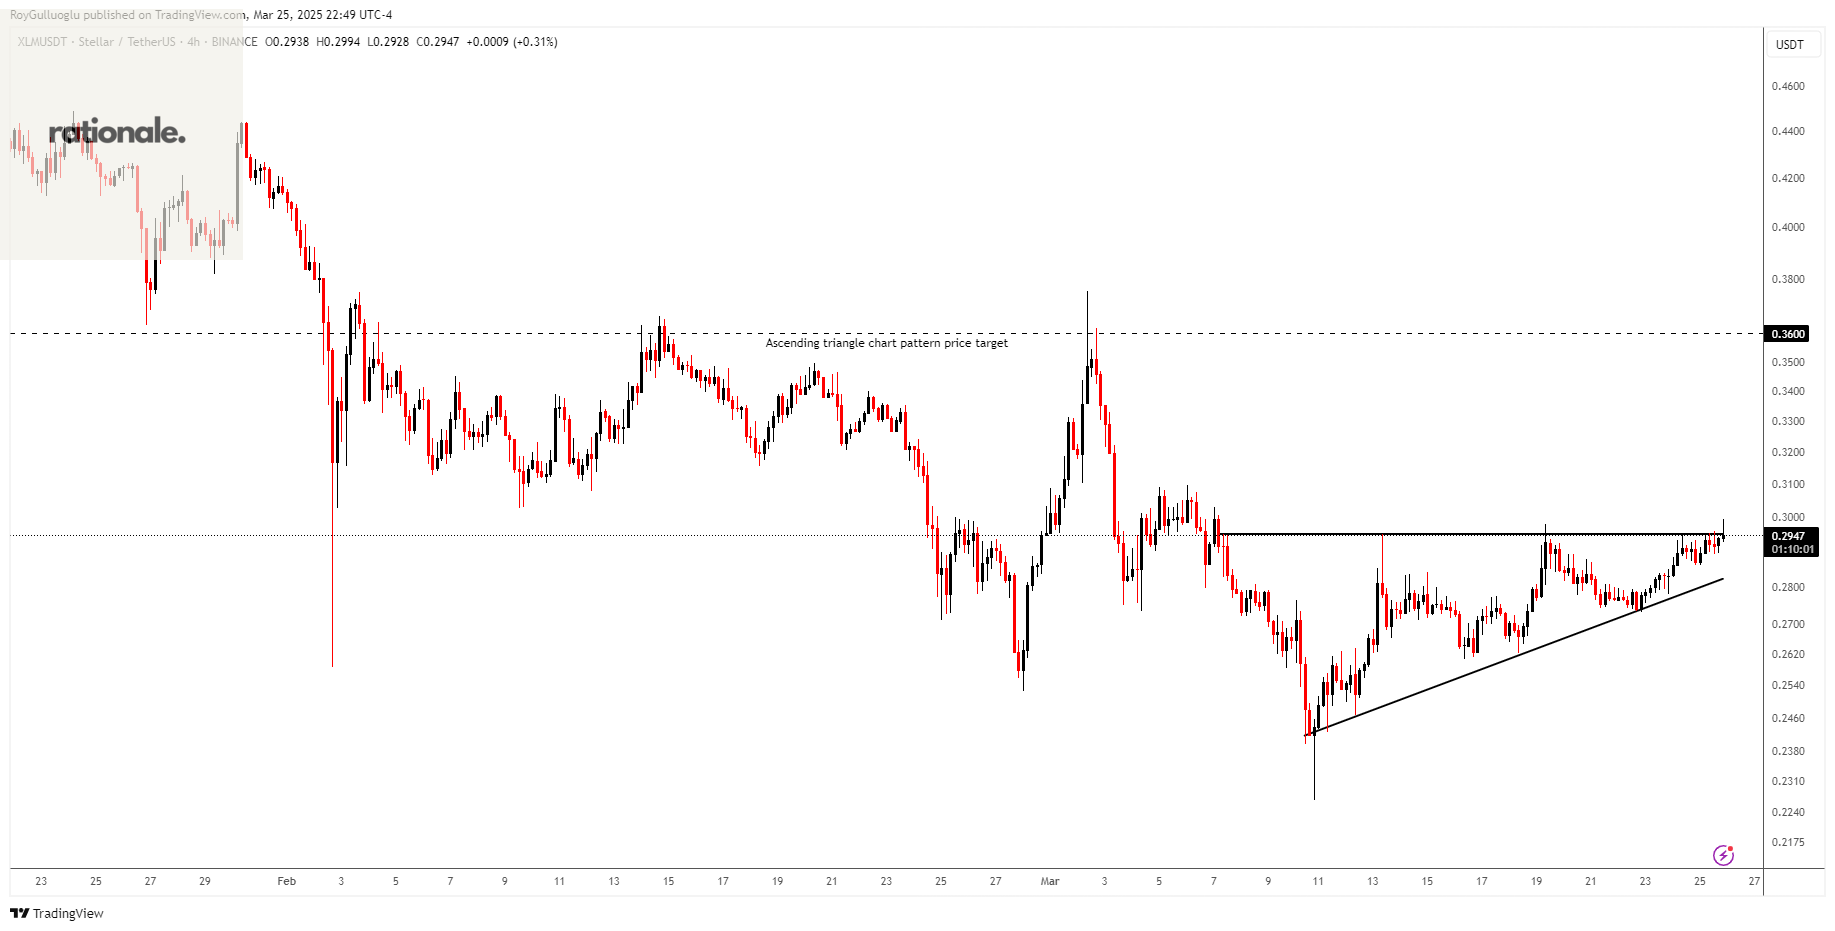
The above 4-hour chart formed an ascending triangle chart pattern as a bullish reversal after a downtrend.
The horizontal boundary at 0.295 levels acts as a resistance within this pattern.
A daily close above 0.3038 levels would validate the breakout from the ascending triangle chart pattern.
Based on this chart pattern, the potential price target is approximately 0.36 levels.