


Hey everyone! The latest Market Update episode is now live, along with the new FX Futures ETF Crypto report!
iShares Russell 2000 ETF-(IWM/ARCA)-Long Idea
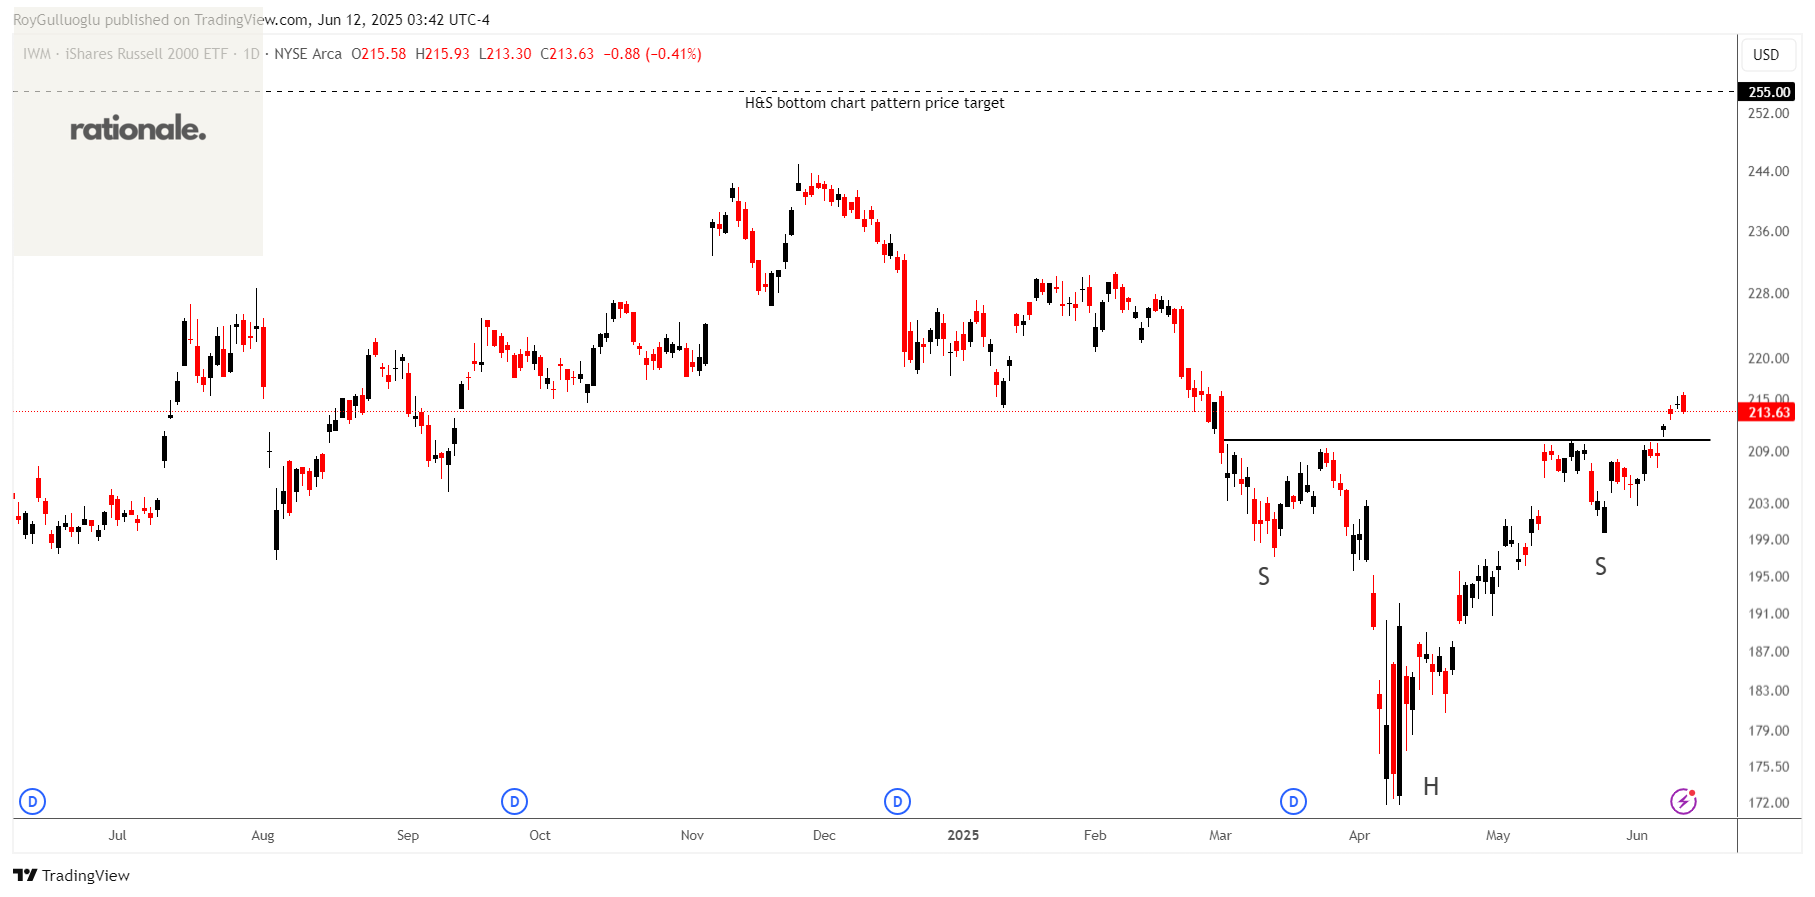
The iShares Russell 2000 ETF seeks to track the investment results of an index composed of small-capitalization U.S. equities.
The above daily chart formed an approximately 2-month-long H&S bottom chart pattern as a bullish reversal after a downtrend.
The horizontal boundary at 210.18 levels acts as a support within this pattern.
A daily close above 216.48 levels would validate the breakout from the 2-month-long H&S bottom chart pattern.
Based on this chart pattern, the potential price target is approximately 255 levels.
Utilities Select Sector SPDR Fund ETF-(XLU/ARCA)-Long Idea
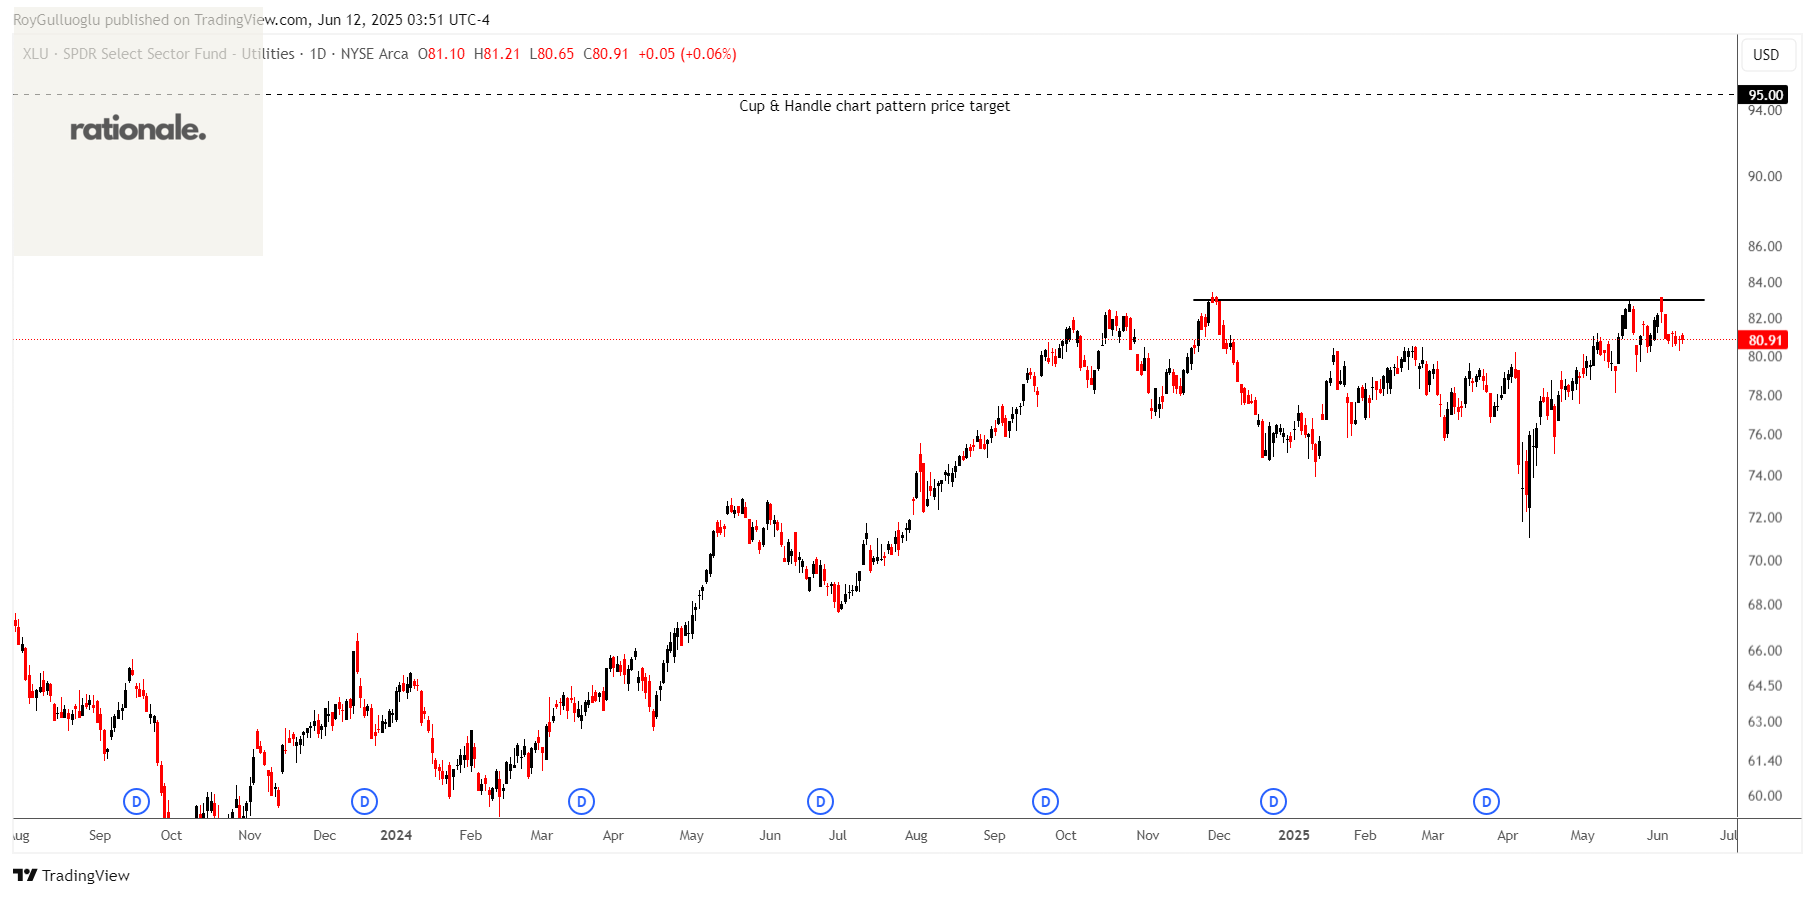
The Utilities Index primarily provides companies that produce, generate, transmit or distribute electricity or natural gas. The component companies include NextEra Energy, Duke, Southern, Sempra and Dominion.
The above daily chart formed an approximately 4-month-long Cup & Handle chart pattern as a bullish continuation after an uptrend.
The horizontal boundary at 83 levels acts as a resistance within this pattern.
A daily close above 85.5 levels would validate the breakout from the 4-month-long Cup & Handle chart pattern.
Based on this chart pattern, the potential price target is approximately 95 levels.
YM1!(E-mini Dow Jones Futures)-Long Idea
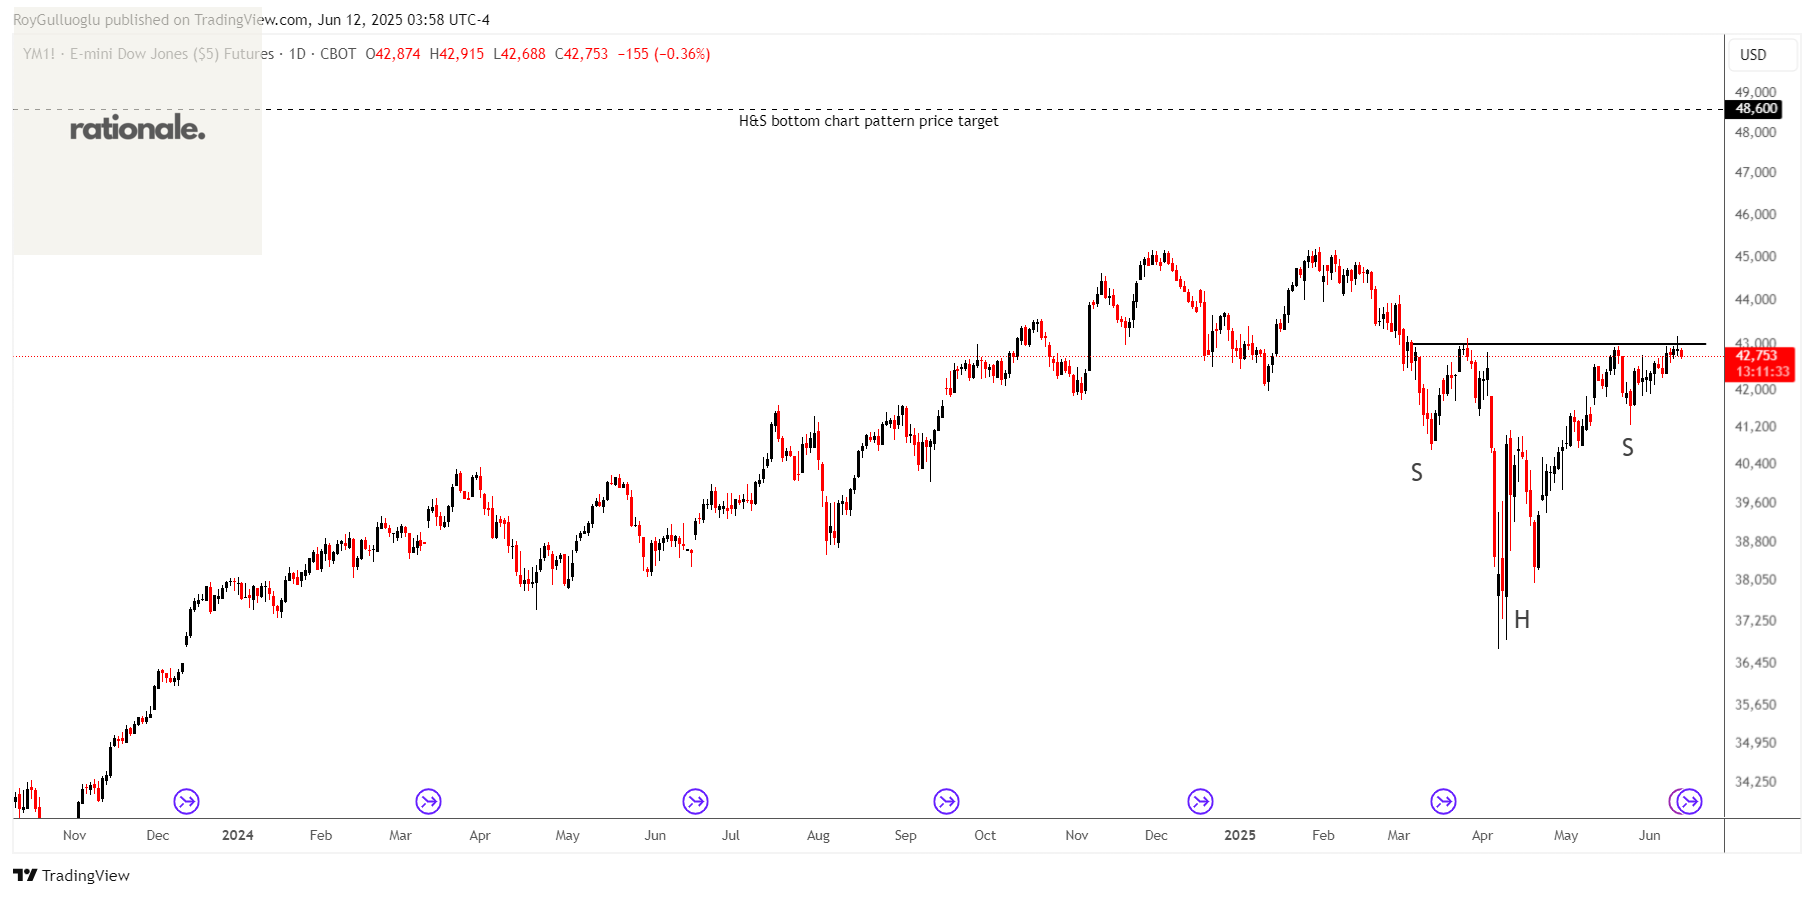
The above daily chart formed an approximately 2-month-long H&S bottom chart pattern as a bullish reversal after a downtrend.
The horizontal boundary at 43000 levels acts as a support within this pattern.
A daily close above 43430 (%1 or %1.5 high of the support for FX, Futures) levels would validate the breakout from the 2-month-long H&S bottom chart pattern.
Based on this chart pattern, the potential price target is approximately 48600 levels.
Teşekkürler Roy