

New setups
TICKERS: EURCAD, WIN1!(BMFBOVESPA), S501!(TFEX), STIP(ARCA), URA(ARCA), SFPUSDT
EURCAD-Long Idea
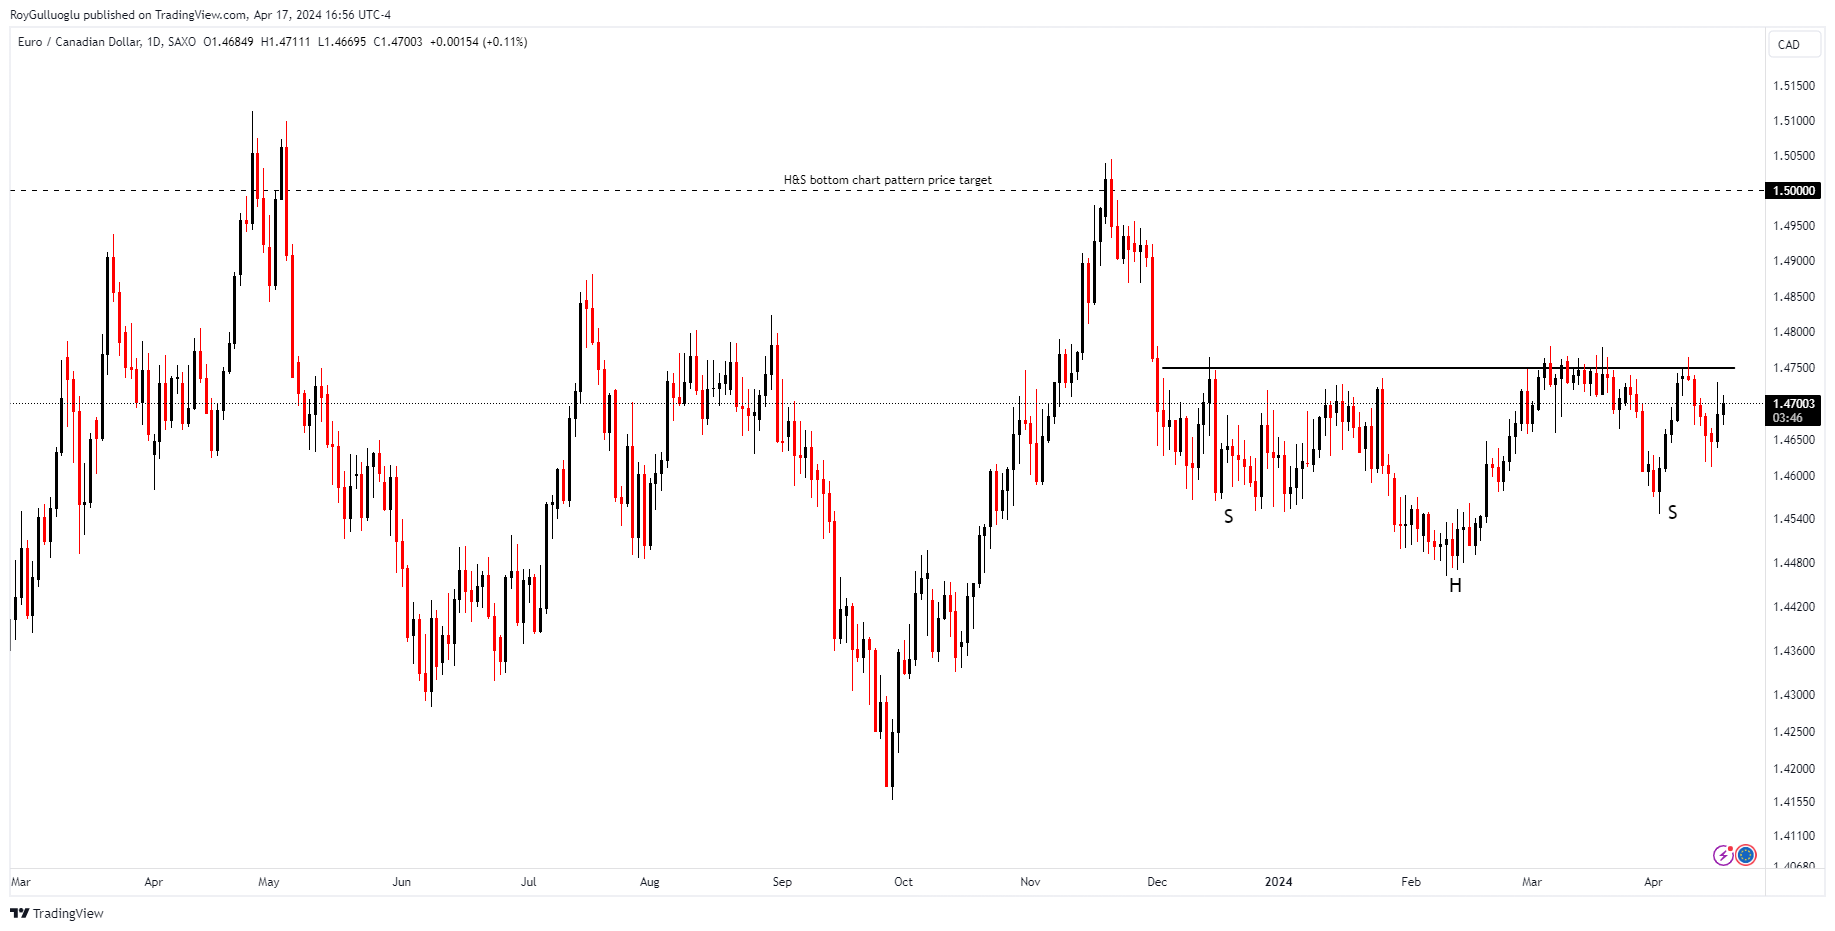
The above daily chart formed an approximately 3-month-long H&S bottom chart pattern as a bullish reversal after a downtrend.
Within this pattern, the horizontal boundary at 1.475 levels acts as strong resistance.
A daily close above 1.48 levels would validate the breakout from the 3-month-long H&S bottom chart pattern.
Based on this chart pattern, the potential price target is 1.5 levels.
What could be the drivers of a bullish scenario?
Bank of Canada > The bank is looking for sustained signs that inflation is cooling before starting to lower its key policy rate from a near 23-year high of 5%.
ECB> Same goes there, since the fight against inflation is less problematic and the real economy side is more concerning, the ECB will do the first rate cut, unlike the FED.
So both the ECB and BoC are close to cutting rates which is why, it would not be easy to rationalize the above long idea on EURCAD. Rather than rate differentiation, I believe that oil would be the key to this trade idea.
Considering the oil exporter role of Canada, as with further increase in oil prices we would expect to see an increase in the demand on Loonie.
It appears that tensions in the Middle East are easing temporarily. Crude oil prices have dropped, with Brent futures trading below $90 a barrel. However, the US is set to enforce fresh sanctions on Iran.
Despite the potential implications of upcoming sanctions, seeing a convergence towards 50-MA and 200-MA in oil makes sense as a risk-off pricing. This potential move might trigger a breakout in the EURCAD currency pair.
WIN1!(Bovespa Index Mini Futures)-Short Idea
WIN1 is a ticker symbol used for Bovespa Index Mini Futures contracts traded on the Brazilian financial exchange, BM&FBOVESPA (B3). These futures contracts are derivatives based on the Bovespa Index (Ibovespa), which is the main stock market index of the São Paulo Stock Exchange (B3).
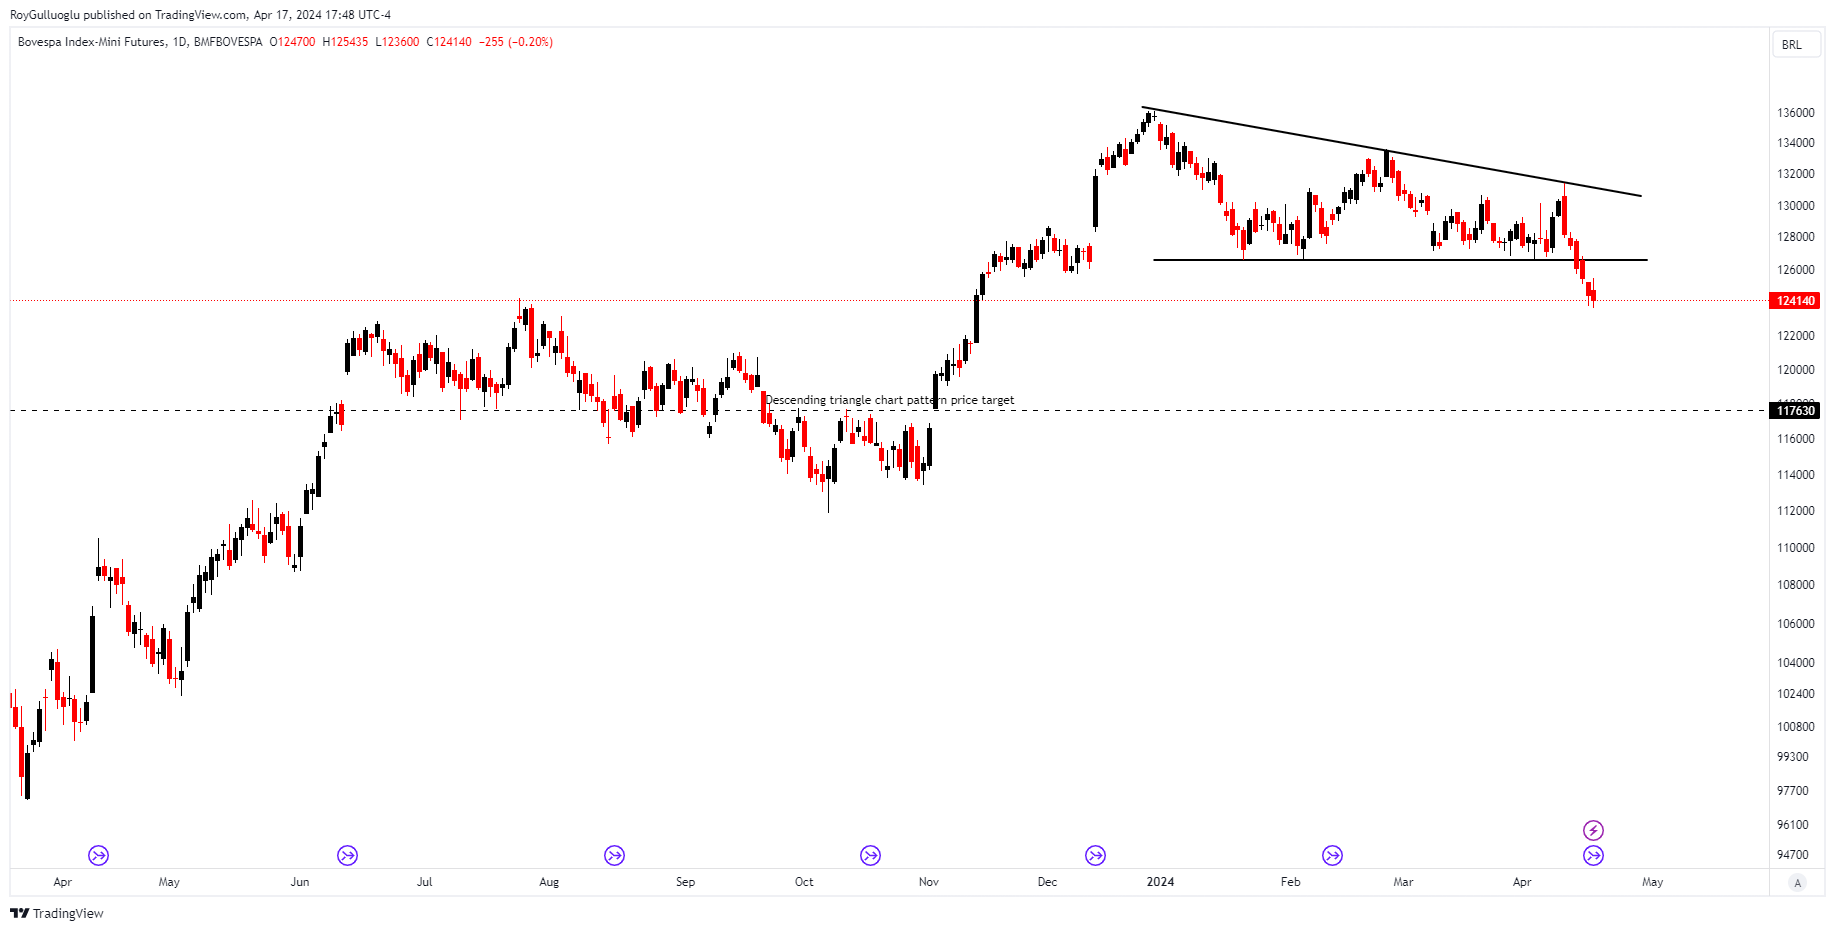
The above daily chart formed an approximately 3-month-long descending triangle chart pattern as a bearish reversal after an uptrend.
Within this pattern, the horizontal boundary at 126580 levels acted as strong support.
A daily close above 125580 levels validated the breakout from the 3-month-long descending triangle chart pattern.
Based on this chart pattern, the potential price target is 117630 levels.
After Powell's statements, the first rate cut expectation in the market is priced towards November 2024. As the higher-for-longer narrative becomes dominant, we see the biggest impact on emerging markets and developing countries’ currencies like Brazil.
Fiscal problems like high public expenditure in Brazil are more major concerns but the current FED stance seems more influential on both the Real and Bovespa weakening.
A potential pullback to the support level might be evaluated as an opportunity.
S501!(Set 50 Index Futures)-Long Idea
The SET50 index consists of the top 50 companies listed on the Stock Exchange of Thailand (SET) by market capitalization and liquidity.
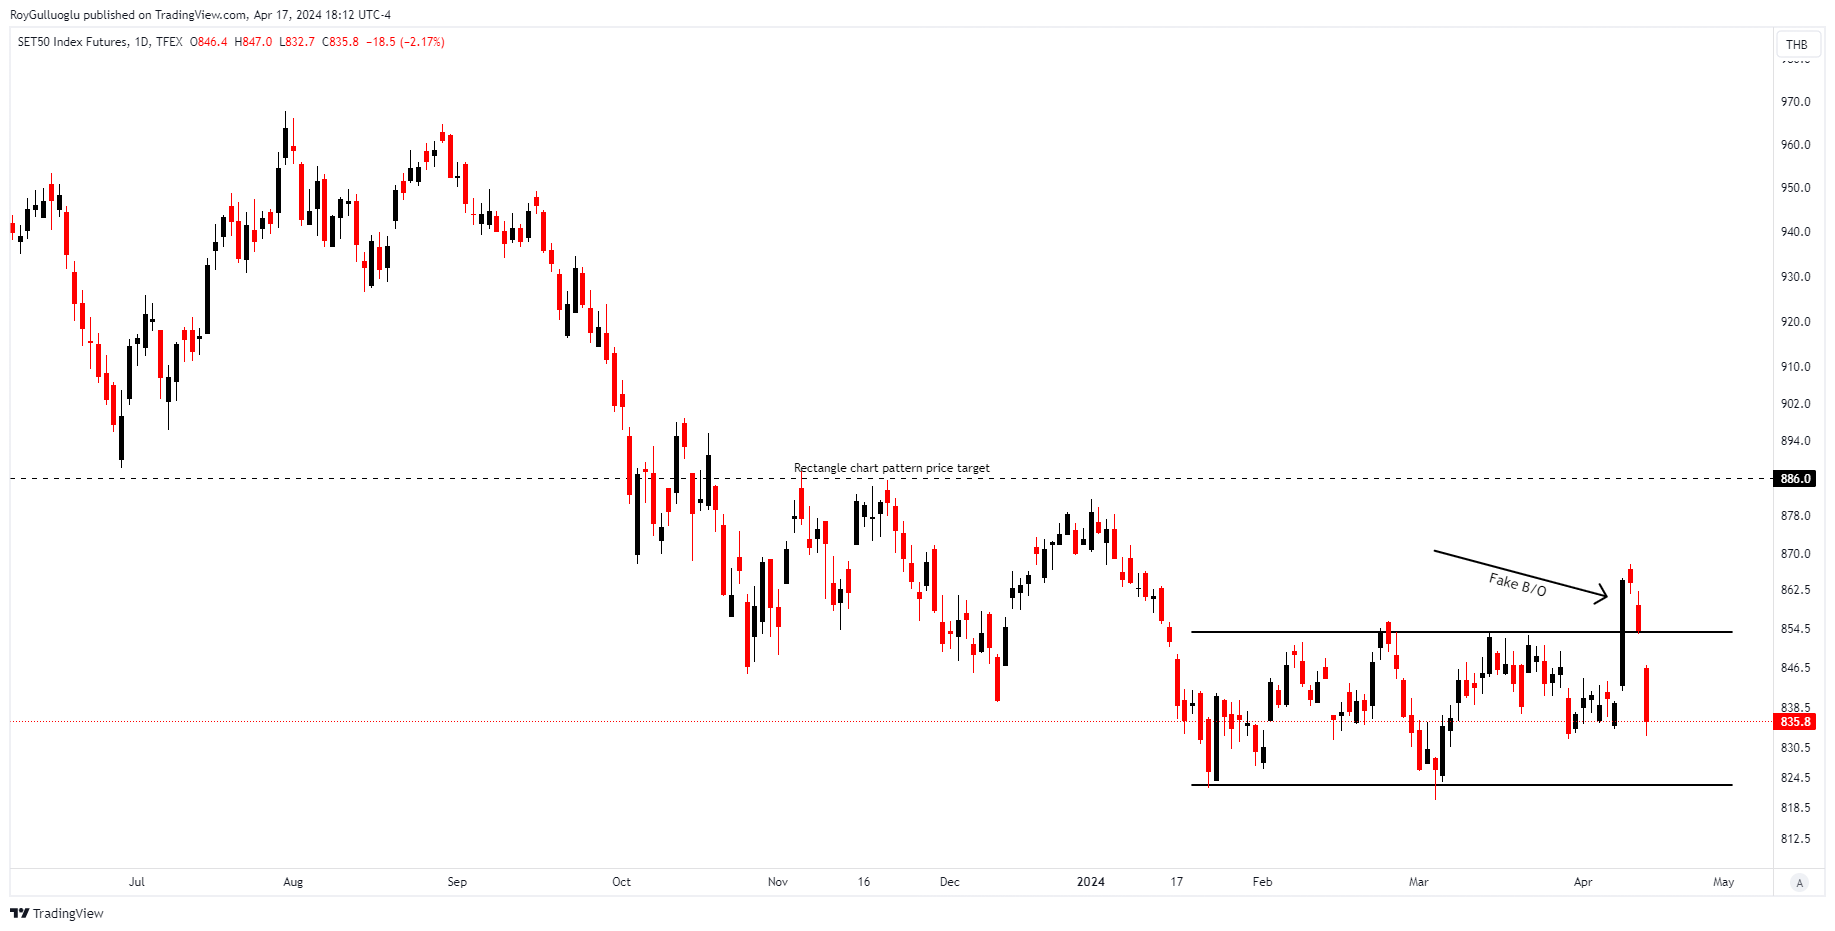
The above daily chart formed an approximately 2-month-long rectangle chart pattern as a bullish reversal after a downtrend.
Within this pattern, the horizontal boundary at 854 levels acts as a resistance.
A daily close above 860 levels would validate the breakout from the 2-month-long rectangle chart pattern
Based on this chart pattern, the potential price target is 886 levels.
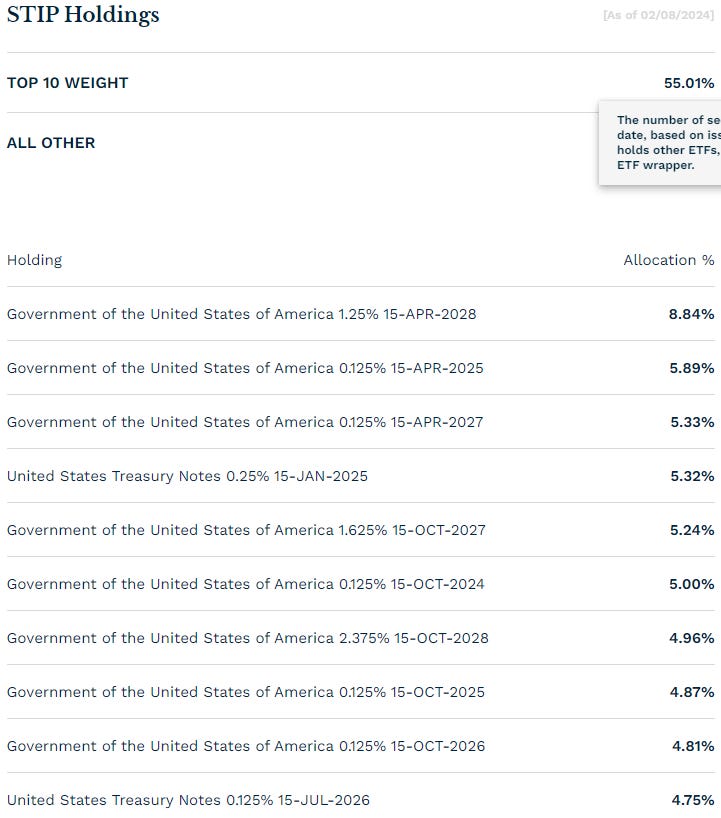
iShares 0-5 Year TIPS Bond ETF-(STIP/ARCA)-Long Idea
STIP follows a market-weighted index of US Treasury Inflation-Protected Securities (TIPS) with a maturity of less than 5 years. It provides coverage of the short-term TIPS market in the US, offering typical duration and yield for a short-term TIPS fund. Overall, STIP is a suitable choice for investors looking for broad exposure to the short-term TIPS market.
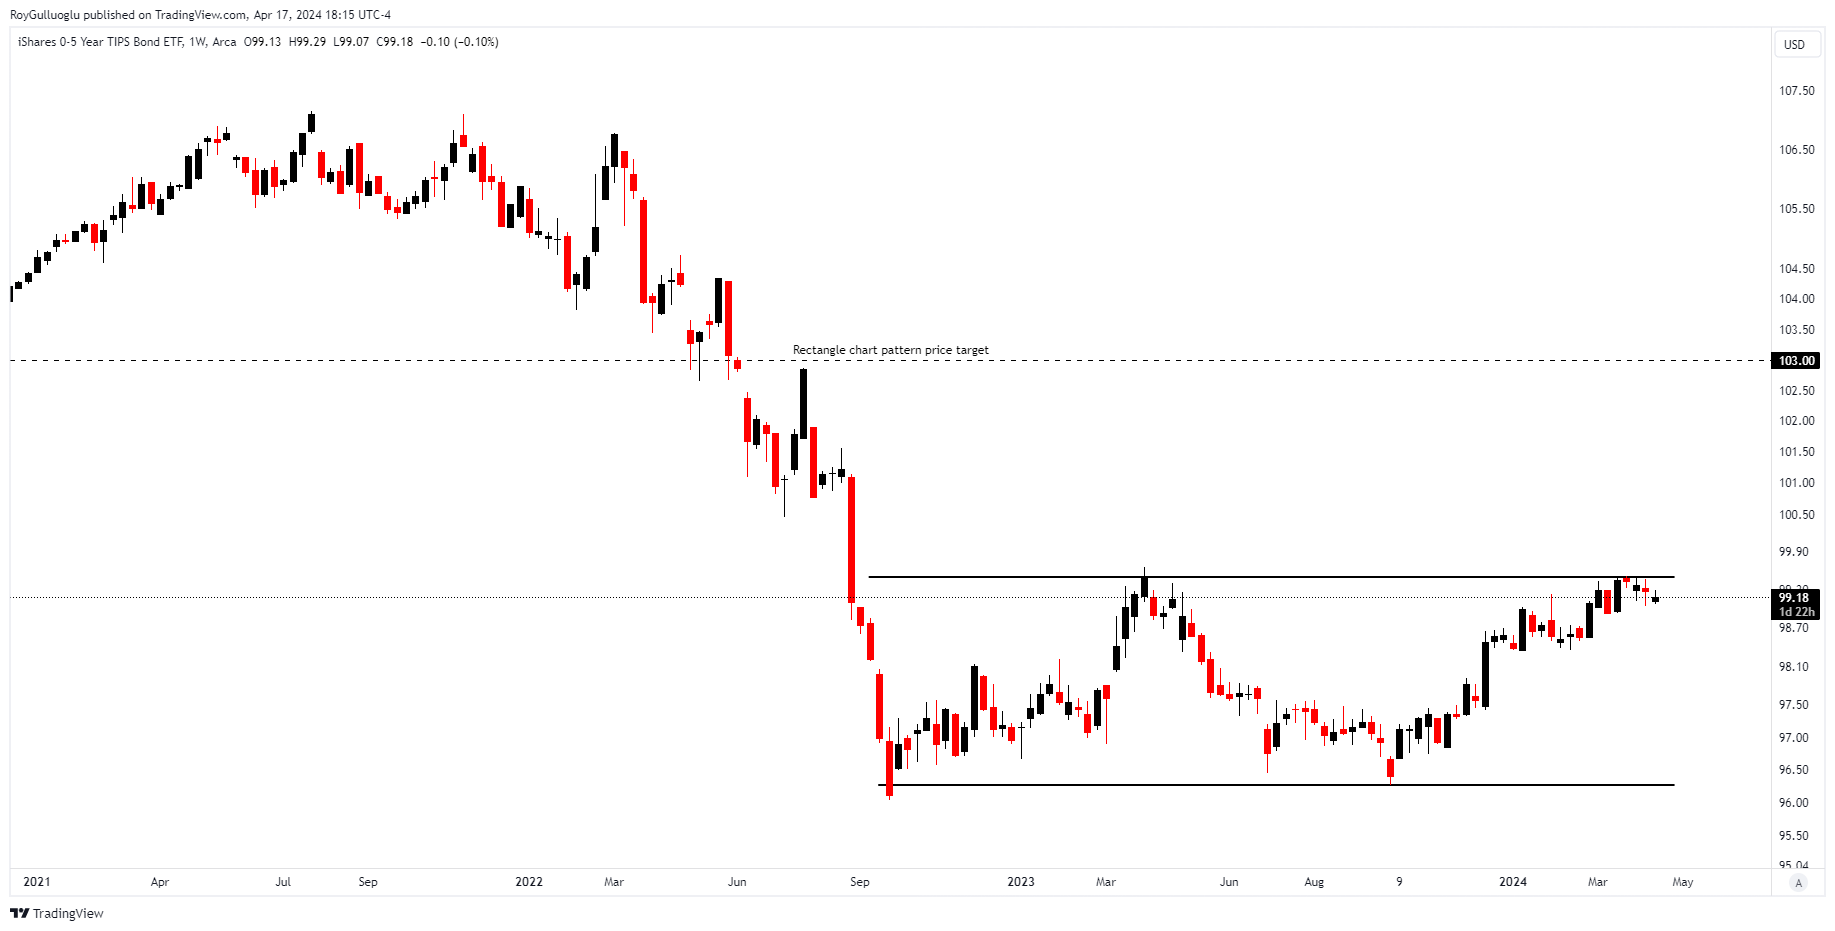
The above daily chart formed an approximately 3-month-long rectangle chart pattern as a bullish reversal after a downtrend.
Within this pattern, the horizontal boundary at 99.5 levels acts as a resistance.
A daily close above 99.75 levels would validate the breakout from the 23-month-long rectangle chart pattern.
Based on this chart pattern, the potential price target is 103 levels.
Top 10 holdings

Global X Uranium ETF-(URA/ARCA)-Long Idea
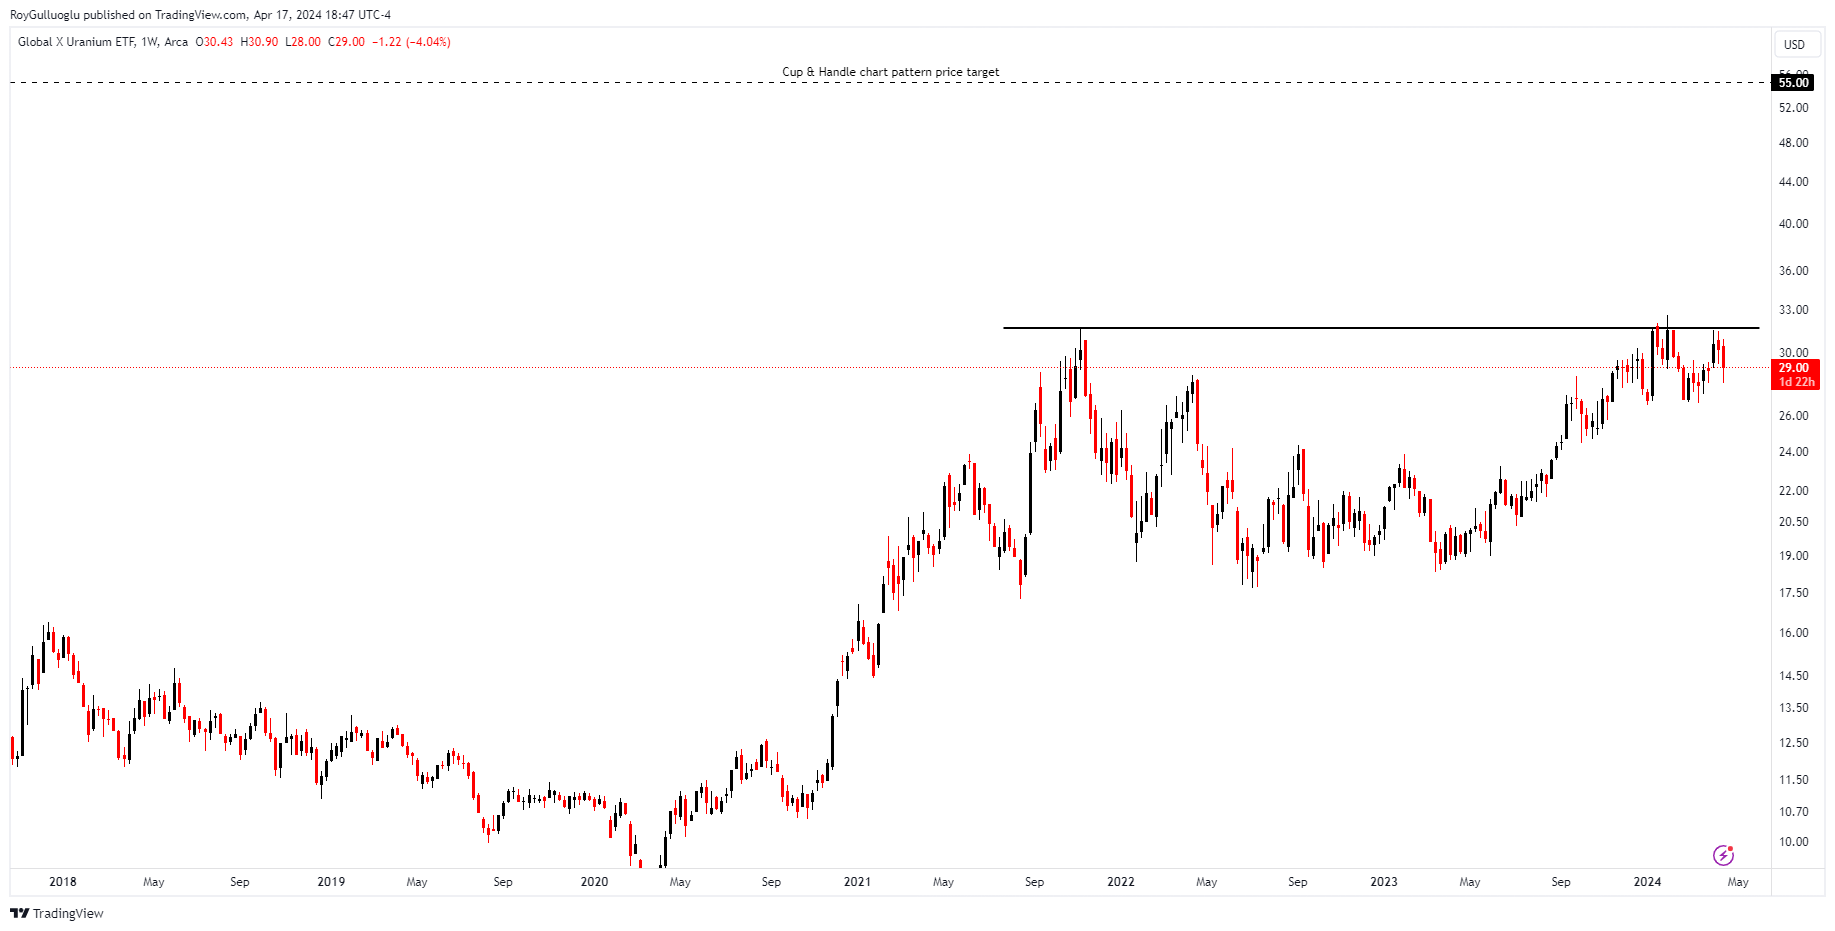
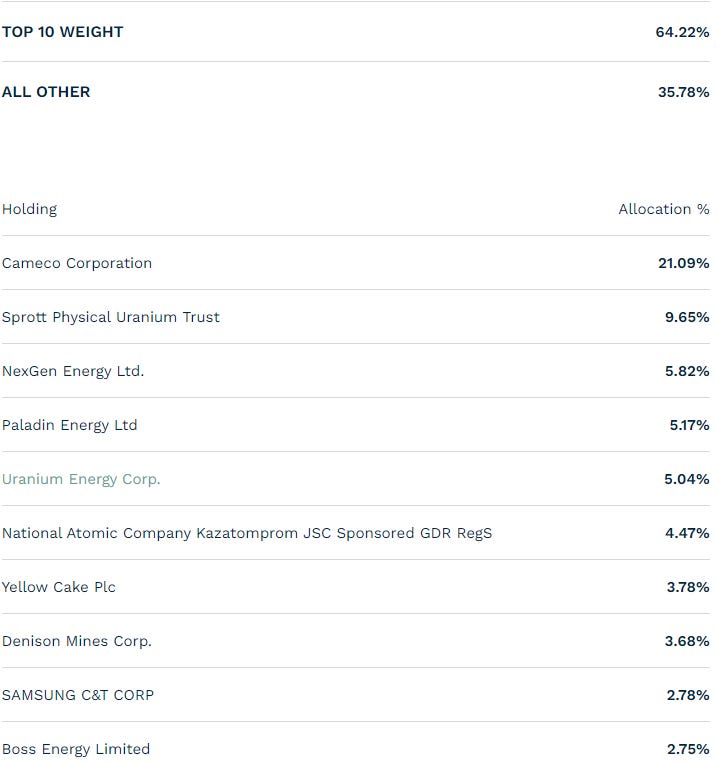
URA provides access to a diverse selection of firms engaged in worldwide uranium mining and the manufacturing of nuclear components.
The above weekly chart formed an approximately 30-month-long Cup & Handle chart pattern as a bullish continuation after an uptrend.
Within this pattern, the horizontal boundary at 31.7 levels acts as a resistance.
A daily close above 32.65 levels would validate the breakout from the 30-month-long Cup & Handle chart pattern.
Based on this chart pattern, the potential price target is 55 levels.
Top 10 holdings
SFPUSDT - Long/Short Idea
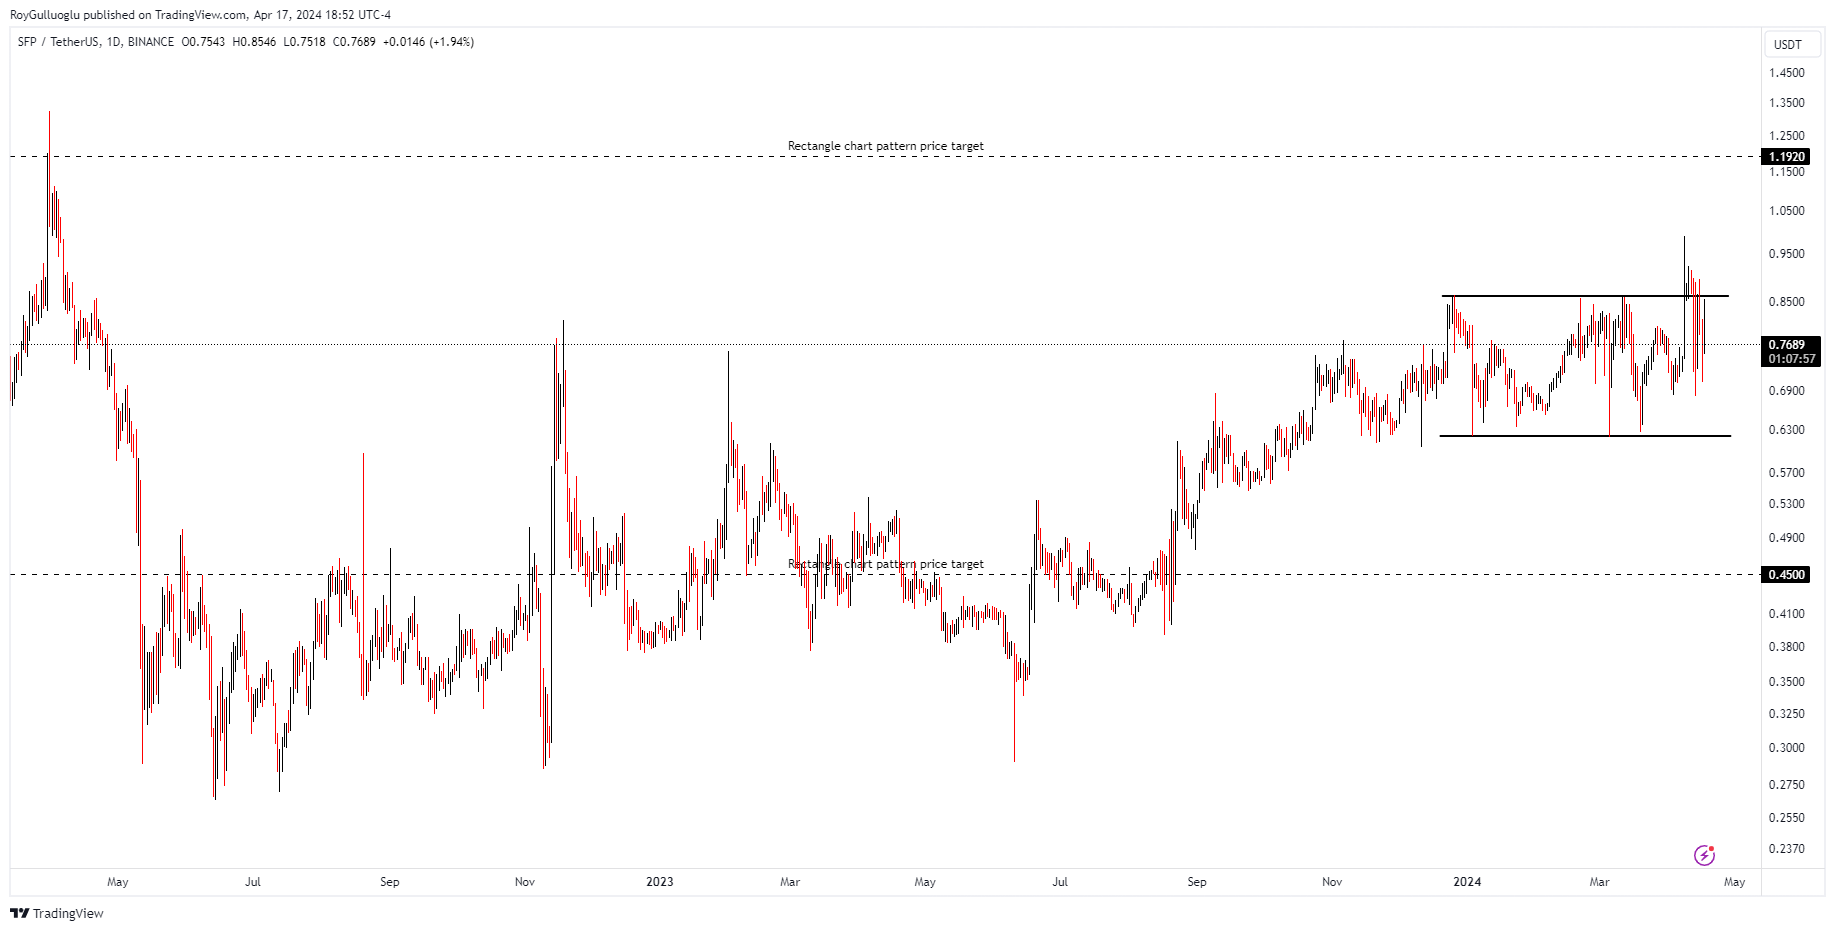
The above daily chart formed an approximately 4-month-long rectangle chart pattern.
Within this pattern, the horizontal boundary at 0.86 levels acts as a resistance, and at 0.62 levels acts as a support.
A daily close above 0.8858 levels would validate the breakout from the 4-month-long rectangle chart pattern. Also, a daily close below 0.6014 would validate the breakdown from the rectangle top reversal chart pattern.
Based on these chart patterns, the potential price target is at 1.192 and 0.45 levels respectively.