

Trade Ideas Fx-Futures-Etf-Crypto
PKB(ARCA), IBB(NASDAQ), USDCHF, USDSEK

PKB(Invesco Building & Construction ETF)-Long Idea
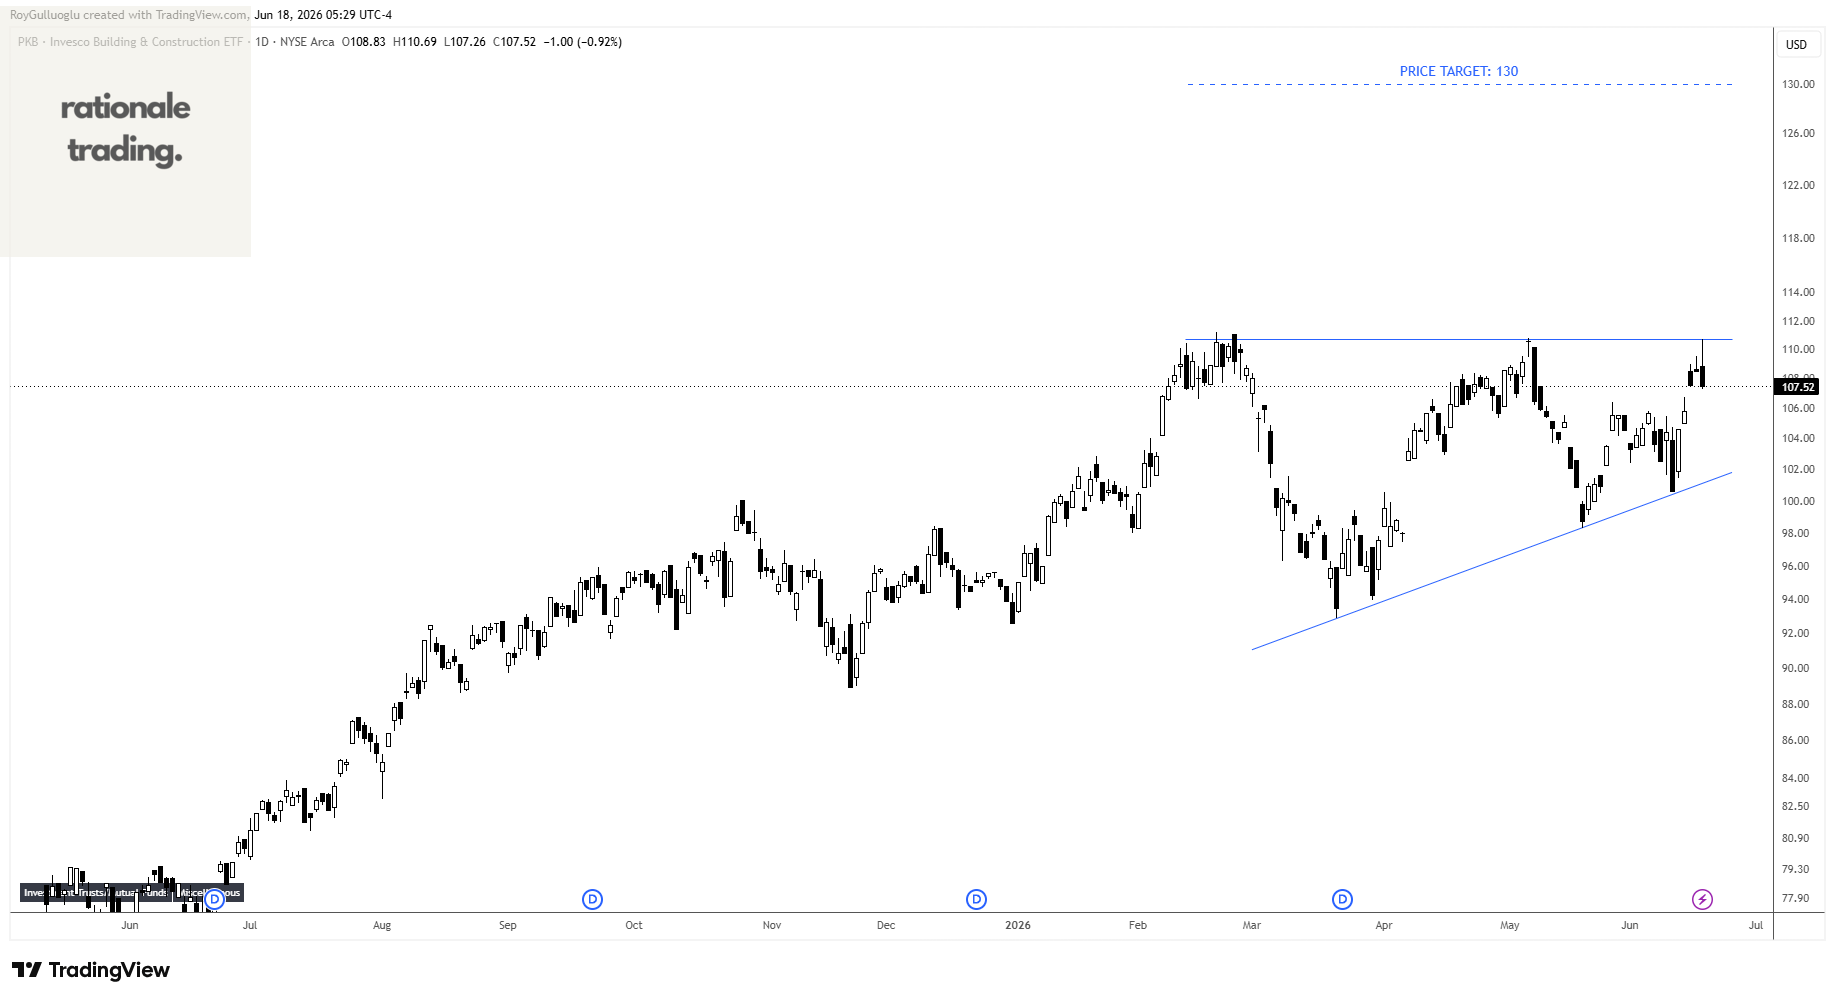
The underlying index was composed of common stocks of U.S. building and construction companies.
The above daily chart formed an approximately 3-month-long ascending triangle chart pattern as a bullish continuation after an uptrend.
The horizontal boundary at 110.69 levels acts as a resistance within this pattern.
A daily close above 112 levels would validate the breakout from the 3-month-long ascending triangle chart pattern.
Based on this chart pattern, the potential price target is approximately 130 levels.
IBB(iShares Biotechnology ETF)-Long Idea
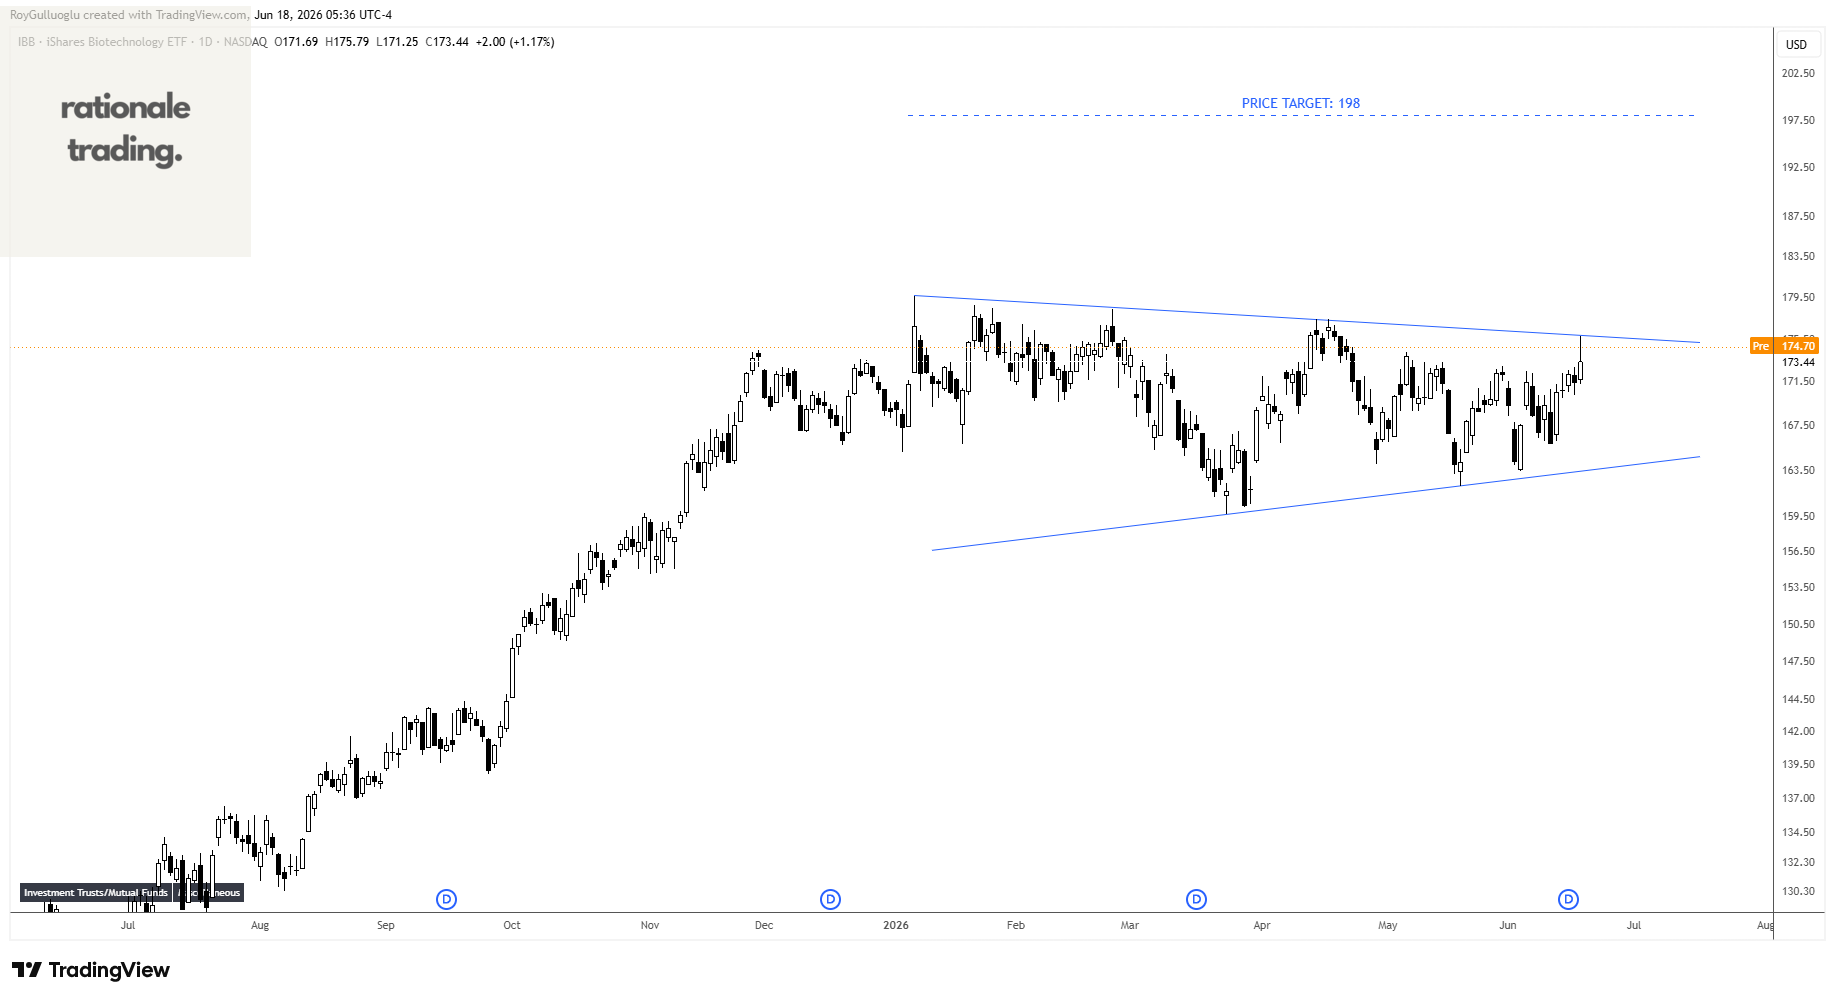
The iShares Biotechnology ETF seeks to track the investment results of an index composed of U.S.-listed equities in the biotechnology sector.
The above daily chart formed an approximately 3-month-long symmetrical triangle chart pattern as a bullish continuation after an uptrend.
A daily close above 177.6 levels would validate the breakout from the 3-month-long symmetrical triangle chart pattern.
Based on this chart pattern, the potential price target is approximately 198 levels.
USDCHF-Long Idea
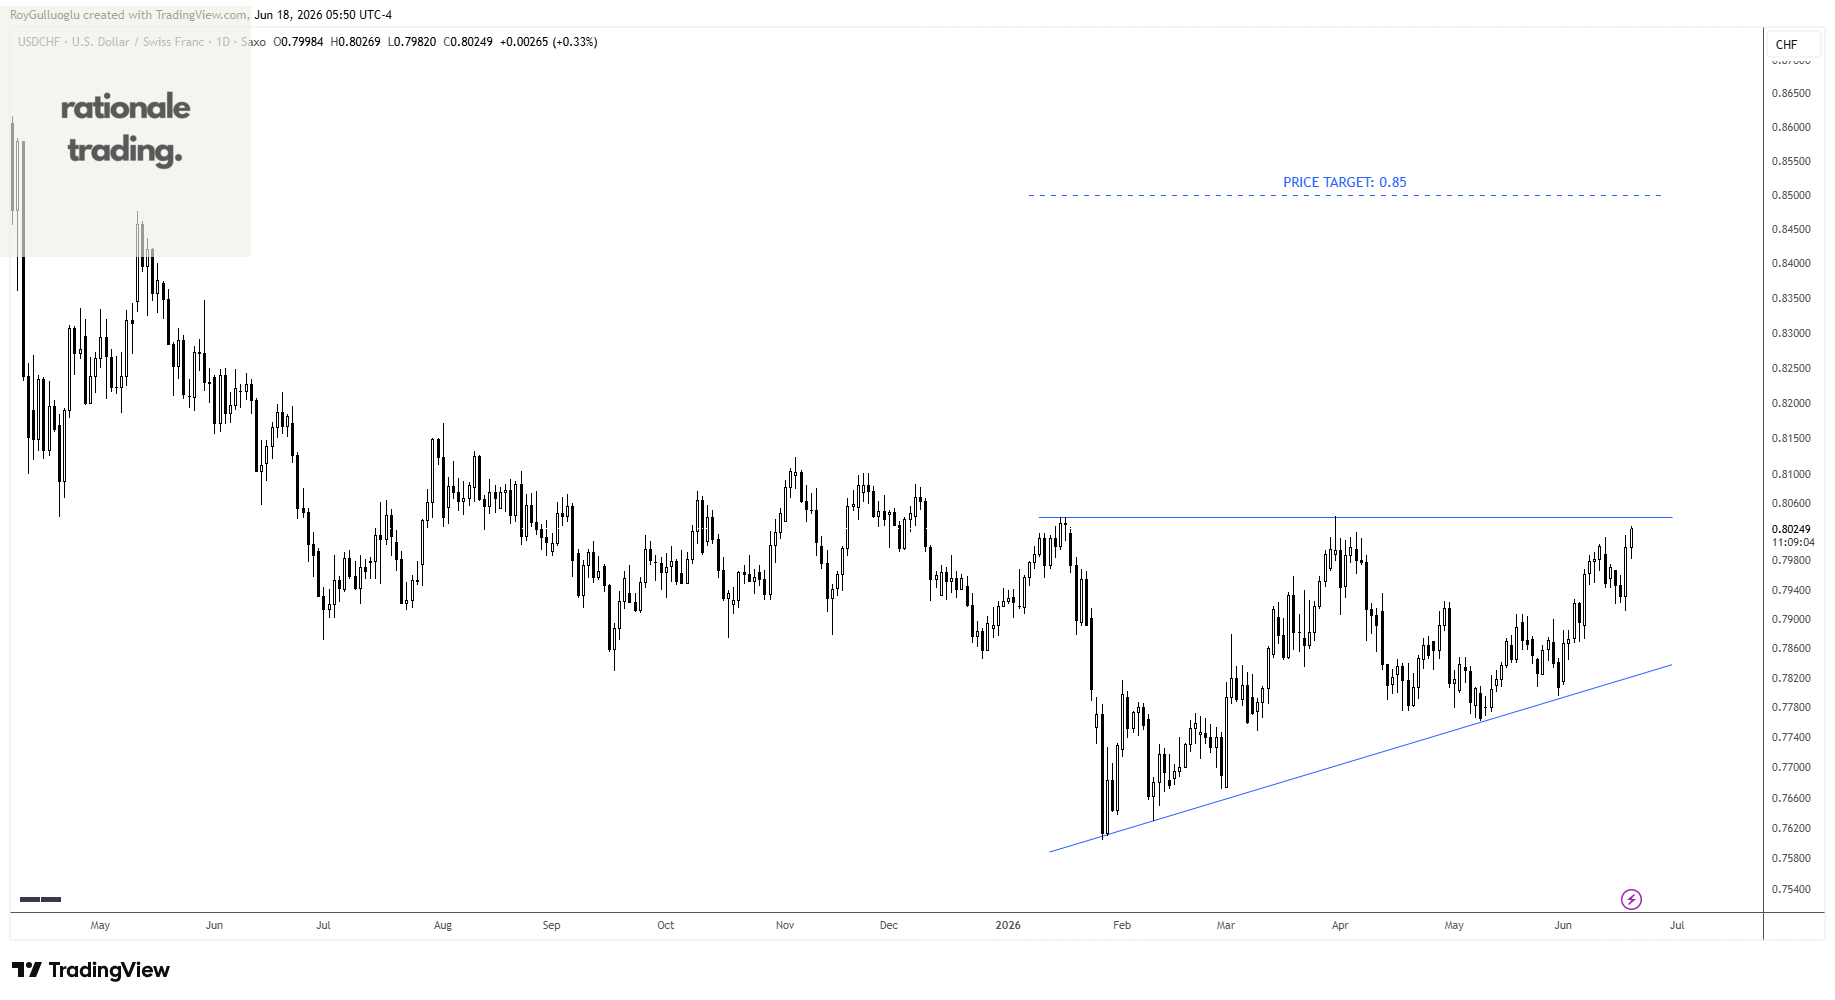
The above daily chart formed an approximately 4-month-long ascending triangle chart pattern as a bullish reversal after a downtrend.
The horizontal boundary at 0.804 levels acts as a resistance within this pattern.
A daily close above 0.8065 levels would validate the breakout from the 4-month-long ascending triangle chart pattern .
Based on this chart pattern, the potential price target is approximately 0.85 levels.
For those looking to express a USD strength view, CHF offers a technically well-defined setup.
USDSEK-Long Idea
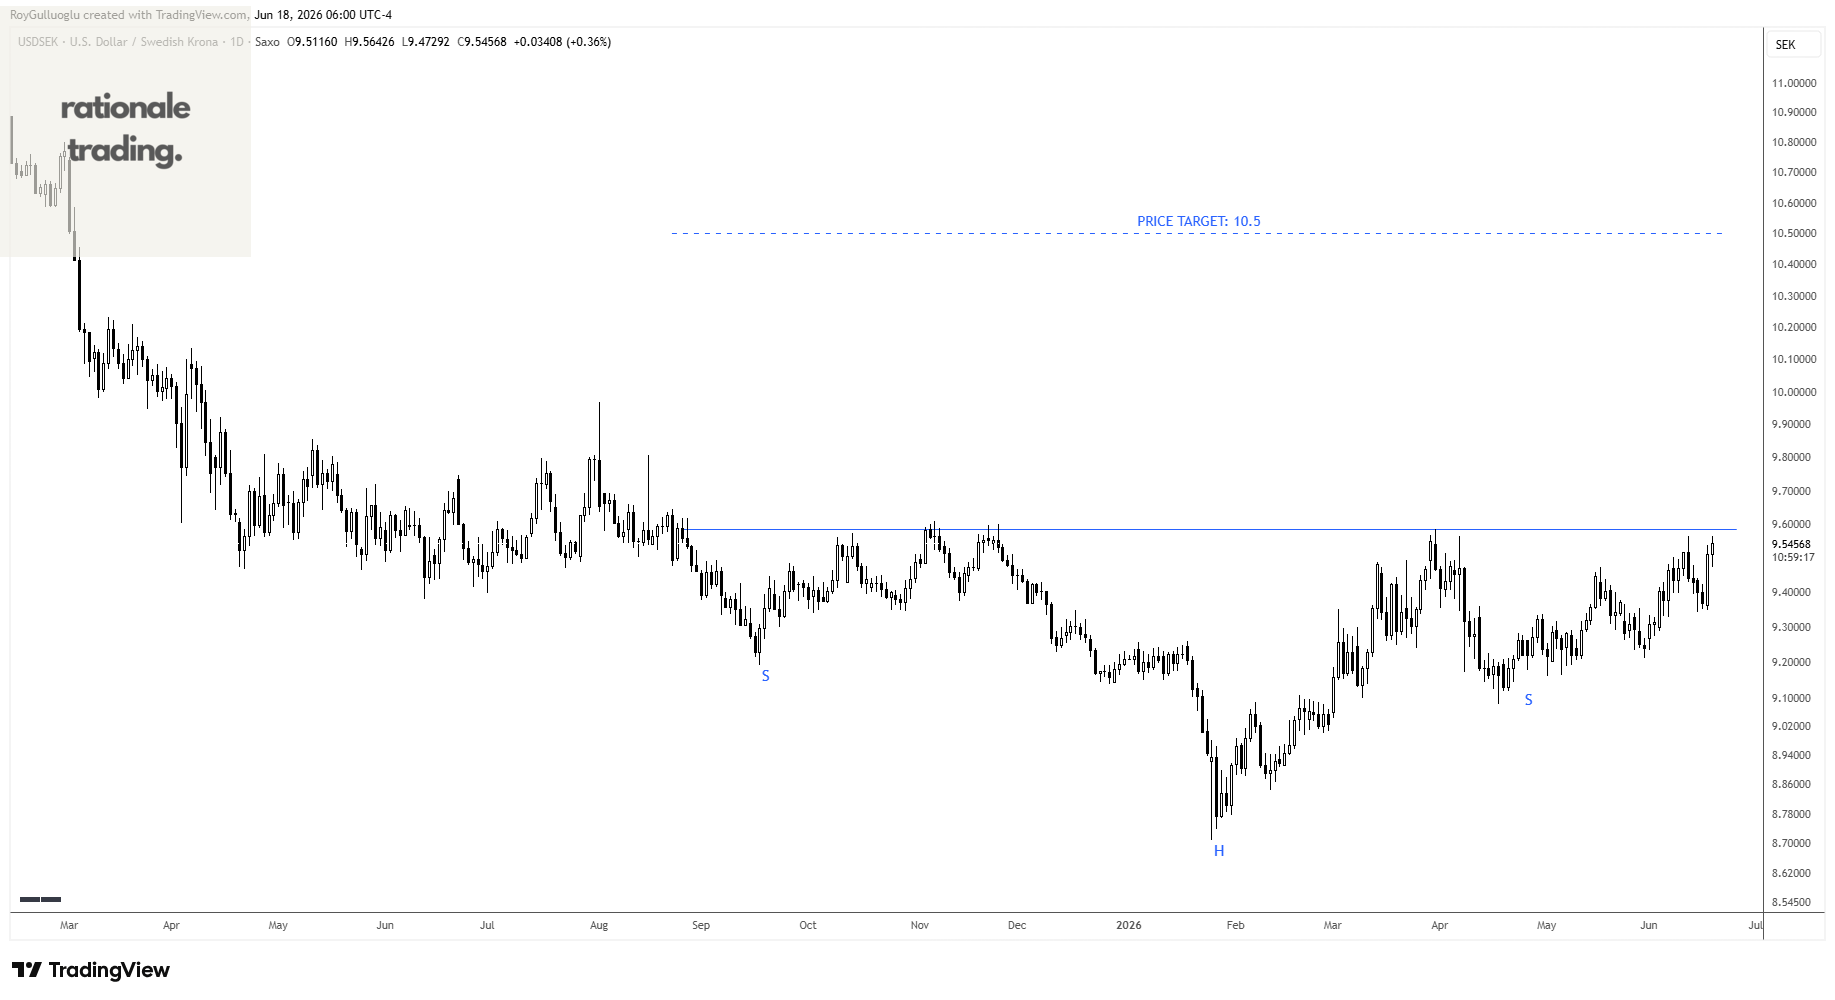
The above daily chart formed an approximately 7-month-long H&S bottom chart pattern as a bullish reversal after a downtrend.
The horizontal boundary at 9.5868 levels acts as a resistance within this pattern.
A daily close above 9.63 levels would validate the breakout from the 7-month-long H&S bottom chart pattern.
Based on this chart pattern, the potential price target is approximately 10.5 levels.
Teşekkürler Roy