

Trade Ideas Fx-Futures-Etf-Crypto
TN1!(CBOT), PA1!(NYMEX), FESX1!(EUREX), FCE1!(EURONEXT), AVAXUSDT, CRVUSDT

TN1!(US Treasury Note Futures)-Long Idea
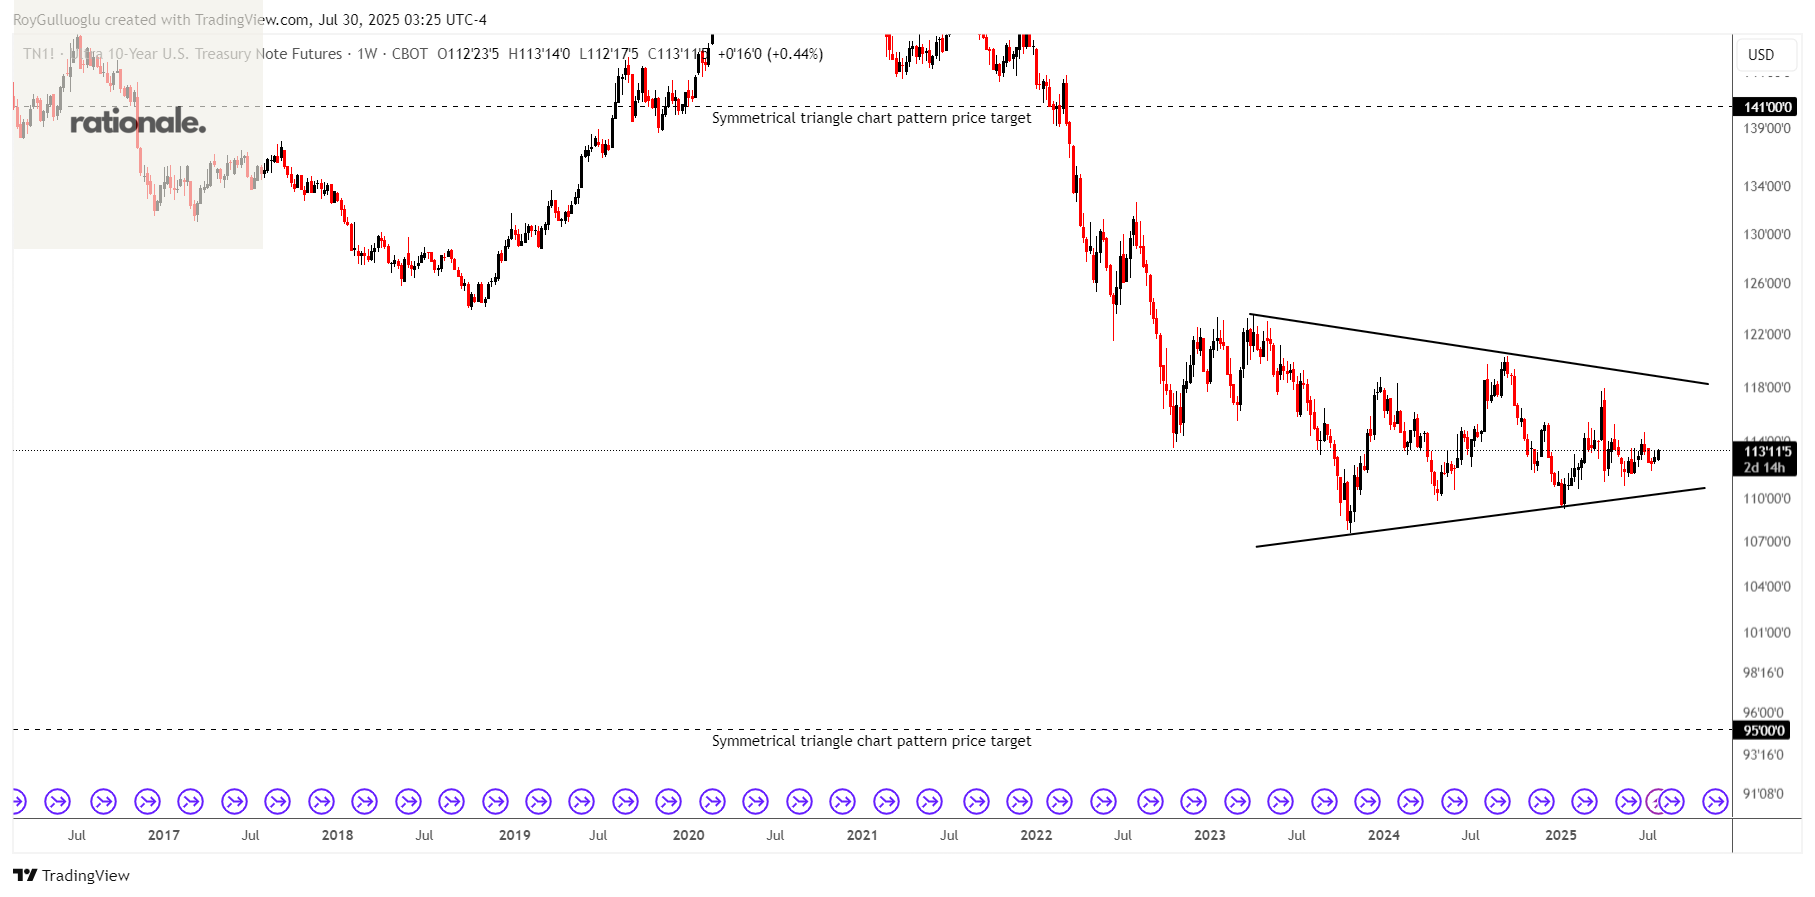
10-Year U.S. Treasury Note Futures are standardized contracts traded on exchanges like the Chicago Board of Trade (CBOT) that allow market participants to buy or sell a U.S. Treasury note with a remaining maturity of approximately 6.5 to 10 years at a specified price for delivery at a future date.
Why it matters?
Interest Rate Hedging: Widely used by banks, fund managers, and traders to hedge against or speculate on interest rate movements.
Liquidity: Among the most liquid interest rate futures globally.
Price/Yield Inverse: As with bonds, futures prices fall when interest rates rise, and vice versa.
The above weekly chart formed an approximately 4-month-long symmetrical triangle chart pattern as a bearish reversal or bullish continuation after an uptrend.
A daily close below 108.4(ATR(14)/2-boundary) levels would validate the breakdown and a daily close above 120.6(ATR(14)/2+boundary) would validate the breakout from the 4-month-long symmetrical triangle chart pattern.
Based on the chart patterns, the potential price targets are 95 and 141 levels respectively.
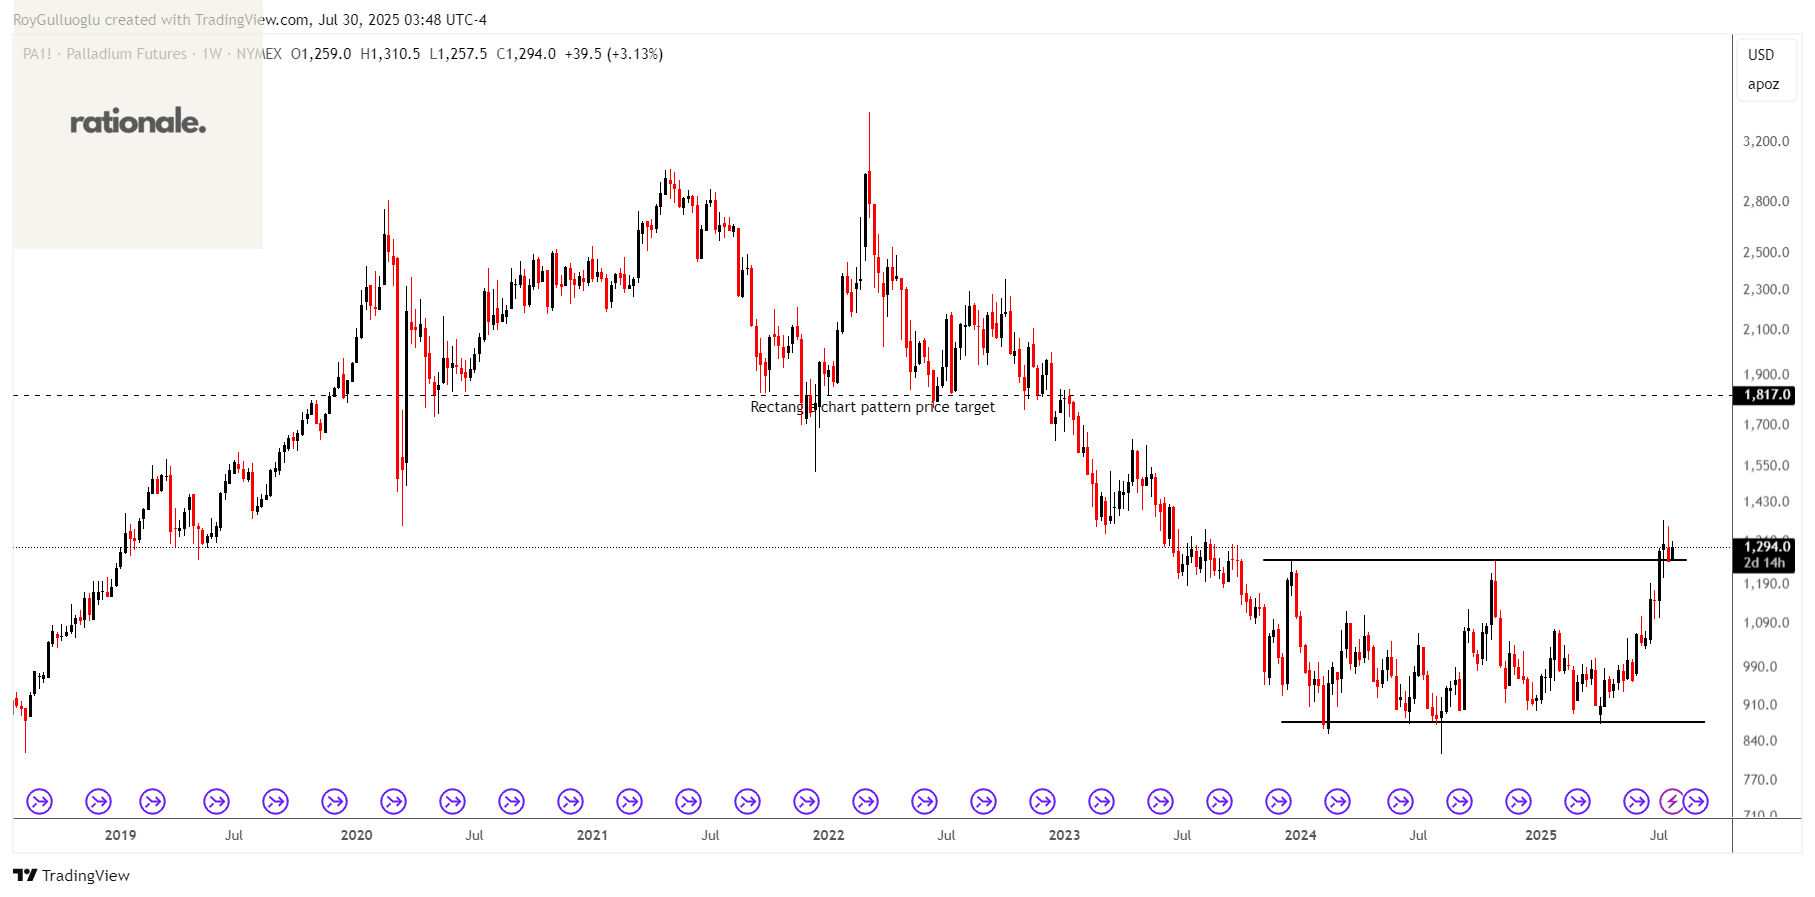
PA1!(Palladium Futures)-Long Idea
Palladium is first and foremost an industrial metal, and its value is driven mostly by demand from manufacturing, especially:
Auto Industry (Primary Driver – ~80% of demand)
Other Industrial Uses(Electronics, Medical, Jewelry)
The above weekly chart formed an approximately 20-month-long rectangle chart pattern as a bullish reversal after a downtrend.
The horizontal boundary at 1255.5 levels acted as a resistance within this pattern.
A daily close above 1293 levels validated the breakout from the 20-month-long rectangle chart pattern.
Based on this chart pattern, the potential price target is approximately 1817 levels.
FESX1!(Euro Stoxx 50 Index Futures)-Long Idea
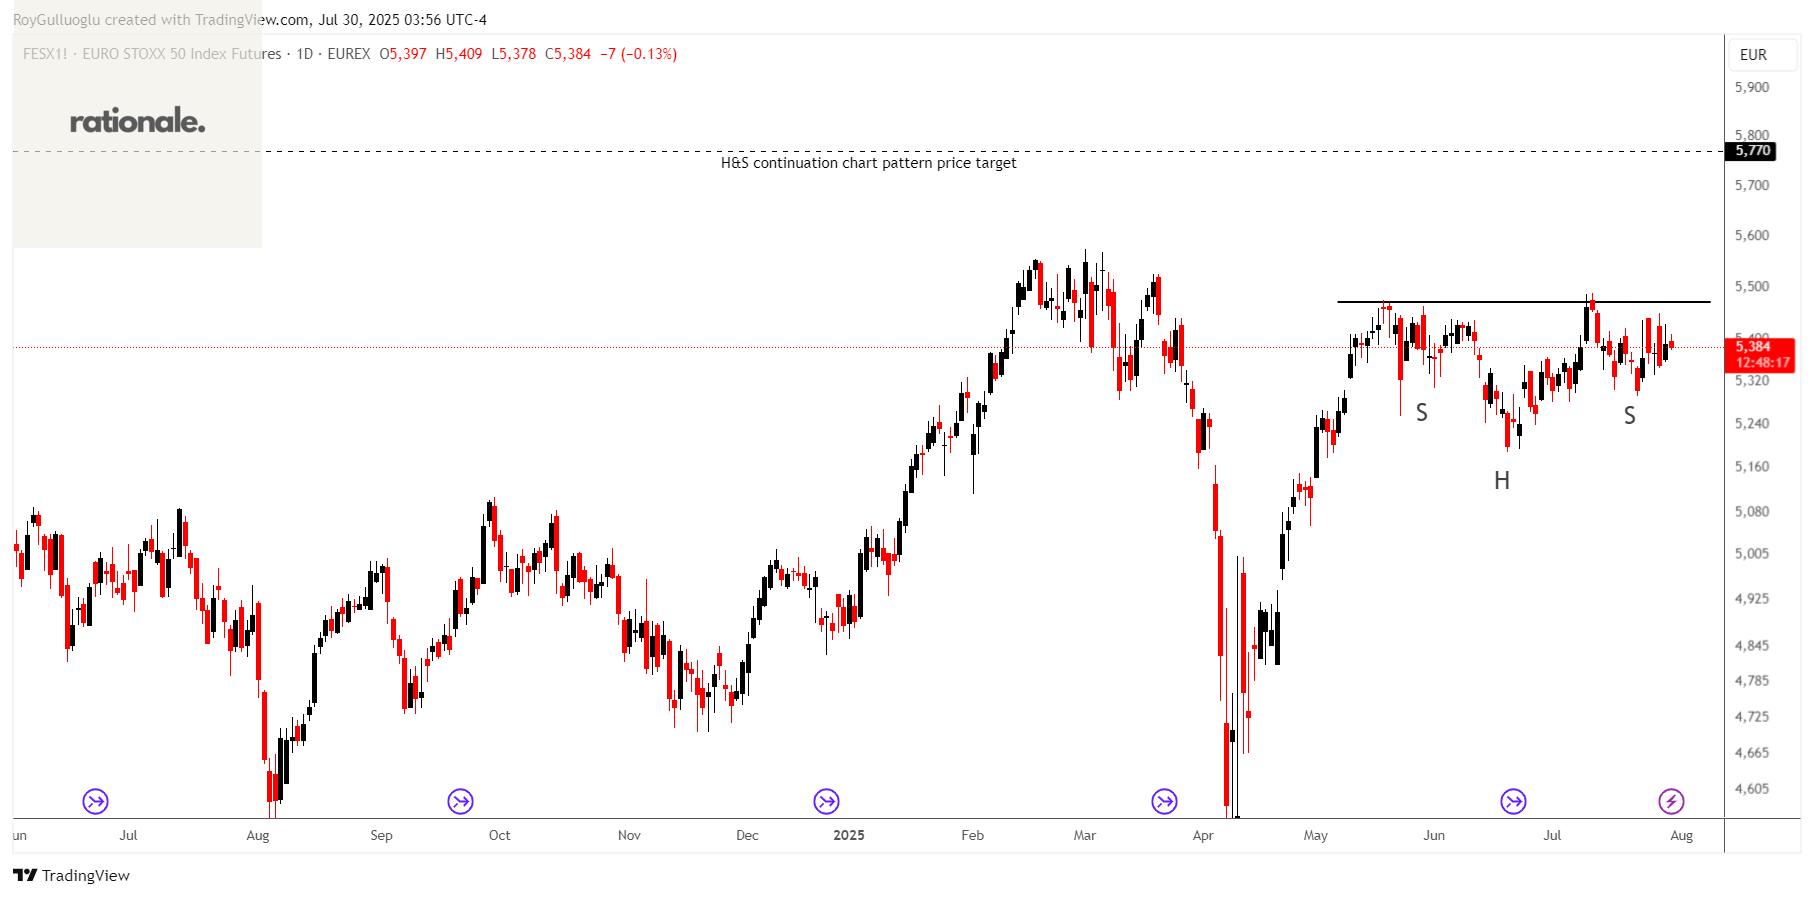
EURO STOXX 50 index, which represents 50 of the largest and most liquid blue-chip stocks from 11 Eurozone countries.
The above daily chart formed an approximately 2-month-long H&S continuation chart pattern as a bullish continuation after an uptrend.
The horizontal boundary at 5470 levels acts as a resistance within this pattern.
A daily close above 5500(ATR(14)/2+boundary) levels would validate the breakout from the 5-month-long rectangle chart pattern.
Based on this chart pattern, the potential price target is approximately 5770 levels.
FCE1!(CAC 40 Index Futures)-Long Idea
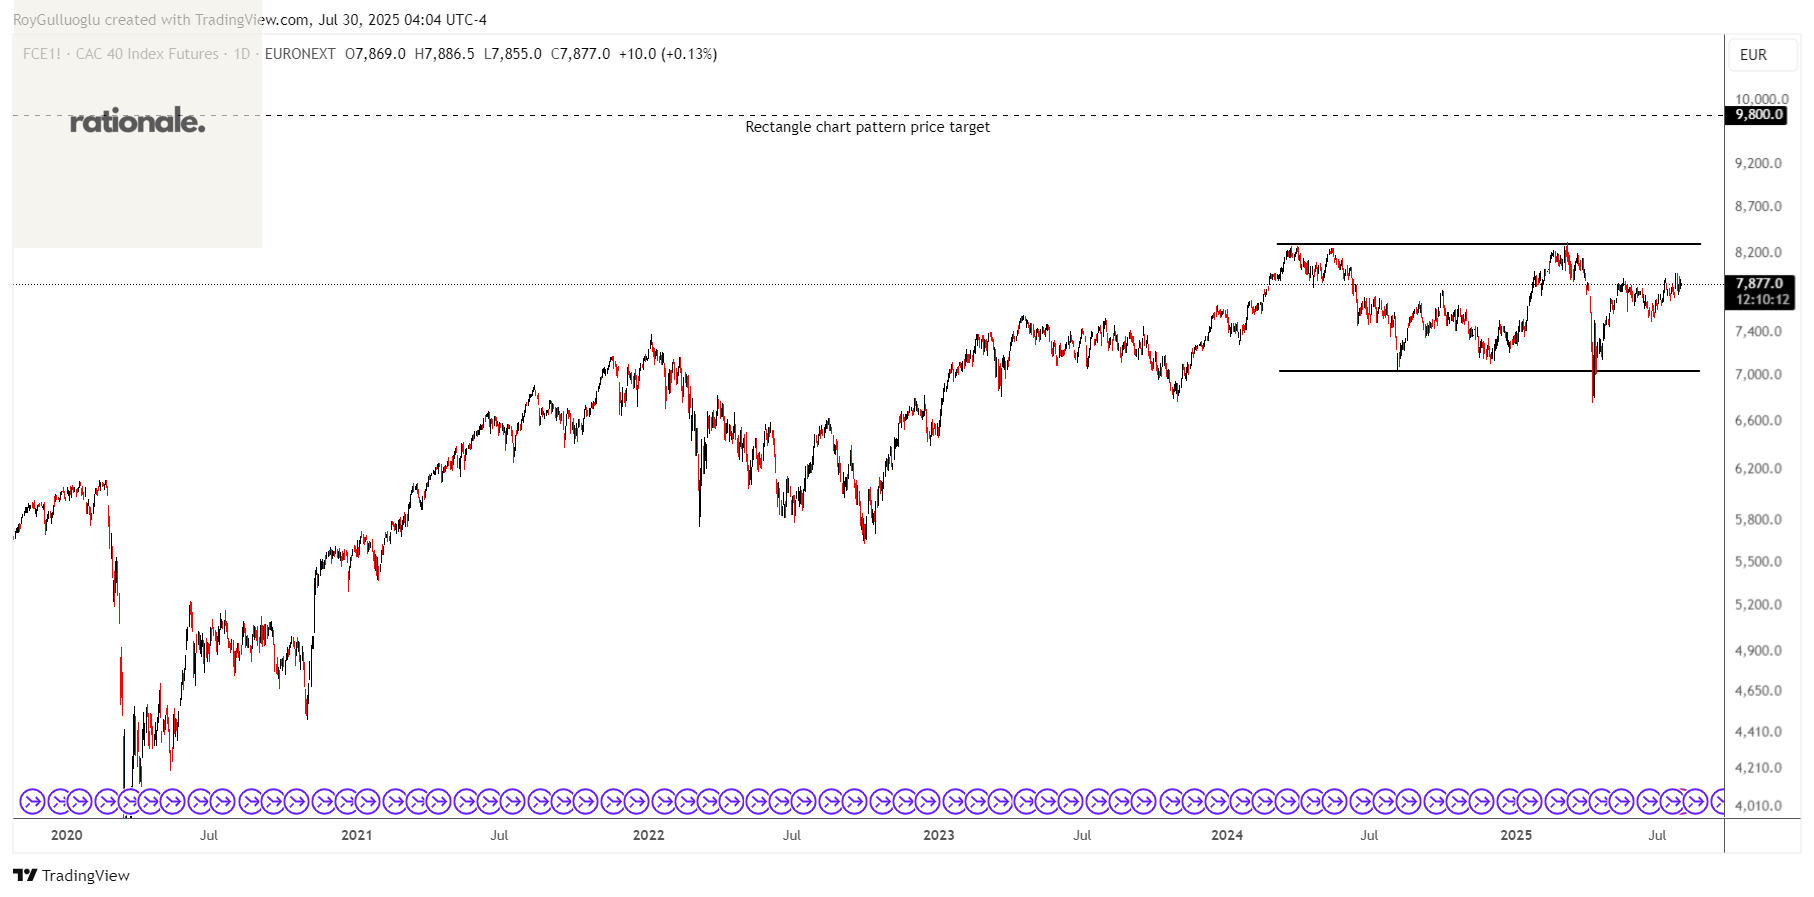
CAC 40 Index Futures are standardized derivative contracts that allow traders and investors to gain exposure to the CAC 40 index, which tracks the performance of the 40 largest French companies listed on Euronext Paris.
The above daily chart formed an approximately 11-month-long rectangle chart pattern as a bullish reversal after a downtrend.
The horizontal boundary at 8300 levels acts as a resistance within this pattern.
A daily close above 8353(ATR(14)/2+boundary) levels would validate the breakout from the 11-month-long rectangle chart pattern.
Based on this chart pattern, the potential price target is approximately 9800 levels.
AVAXUSDT-Long Idea
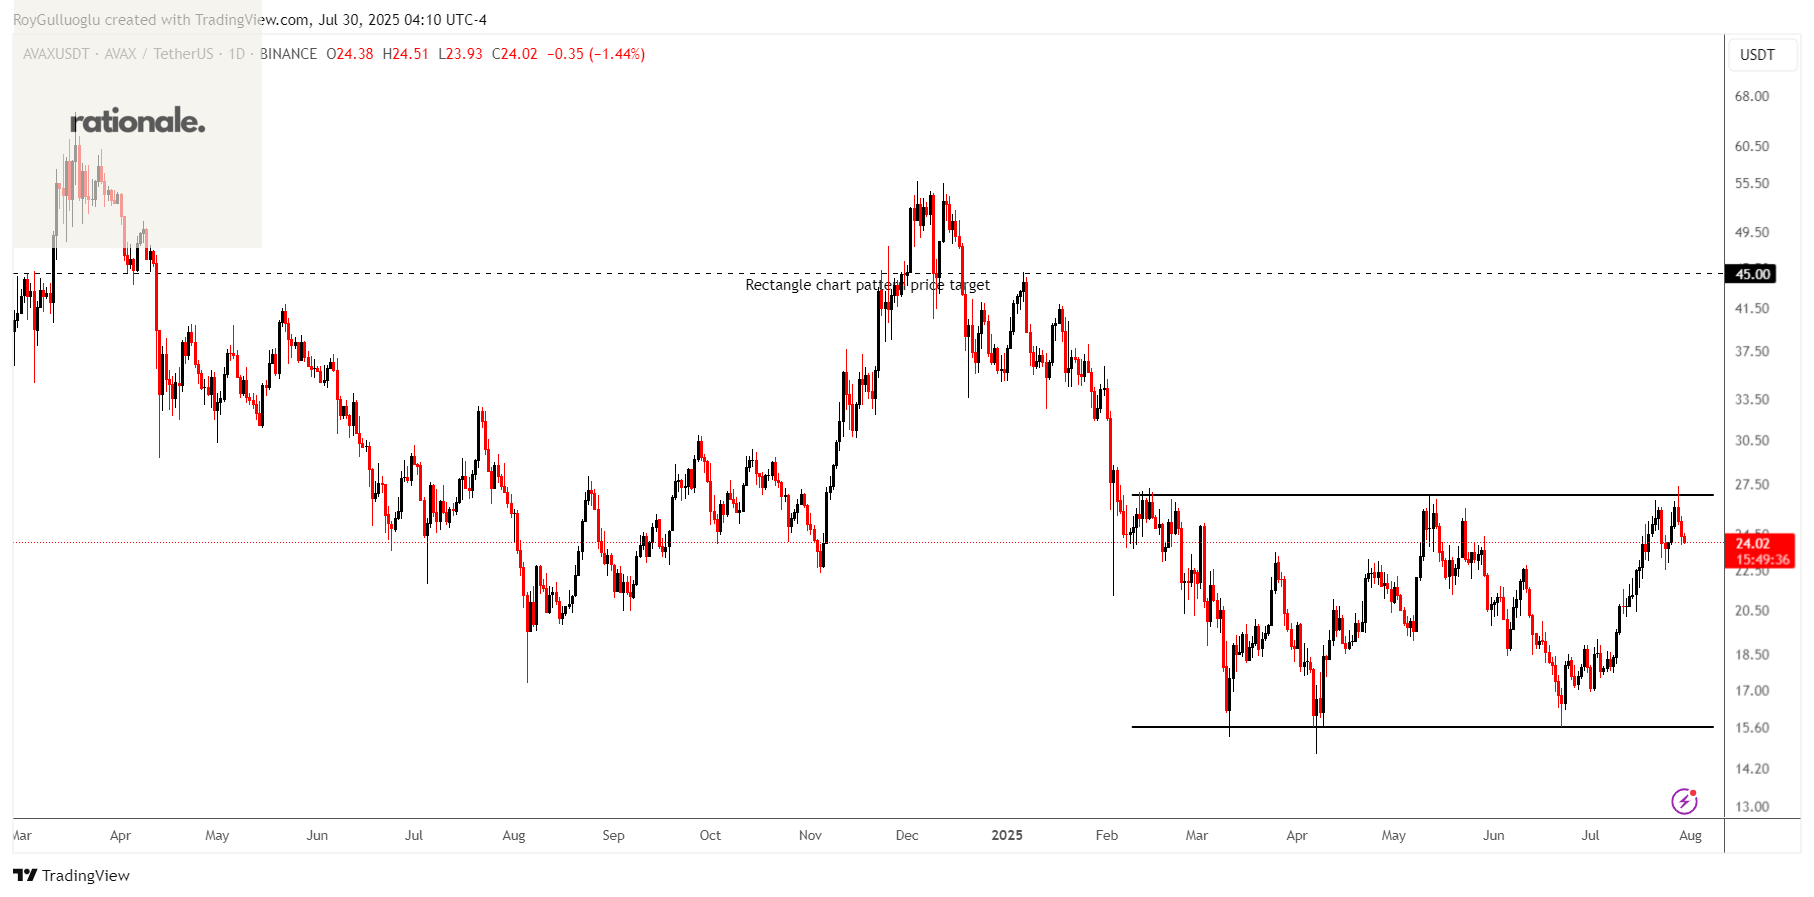
The above daily chart formed an approximately 6-month-long rectangle chart pattern as a bullish reversal after a downtrend.
The horizontal boundary at 26.53 levels acts as a resistance within this pattern.
A daily close above 27.33 levels would validate the breakout from the 6-month-long rectangle chart pattern.
Based on this chart pattern, the potential price target is approximately 45 levels.
CRVUSDT-Long Idea
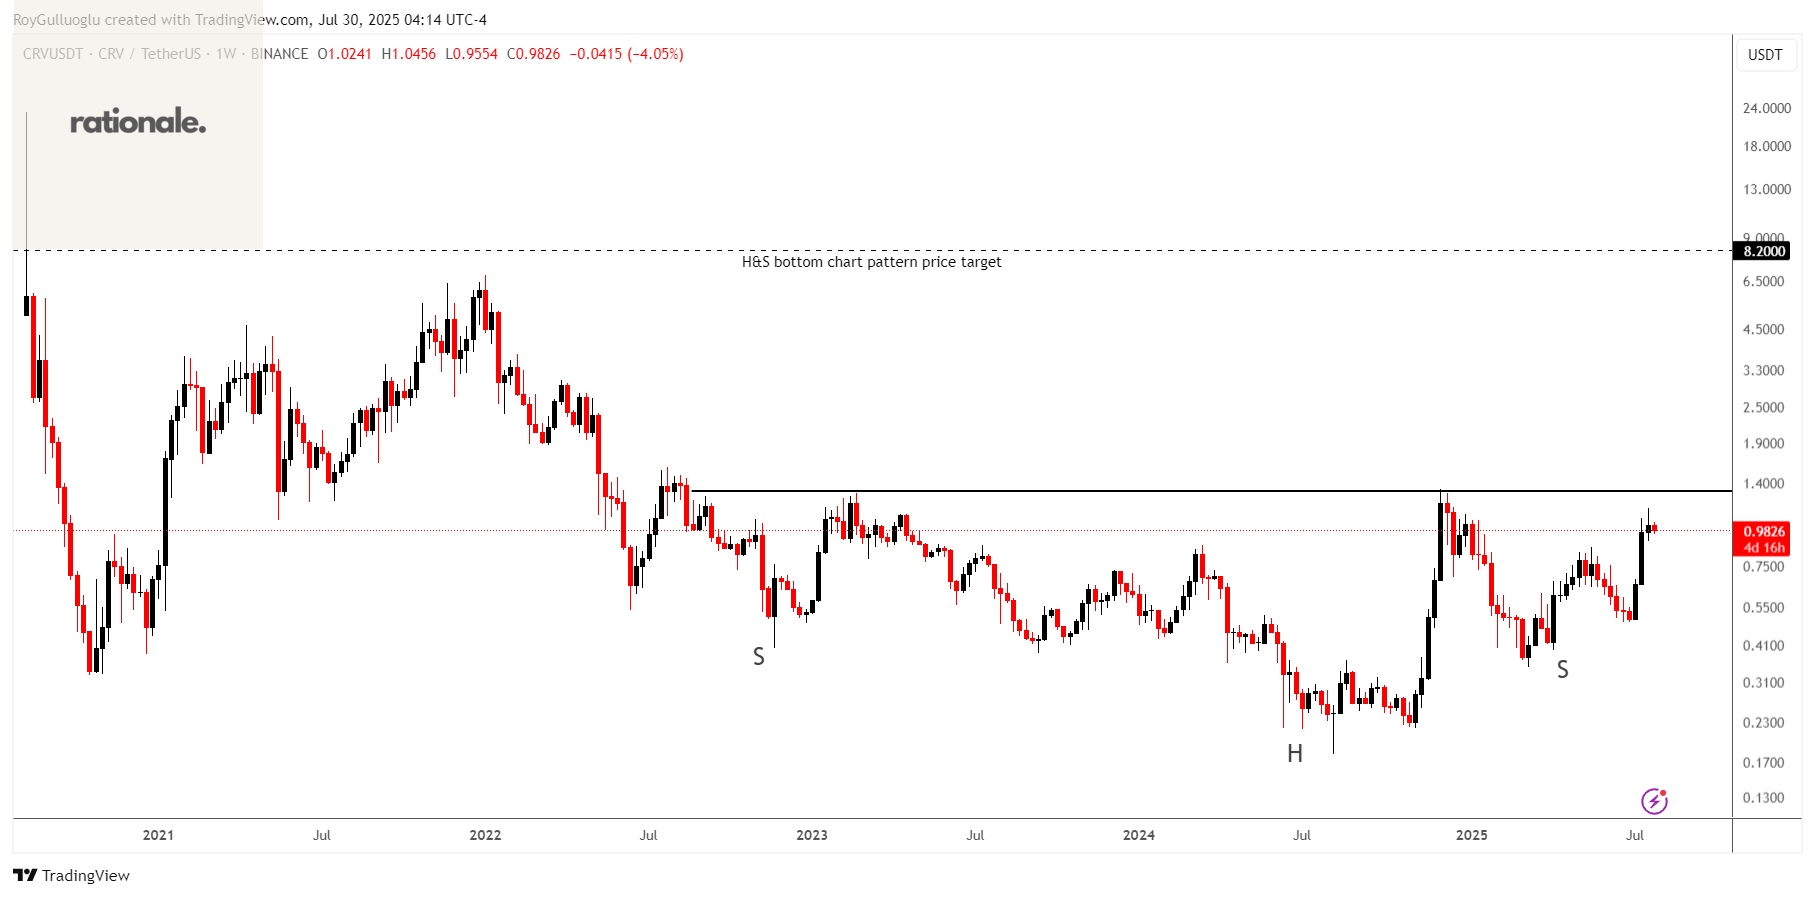
The above weekly chart formed an approximately 37-month-long H&S bottom chart pattern as a bullish reversal after a downtrend.
The horizontal boundary at 1.325 levels acts as a resistance within this pattern.
A daily close above 1.364 levels would validate the breakout from the 37-month-long H&S bottom chart pattern.
Based on this chart pattern, the potential price target is approximately 8.2 levels.