

New setups
TICKERS: HYG(ARCA), ARKQ(ARCA), SCZ(ARCA), KC1!(ICEUS), HSI1!(HKEX), ZL1!(CBOT)
iShares iBoxx USD High Yield Corporate Bond ETF-(HYG/ARCA)-Long/Short Idea
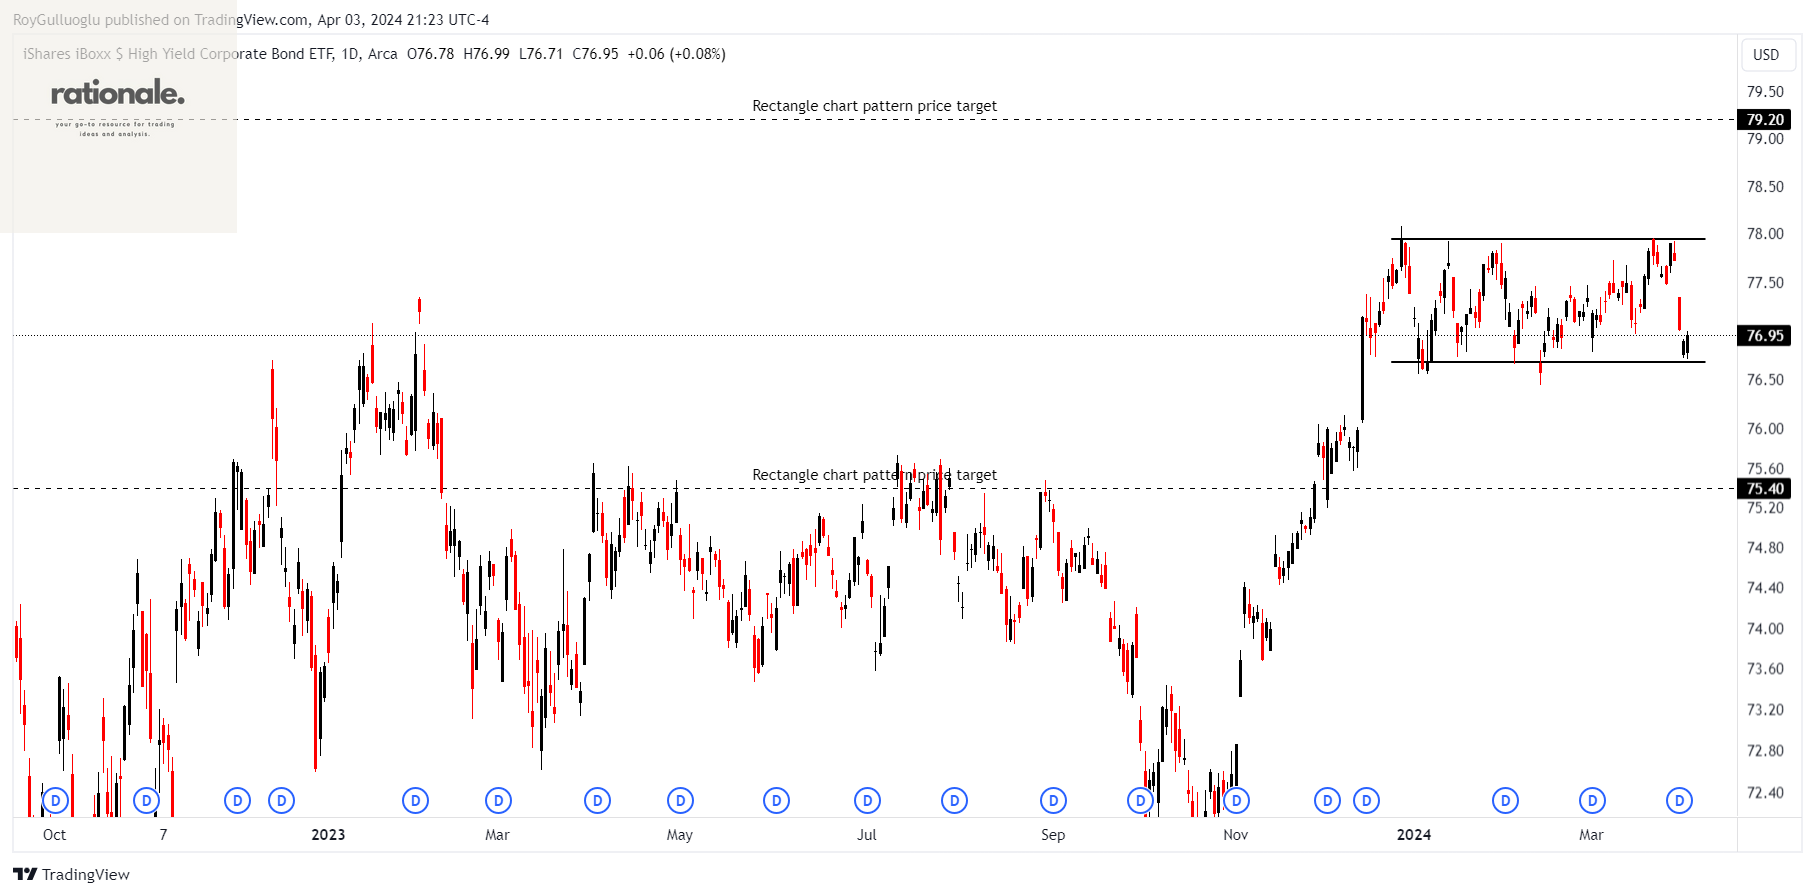
HYG follows an index that is weighted according to the market value of high-yield corporate debt in the United States. HYG was the first mover in the high-yield corporate bond market.
The above daily chart formed an approximately 2-month-long rectangle chart pattern.
Within this pattern, the horizontal boundary at 77.95(ATR 30/2+resistance) levels acts as a resistance, and at 76.55(support-ATR 30/2) levels acts as a support.
A daily close above 78.1 levels would validate the breakout from the 2-month-long rectangle chart pattern. Also, a daily close below 76.4 would validate the breakdown from the rectangle top reversal chart pattern.
Based on these chart patterns, the potential price target is at 79.2 and 75.4 levels respectively.
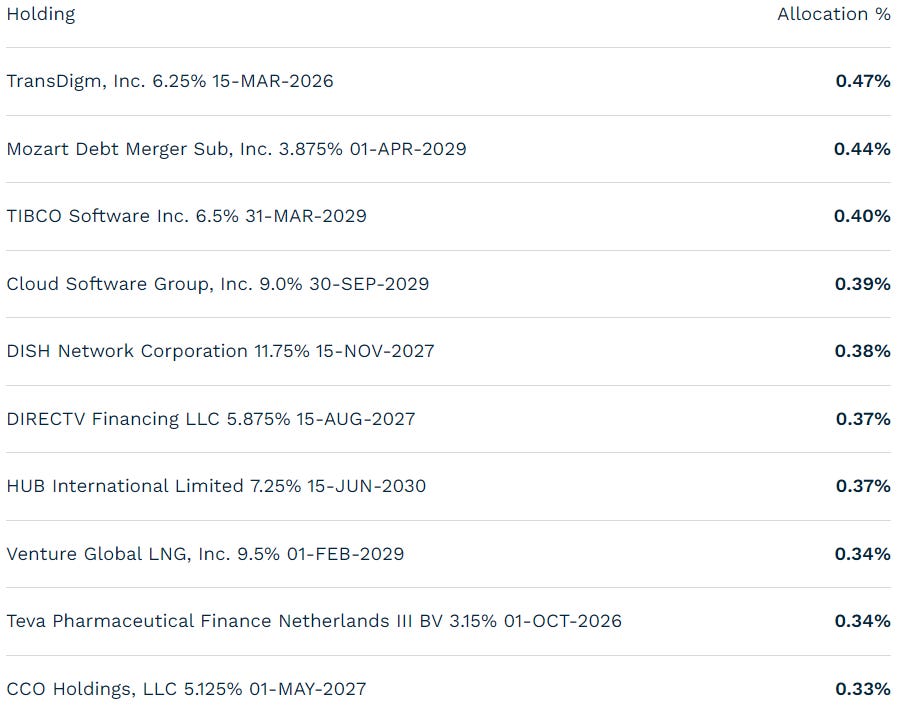
Top 10 holdings

Source: etf.com
ARK Autonomous Technology & Robotics ETF-(ARKQ/ARCA)-Long Idea
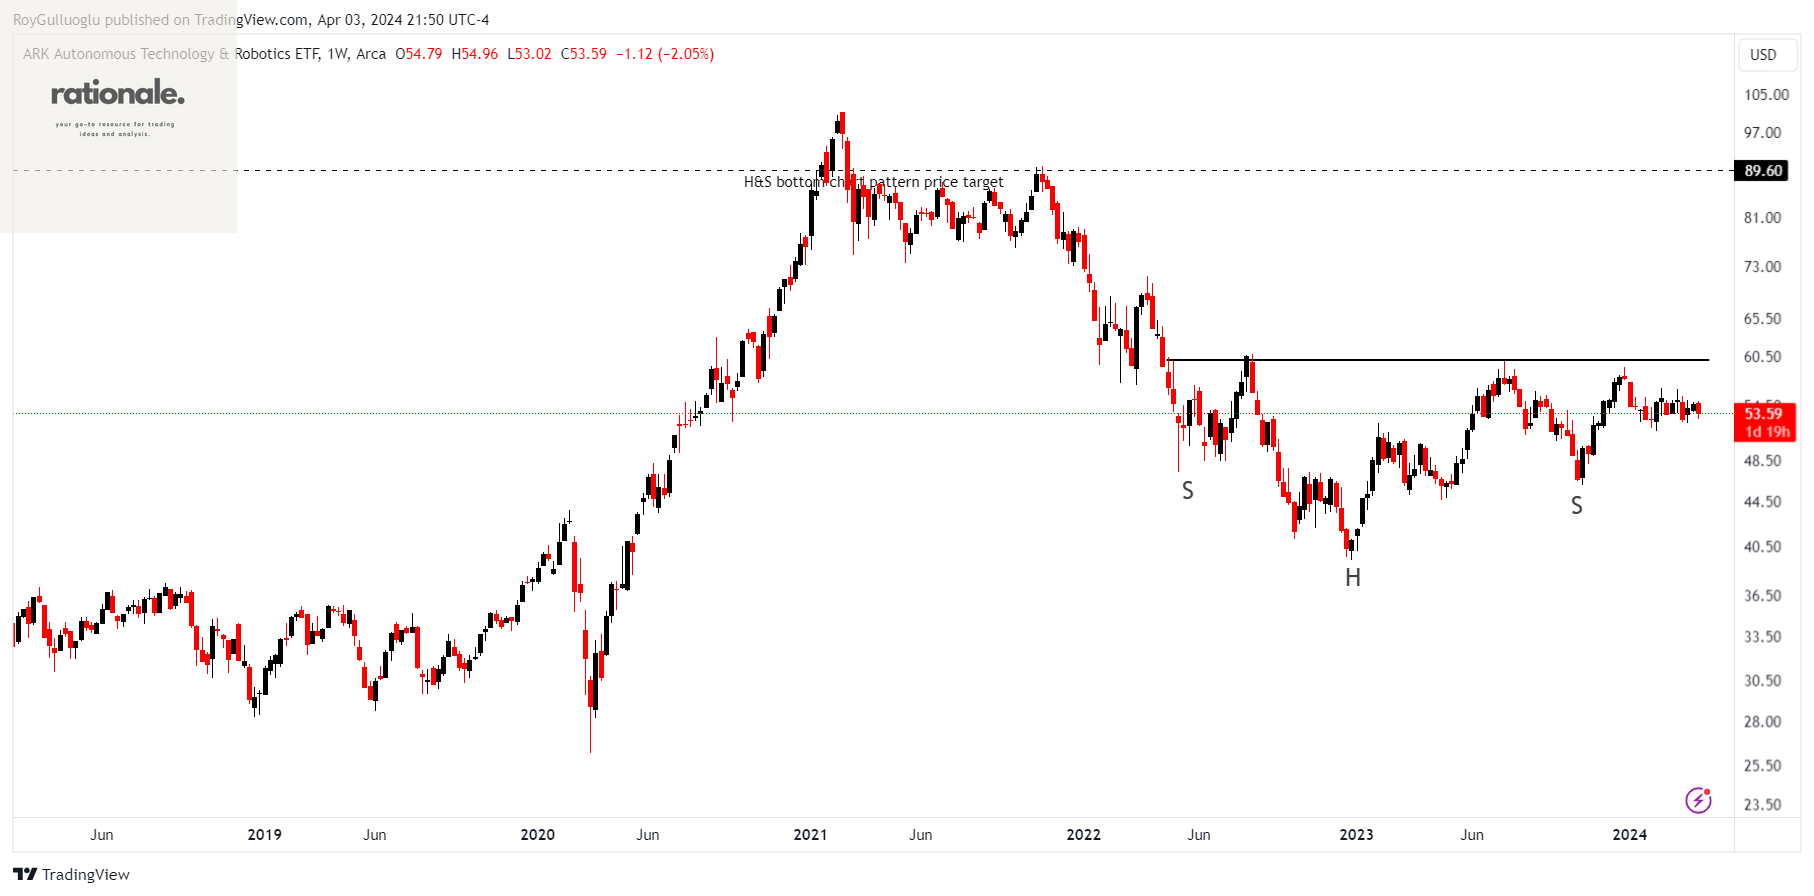
ARKQ is an actively managed fund with a wide-ranging mission to invest in companies identified by its managers as poised to benefit from automation and other technological advancements.
The above weekly chart formed an approximately 21-month-long H&S bottom chart pattern as a bullish reversal after a downtrend.
Within this pattern, the horizontal boundary at 60 levels acts as a resistance.
A daily close above 61.8 levels would validate the breakout from the 21-month-long H&S bottom chart pattern.
Based on this chart pattern, the potential price target is 89.6 levels.
Top 10 holdings
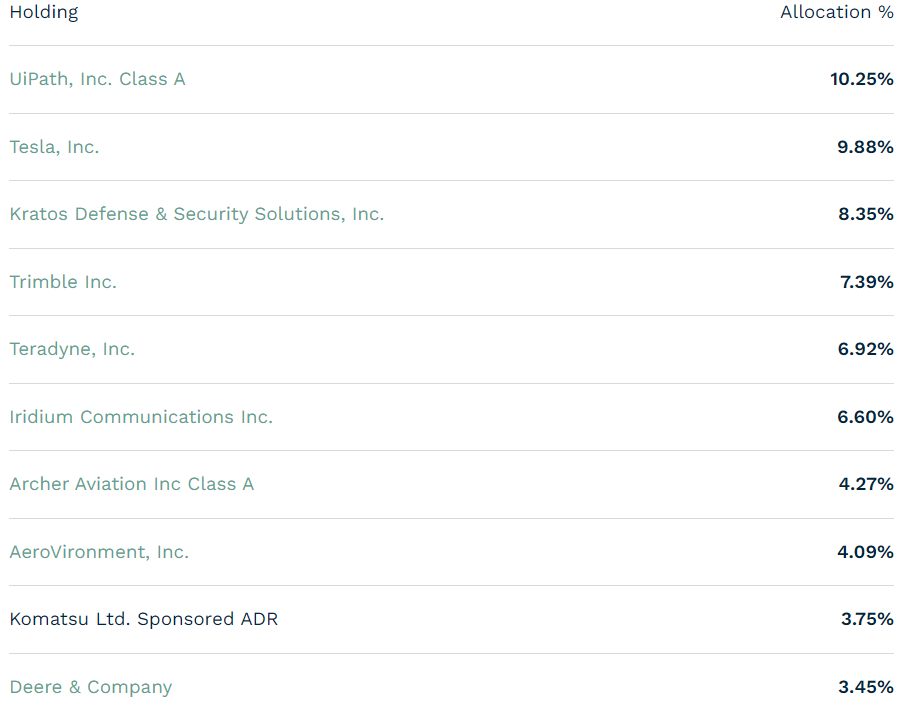
Source: etf.com iShares MSCI EAFE Small-Cap ETF-(SCZ/ARCA)-Long Idea
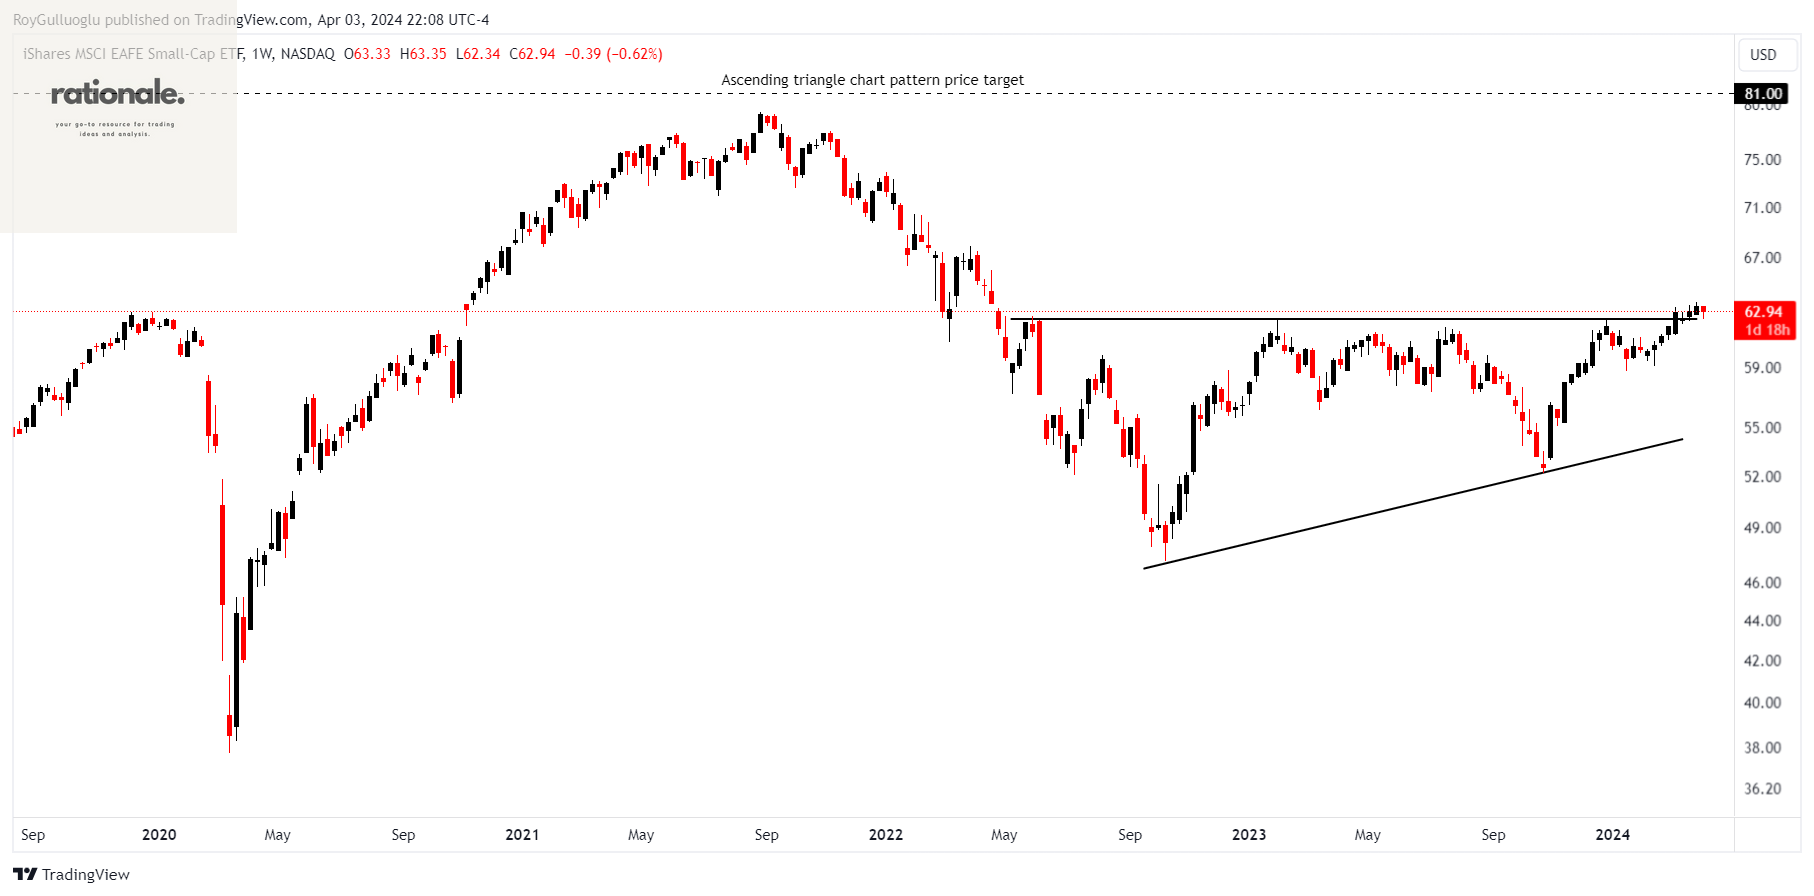


SCZ is well-known for providing a classic, market-cap-weighted representation of an internationally developed, small-cap market with a diverse collection of holdings.
The above weekly chart formed an approximately 22-month-long ascending triangle chart pattern as a bullish reversal after a downtrend.
Within this pattern, the horizontal boundary at 62.38 levels acts as a resistance.
A daily close above 64.25 levels would validate the breakout from the 22-month-long ascending triangle chart pattern.
Based on this chart pattern, the potential price target is 81 levels.
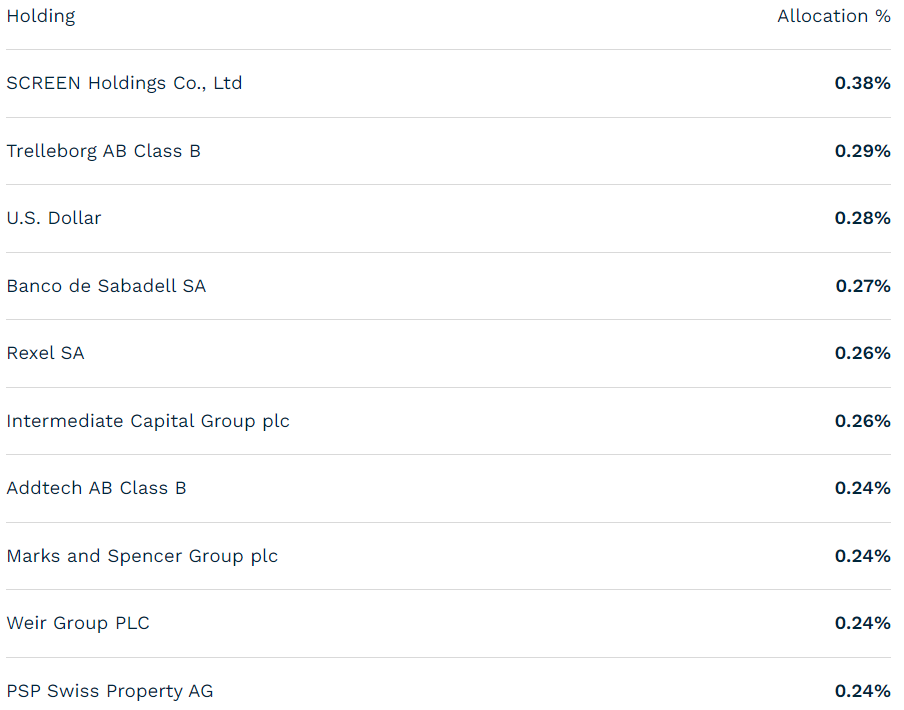
Top 10 holdings

KC1!(Coffee C Futures)-Long Idea
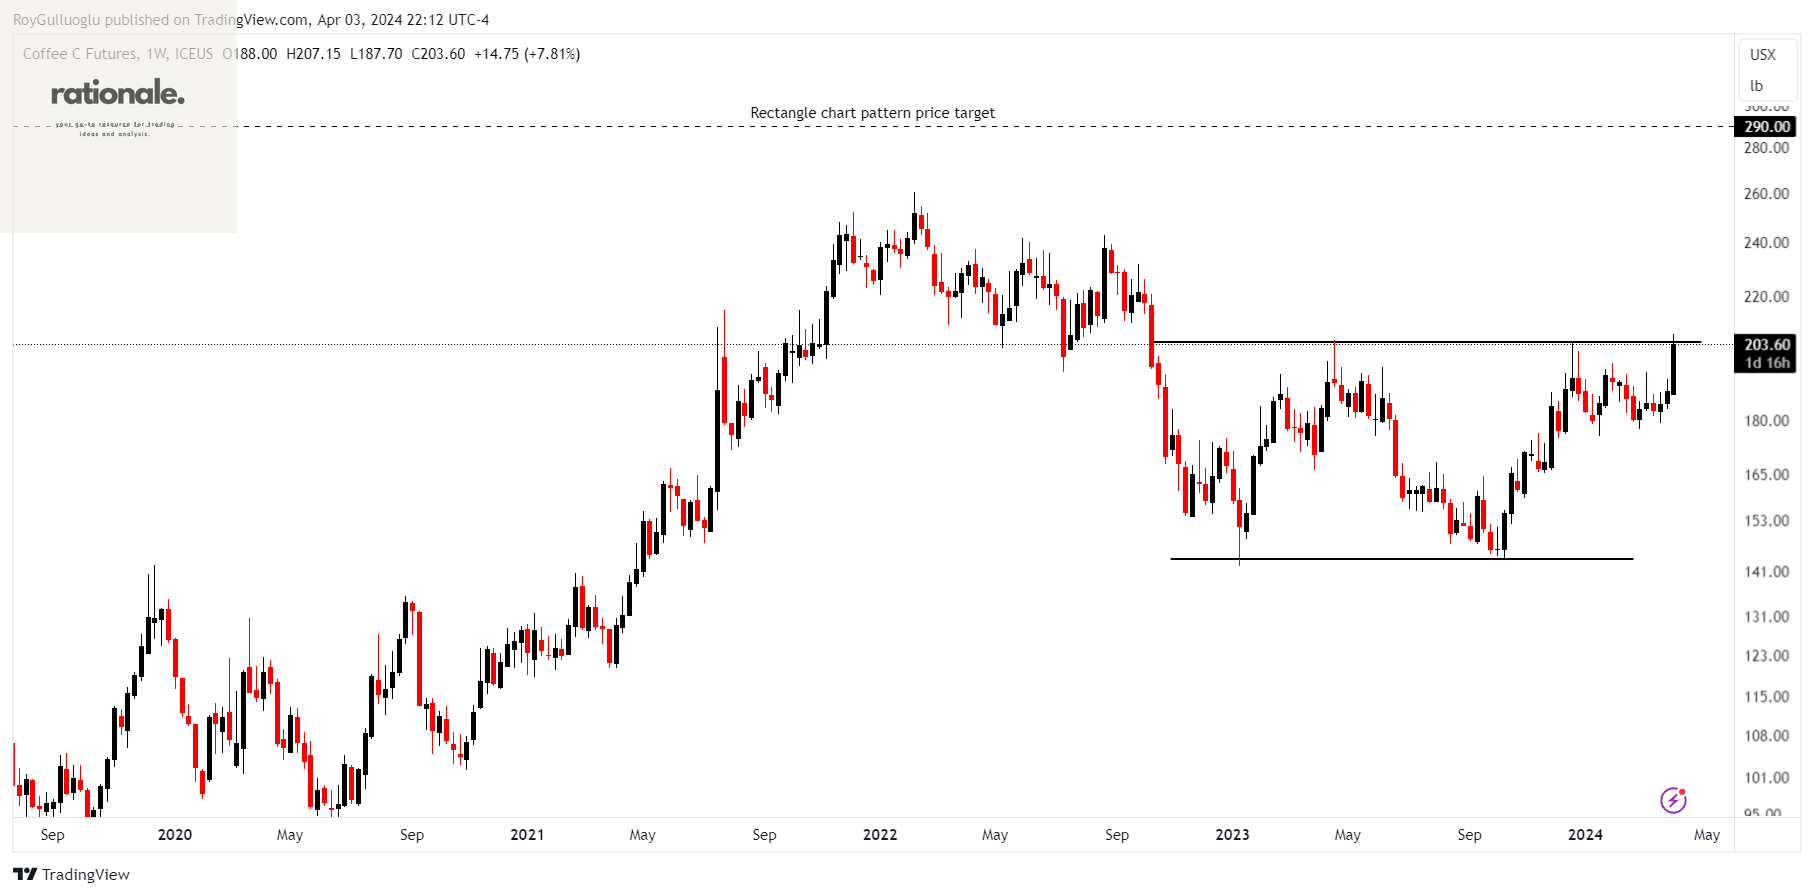
The above daily chart formed an approximately 19-month-long rectangle chart pattern as a bullish reversal after a downtrend.
Within this pattern, the horizontal boundary at 204.35 levels acts as a resistance.
A daily close above 210.4 levels would validate the breakout from the 19-month-long rectangle chart pattern.
Based on this chart pattern, the potential price target is 290 levels.
HSI1!(Hang Seng Index Futures)-Long Idea
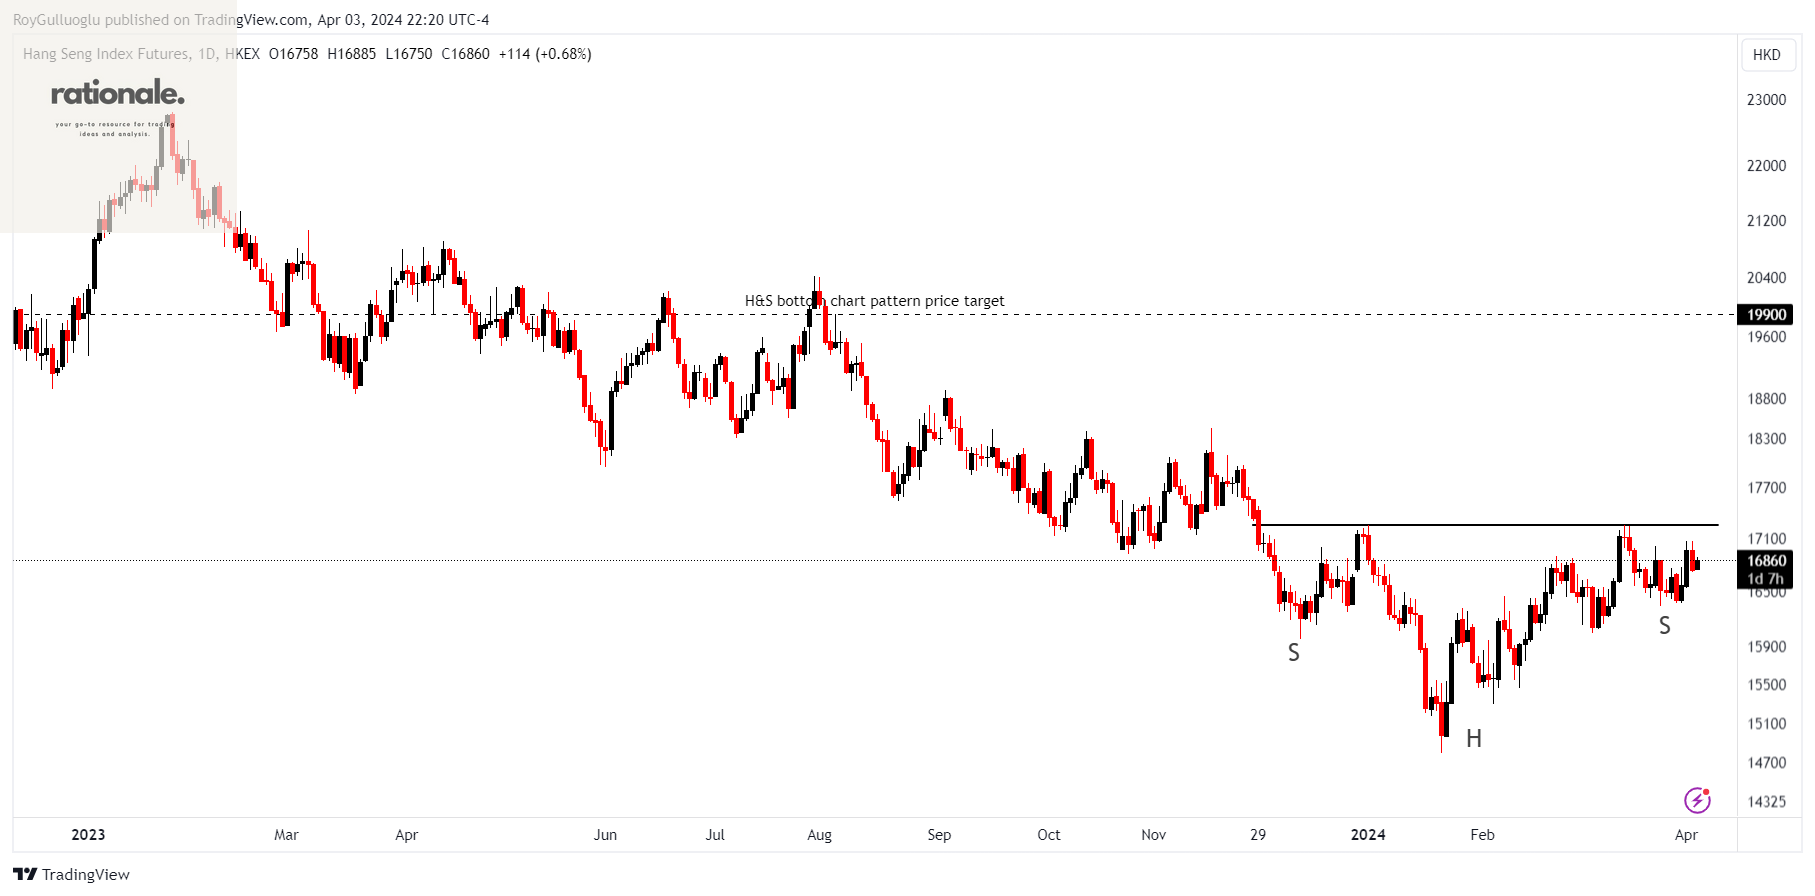
The above daily chart formed an approximately 3-month-long H&S bottom chart pattern as a bullish reversal after a downtrend.
Within this pattern, the horizontal boundary at 17260 levels acts as a resistance.
A daily close above 17770 levels would validate the breakout from the 3-month-long H&S bottom chart pattern.
Based on this chart pattern, the potential price target is 19900 levels.
ZL1!(Soybean Oil Futures)-Long Idea
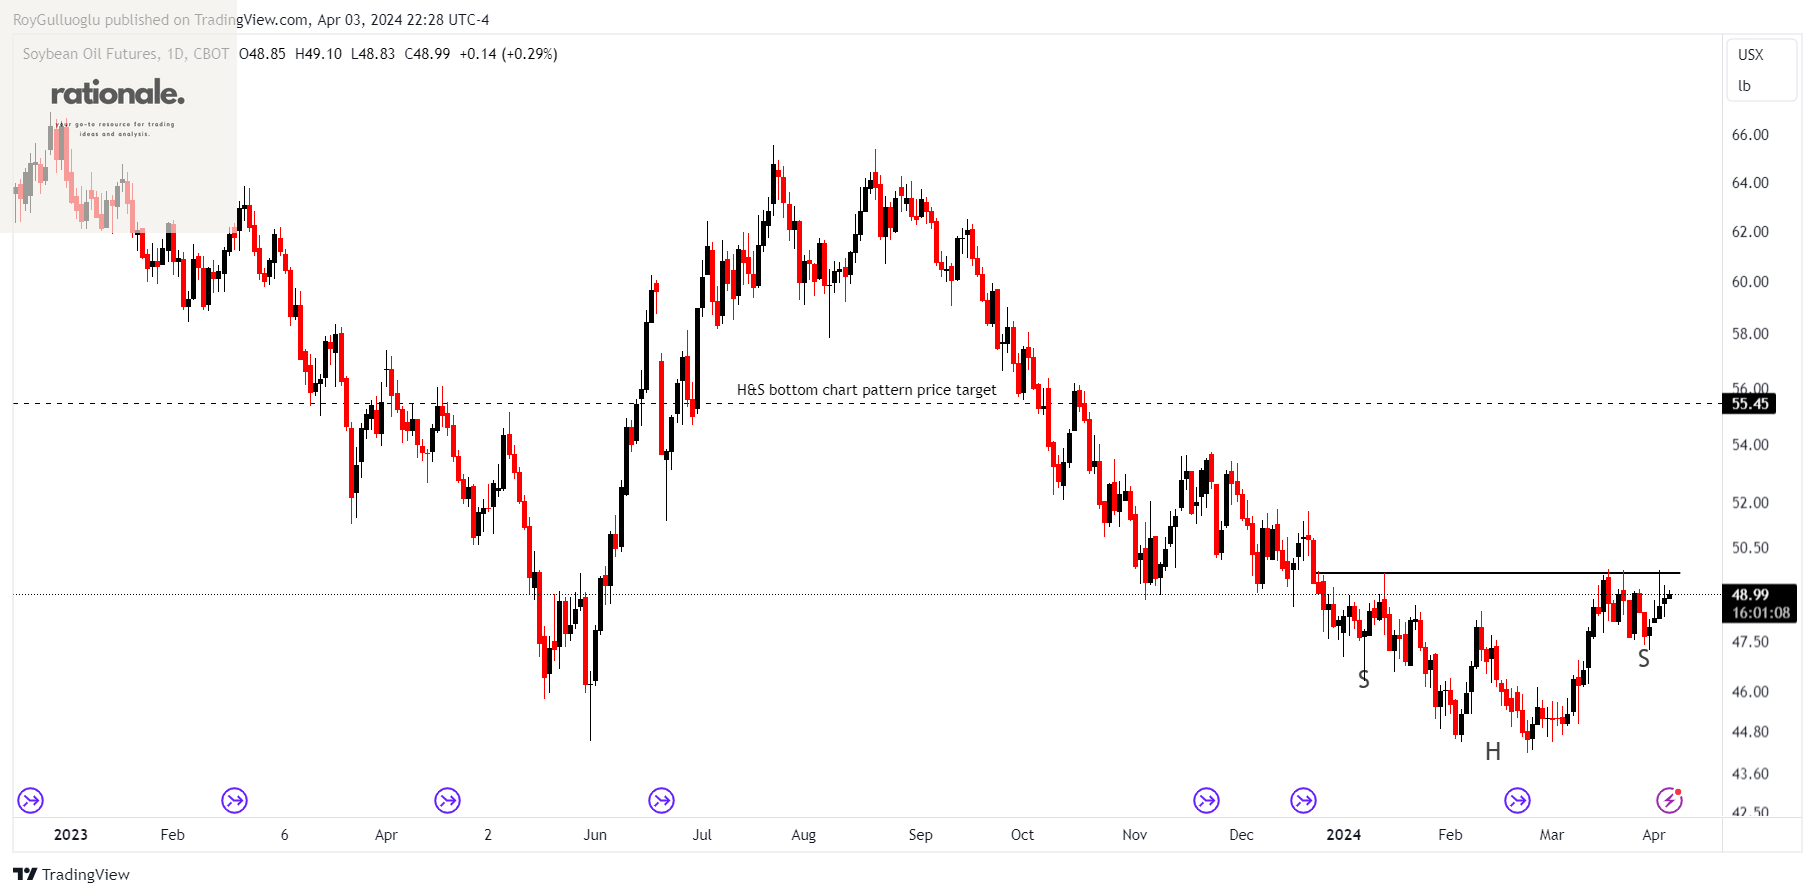
The above daily chart formed an approximately 2-month-long H&S bottom chart pattern as a bullish reversal after a downtrend.
Within this pattern, the horizontal boundary at 49.65 levels acts as a resistance.
A daily close above 51 levels would validate the breakout from the 2-month-long H&S bottom chart pattern.
Based on this chart pattern, the potential price target is 55.45 levels.