

Trade Ideas Fx-Futures-Etf-Crypto
AUDCAD, USDZAR, FDAX1!(EUREX), BUSD, MYXUSD

AUDCAD-Short Idea
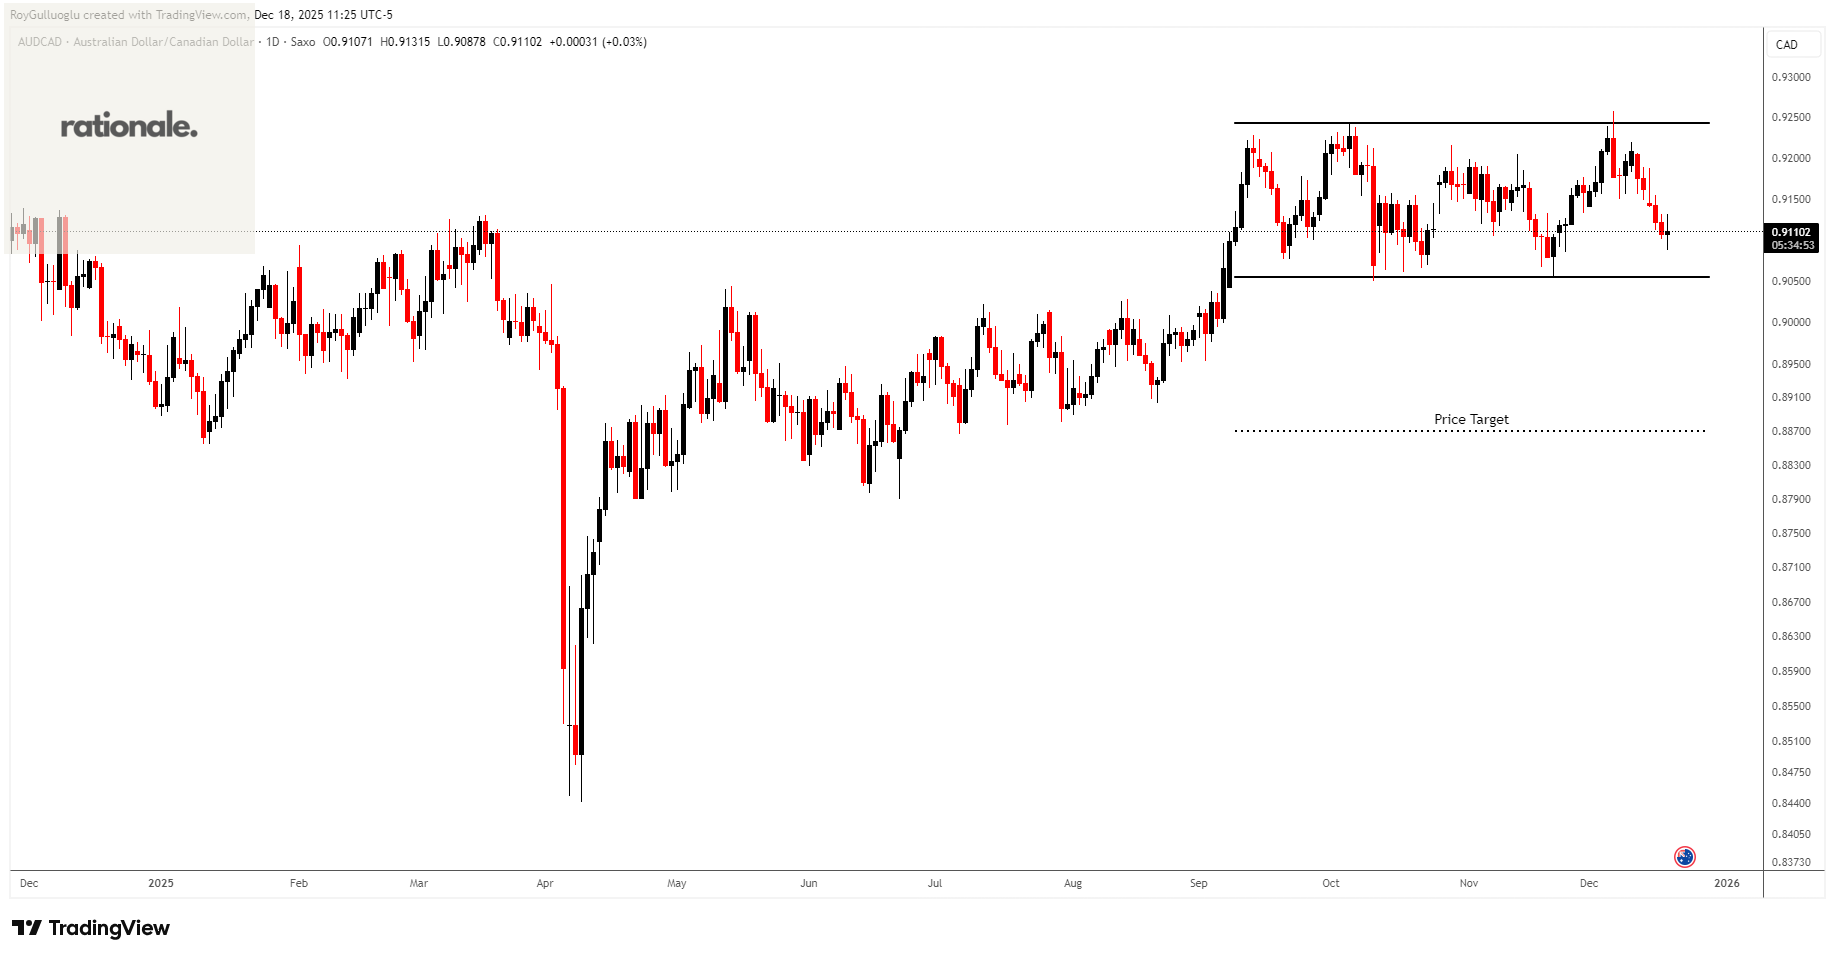
The above daily chart formed an approximately 3-month-long rectangle chart pattern as a bearish reversal after an uptrend.
The horizontal boundary at 0.90544 levels acts as a support within this pattern.
A daily close below 0.8963 levels would validate the breakdown from the 3-month-long rectangle chart pattern.
Based on this chart pattern, the potential price target is approximately 0.887 levels.
The Canadian dollar remains more directly supported by crude oil dynamics, while the Australian dollar is more sensitive to industrial metals and China demand. With oil holding up better than bulk commodities, the relative terms of trade favor CAD.
China growth uncertainty weighs on AUD. Australia’s economy and currency remain highly exposed to Chinese demand. Ongoing concerns around China’s growth, property sector stress, and uneven stimulus transmission continue to act as a headwind for AUD.
USDZAR-Short Idea
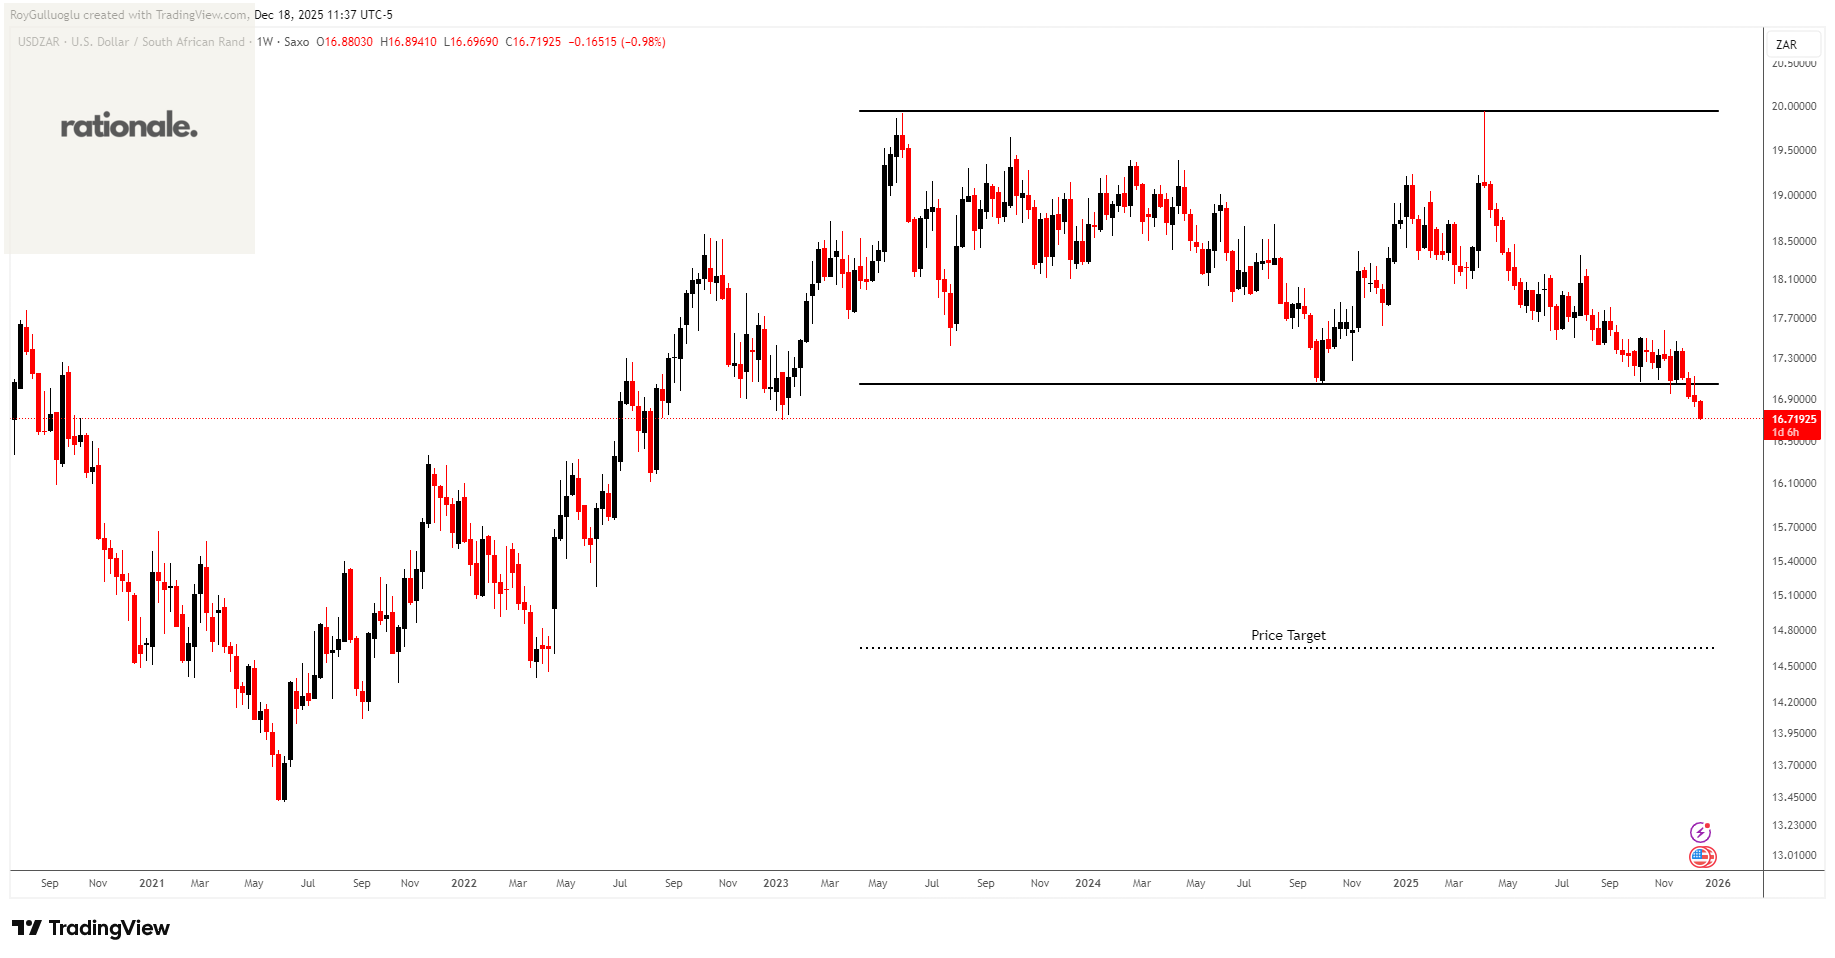
The above weekly chart formed an approximately 30-month-long rectangle chart pattern as a bearish reversal after an uptrend.
The horizontal boundary at 17.05 levels acted as a support within this pattern.
A daily close below 16.88 levels validated the breakdown from the 30-month-long rectangle chart pattern.
Based on this chart pattern, the potential price target is approximately 14.65 levels.
High carry continues to support ZAR. South Africa still offers one of the highest real yields among major emerging markets. As long as global risk appetite remains stable, carry flows tend to favor ZAR and put downside pressure on USDZAR.
A risk to monitor: A resurgence in US inflation forcing the Fed back into a hawkish stance would support USD.
FDAX1!(DAX Futures)-Long Idea
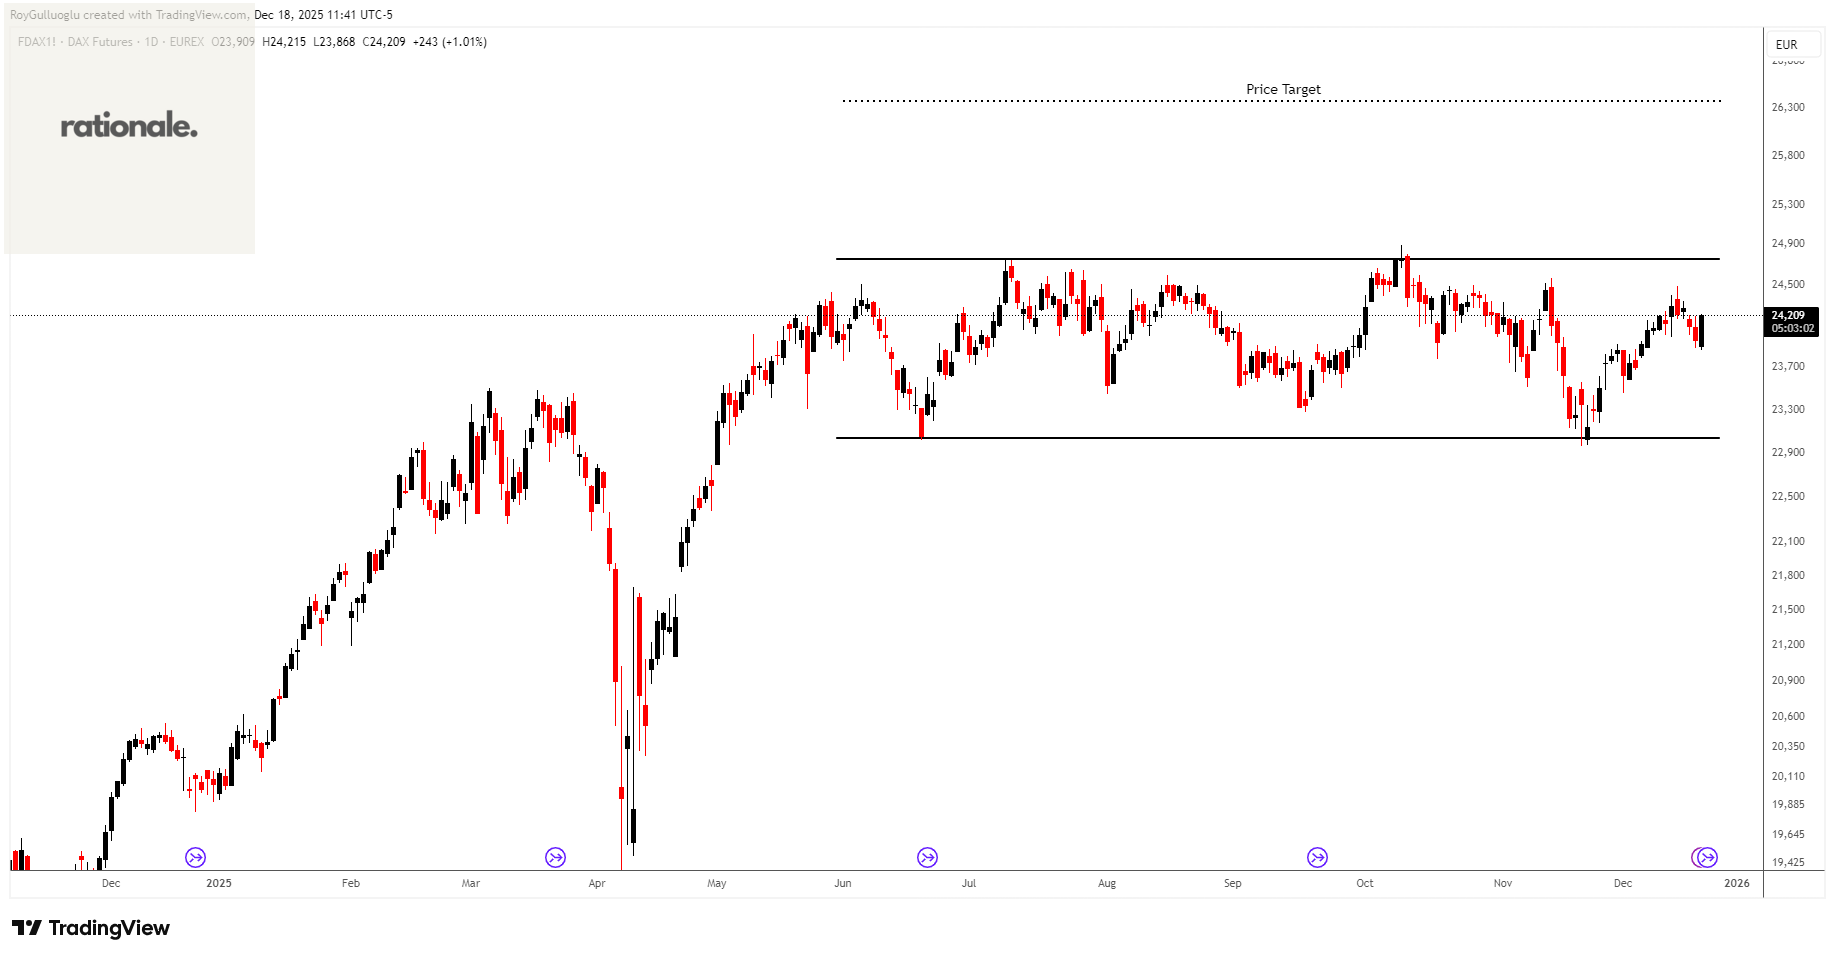
The above daily chart formed an approximately 5-month-long rectangle chart pattern as a bullish continuation after an uptrend.
The horizontal boundary at 24750 levels acts as a resistance within this pattern.
A daily close above 24998 levels would validate the breakout from the 5-month-long rectangle chart pattern.
Based on this chart pattern, the potential price target is approximately 26375 levels.
Improving European growth expectations. Recent PMI and macro data show stabilization across the Eurozone, with manufacturing and services surveys rebounding from prior lows.
DAX composition benefits from global demand. A large share of DAX constituents generate revenue outside Germany, making the index sensitive to global trade and external demand rather than domestic growth alone.
Energy cost pressure has moderated. European natural gas and electricity prices have stabilized compared with prior years, easing cost pressure for energy intensive industries.
MYXUSD-Long Idea
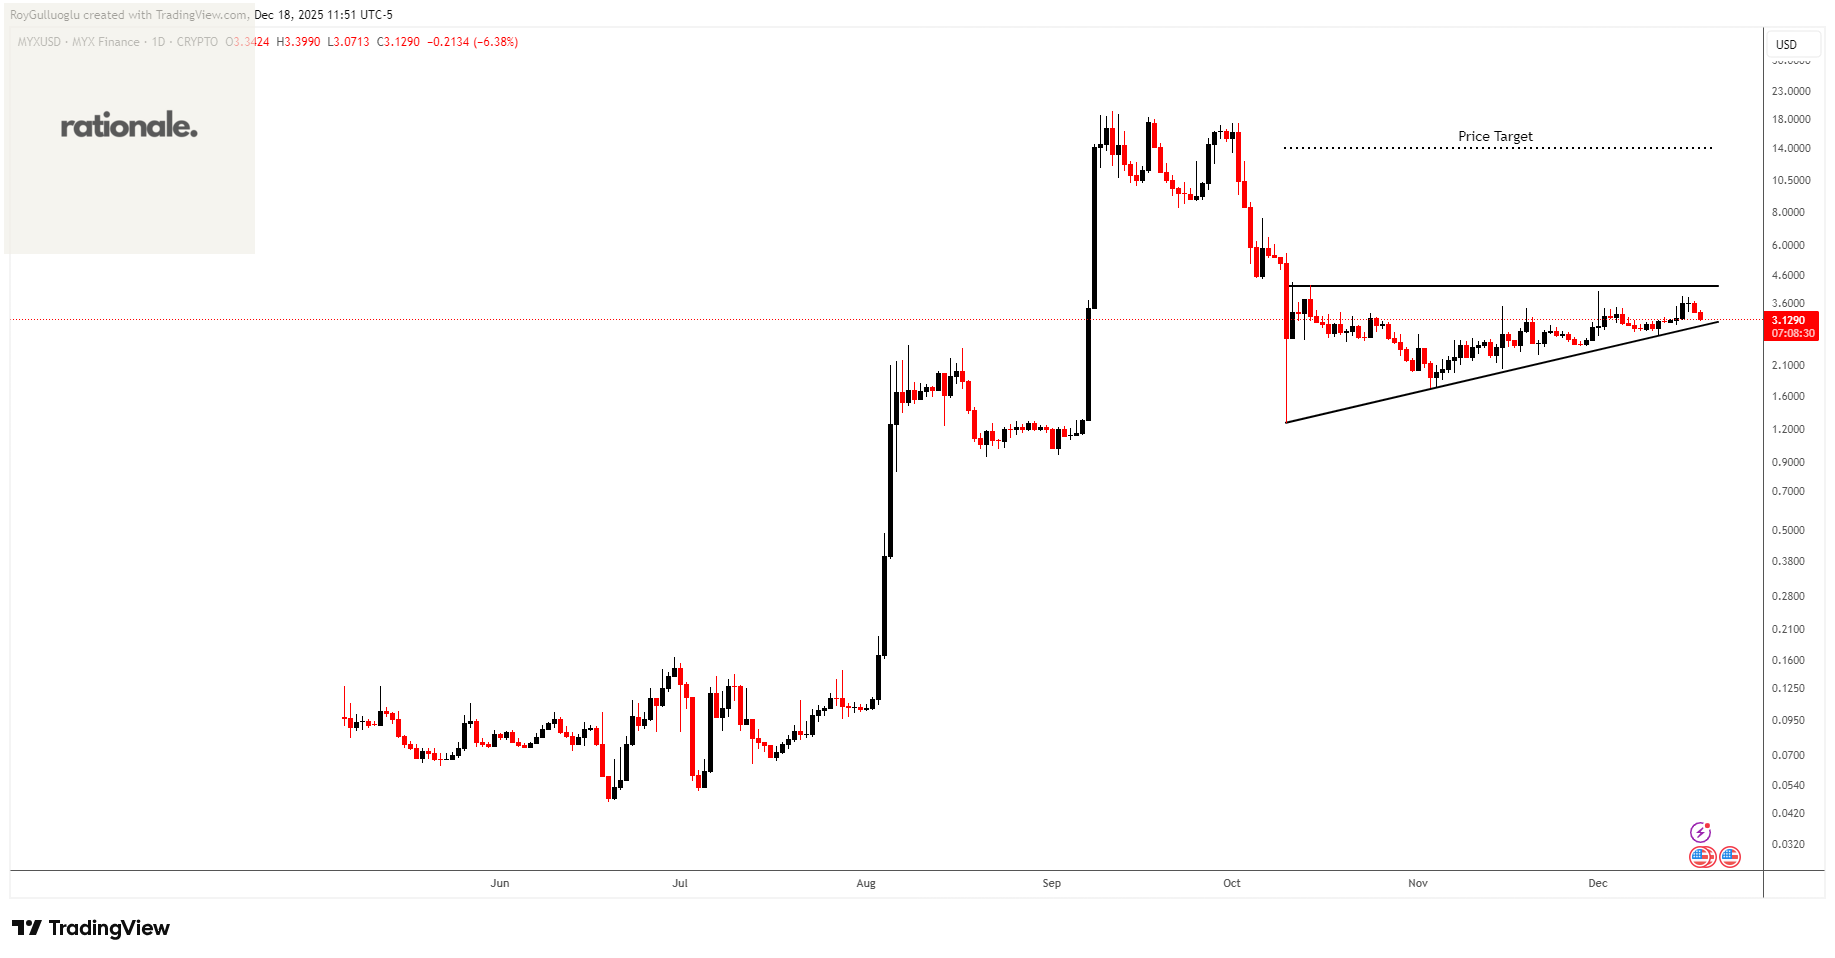
The above daily chart formed an approximately 3-month-long ascending triangle chart pattern as a bullish reversal after a downtrend.
The horizontal boundary at 4.2 levels acts as a resistance within this pattern.
A daily close above 4.32 levels would validate the breakout from the 3-month-long rectangle chart pattern.
Based on this chart pattern, the potential price target is approximately 13.9 levels.
BUSD-Long Idea
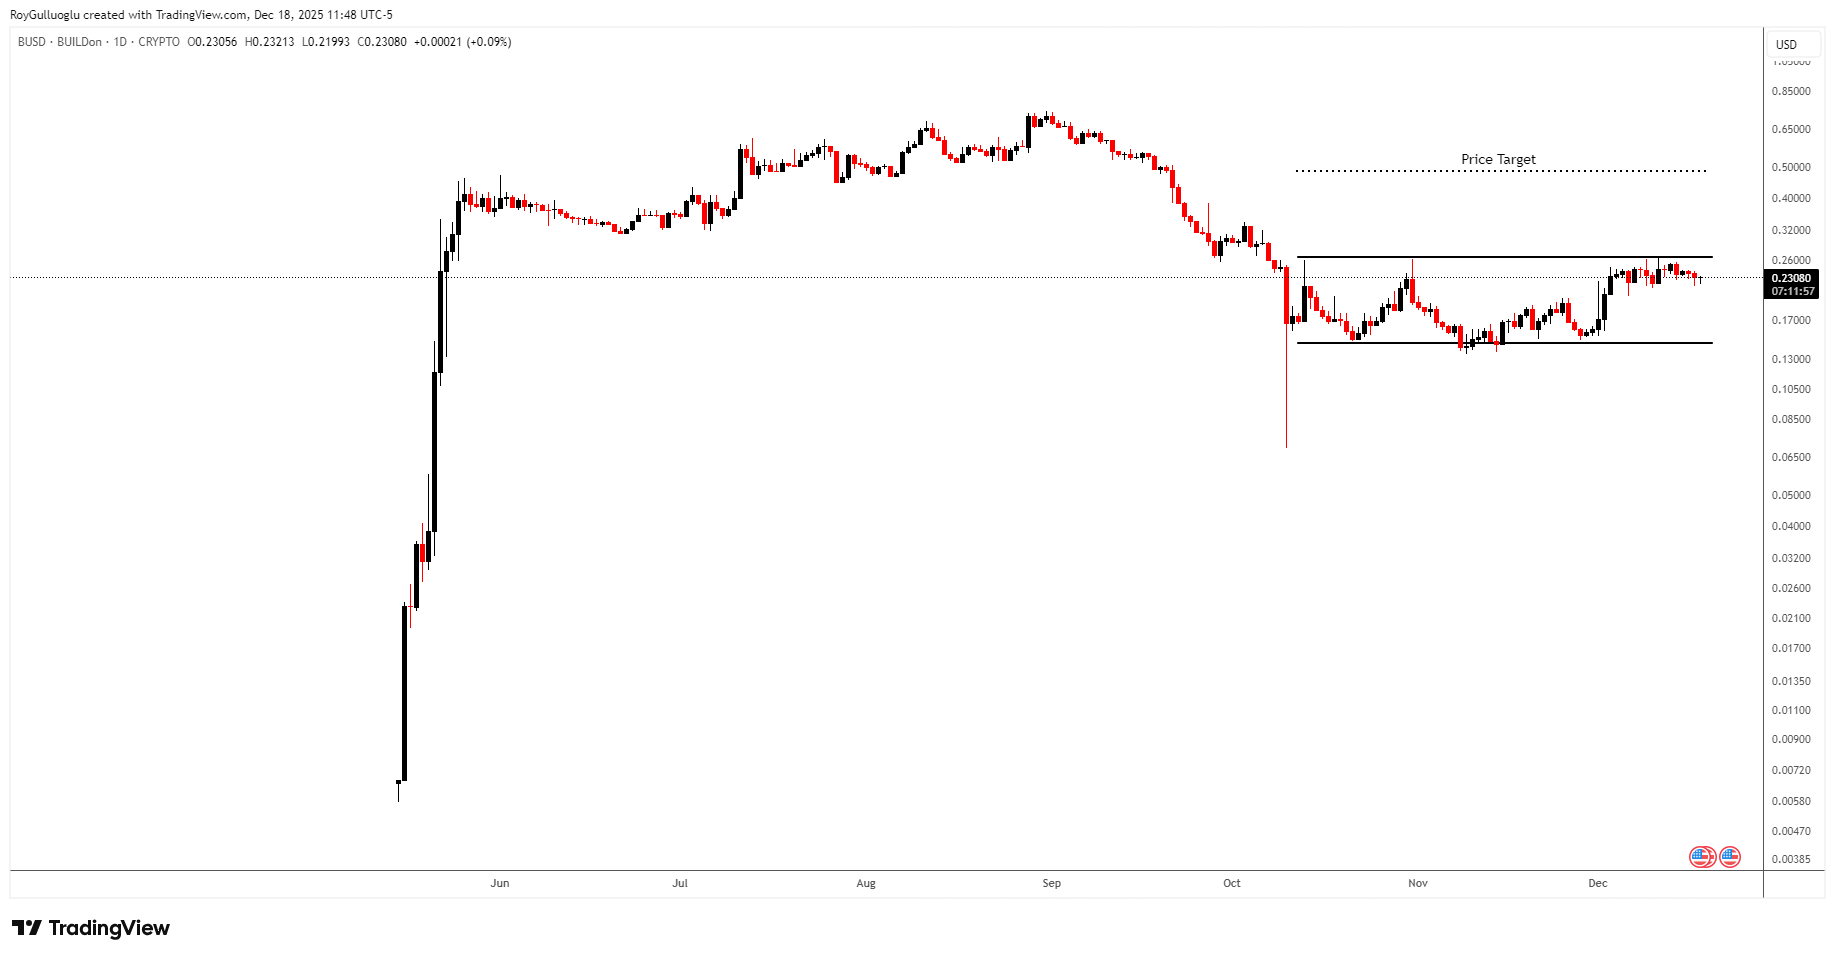
The above daily chart formed an approximately 3-month-long rectangle chart pattern as a bullish reversal after a downtrend.
The horizontal boundary at 0.2644 levels acts as a resistance within this pattern.
A daily close above 0.2723 levels would validate the breakout from the 3-month-long rectangle chart pattern.
Based on this chart pattern, the potential price target is approximately 0.485 levels.
Teşekkürler Roy