

Trade Ideas Fx-Futures-Etf-Crypto
SOLUSDT, DOGEUSDT,ARUSDT, BATUSDT, ARBUSDT

SOLUSDT-Long Idea
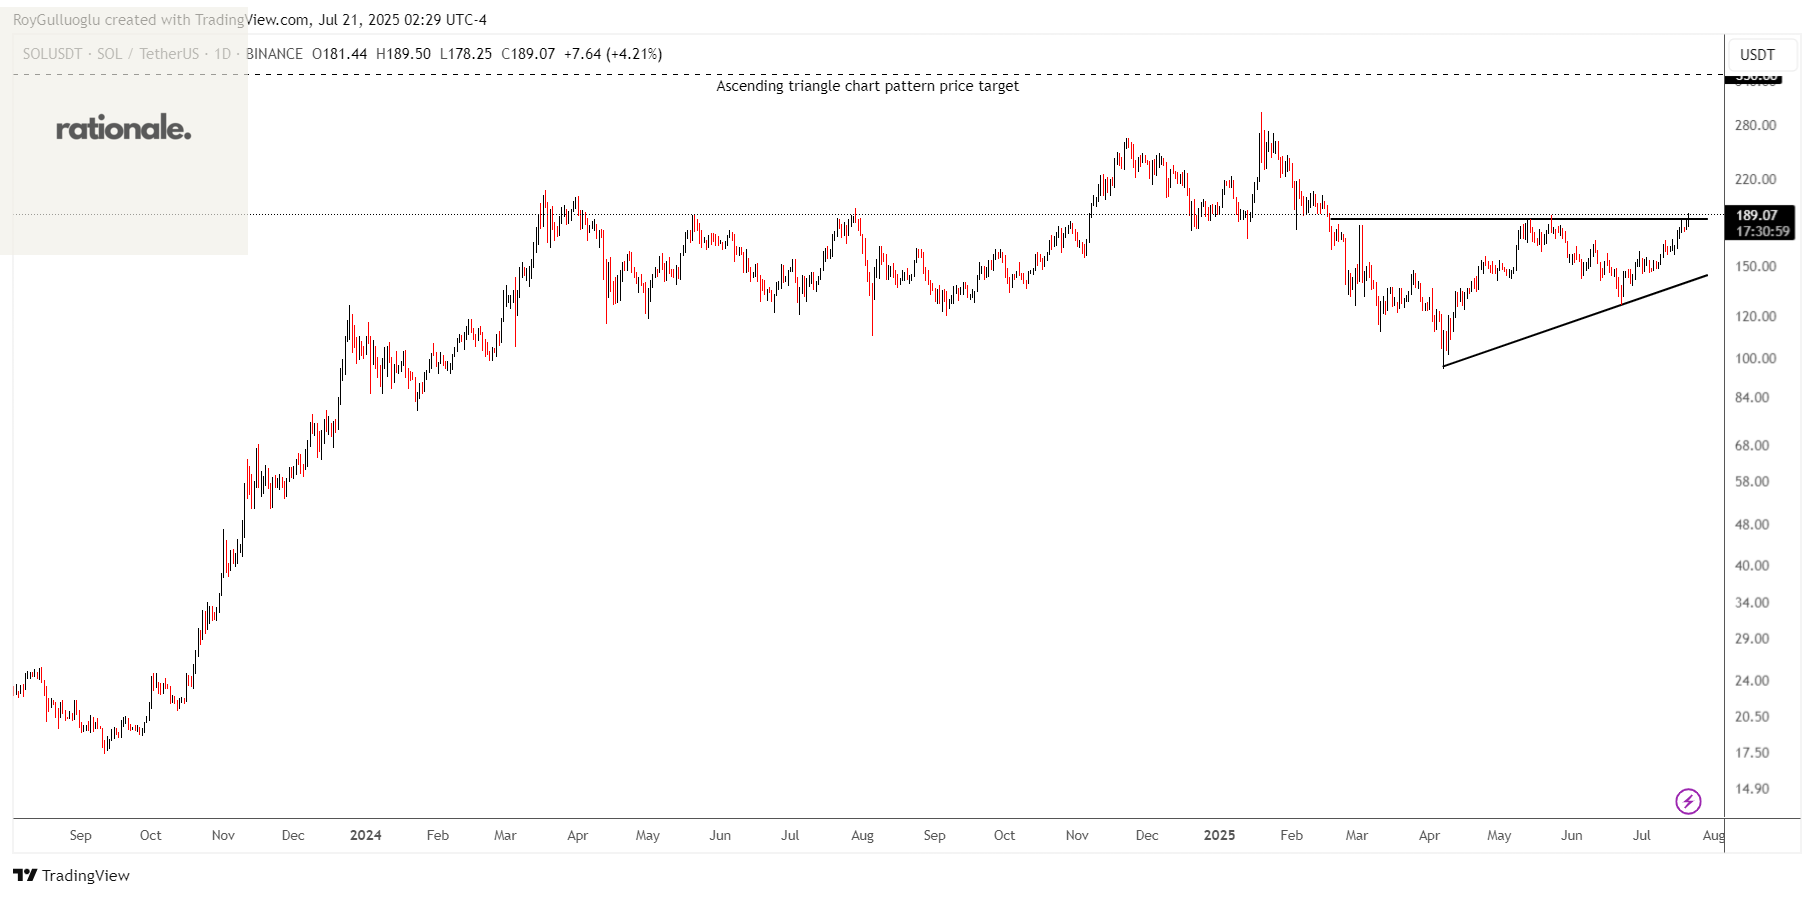
The above daily chart formed an approximately 5-month-long ascending triangle chart pattern as a bullish reversal after a downtrend.
The horizontal boundary at 185 levels acts as a resistance within this pattern.
A daily close above 190 levels would validate the breakout from the 5-month-long ascending triangle chart pattern.
Based on this chart pattern, the potential price target is approximately 350 levels.
DOGEUSDT-Long Idea
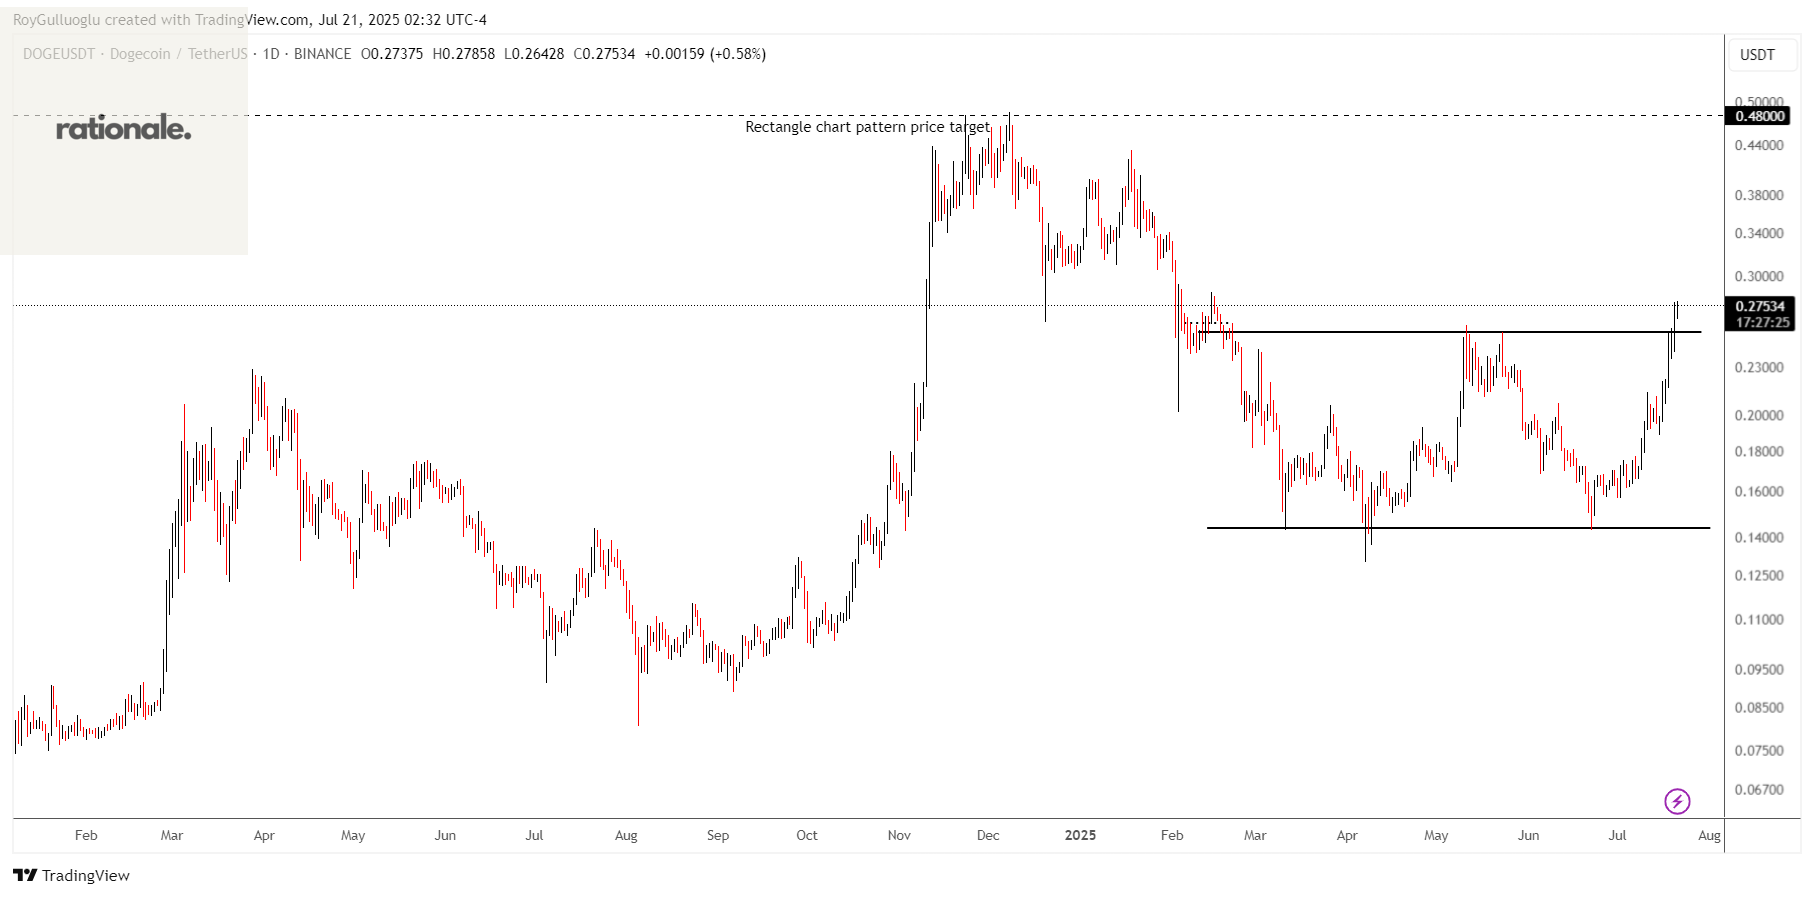
The above daily chart formed an approximately 4-month-long rectangle chart pattern as a bullish reversal after a downtrend.
The horizontal boundary at 0.2550 levels acted as a resistance within this pattern.
A daily close above 0.2626 levels validated the breakout from the 4-month-long rectangle chart pattern.
Based on this chart pattern, the potential price target is approximately 0.48 levels.
ARUSDT-Long Idea
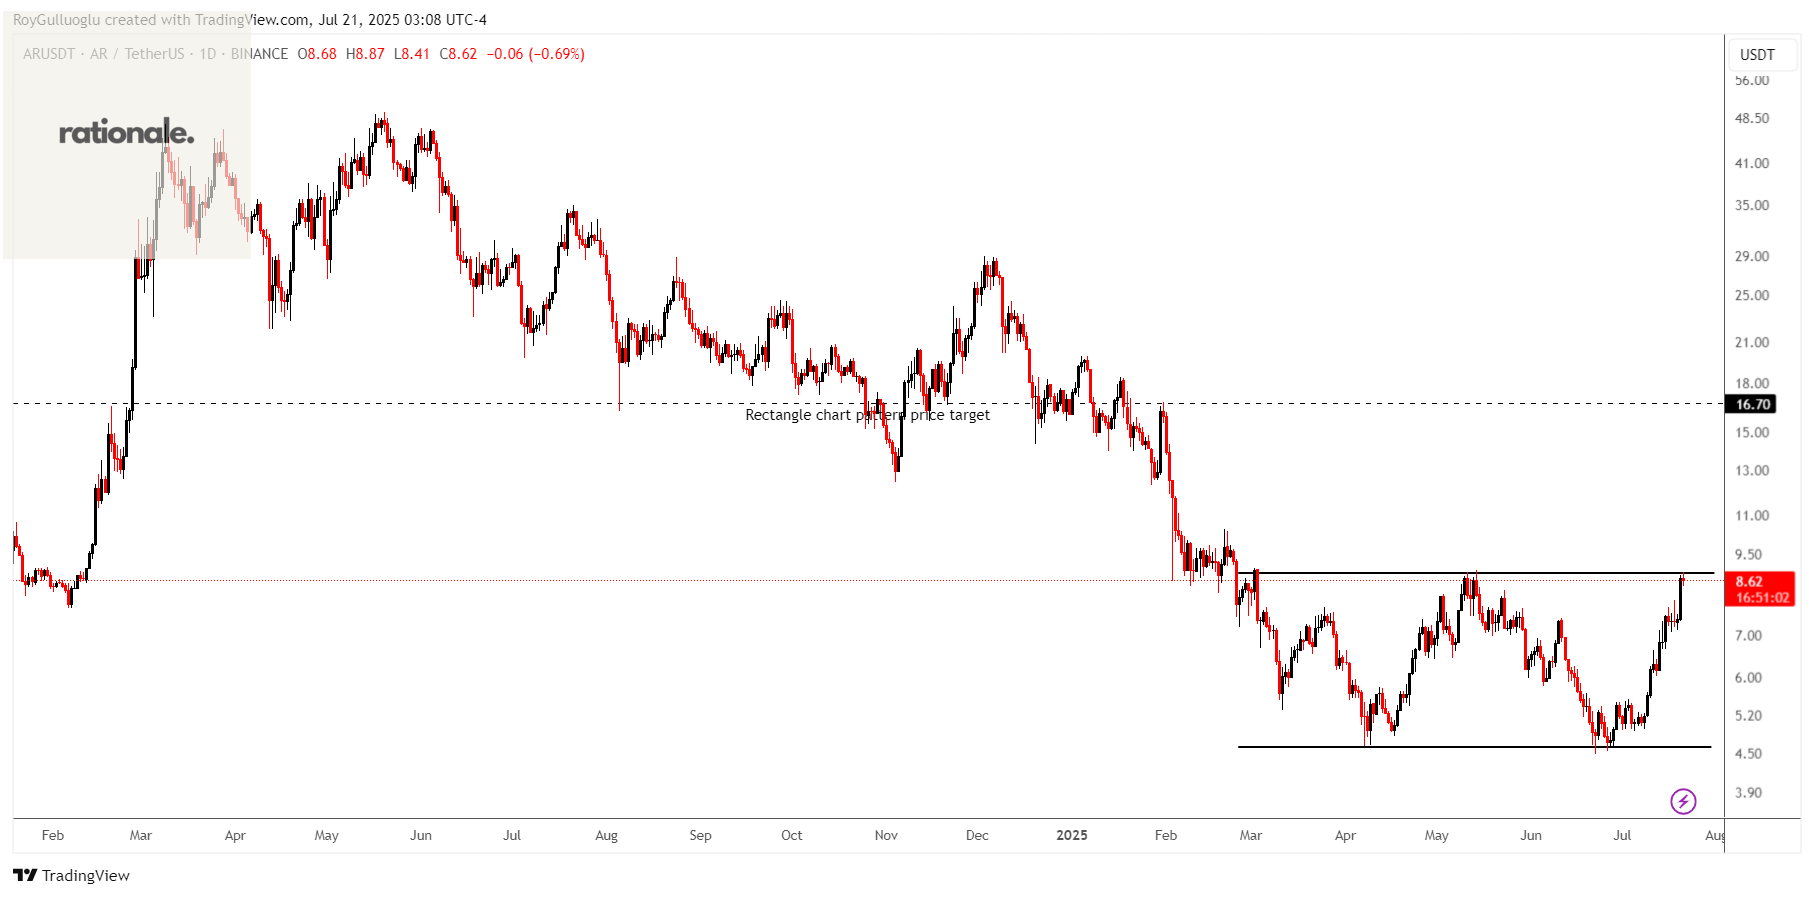
The above daily chart formed an approximately 5-month-long rectangle chart pattern as a bullish reversal after a downtrend.
The horizontal boundary at 8.85 levels acts as a resistance within this pattern.
A daily close above 9.11 levels would validate the breakout from the 5-month-long rectangle chart pattern.
Based on this chart pattern, the potential price target is approximately 16.7 levels.
BATUSDT-Long Idea
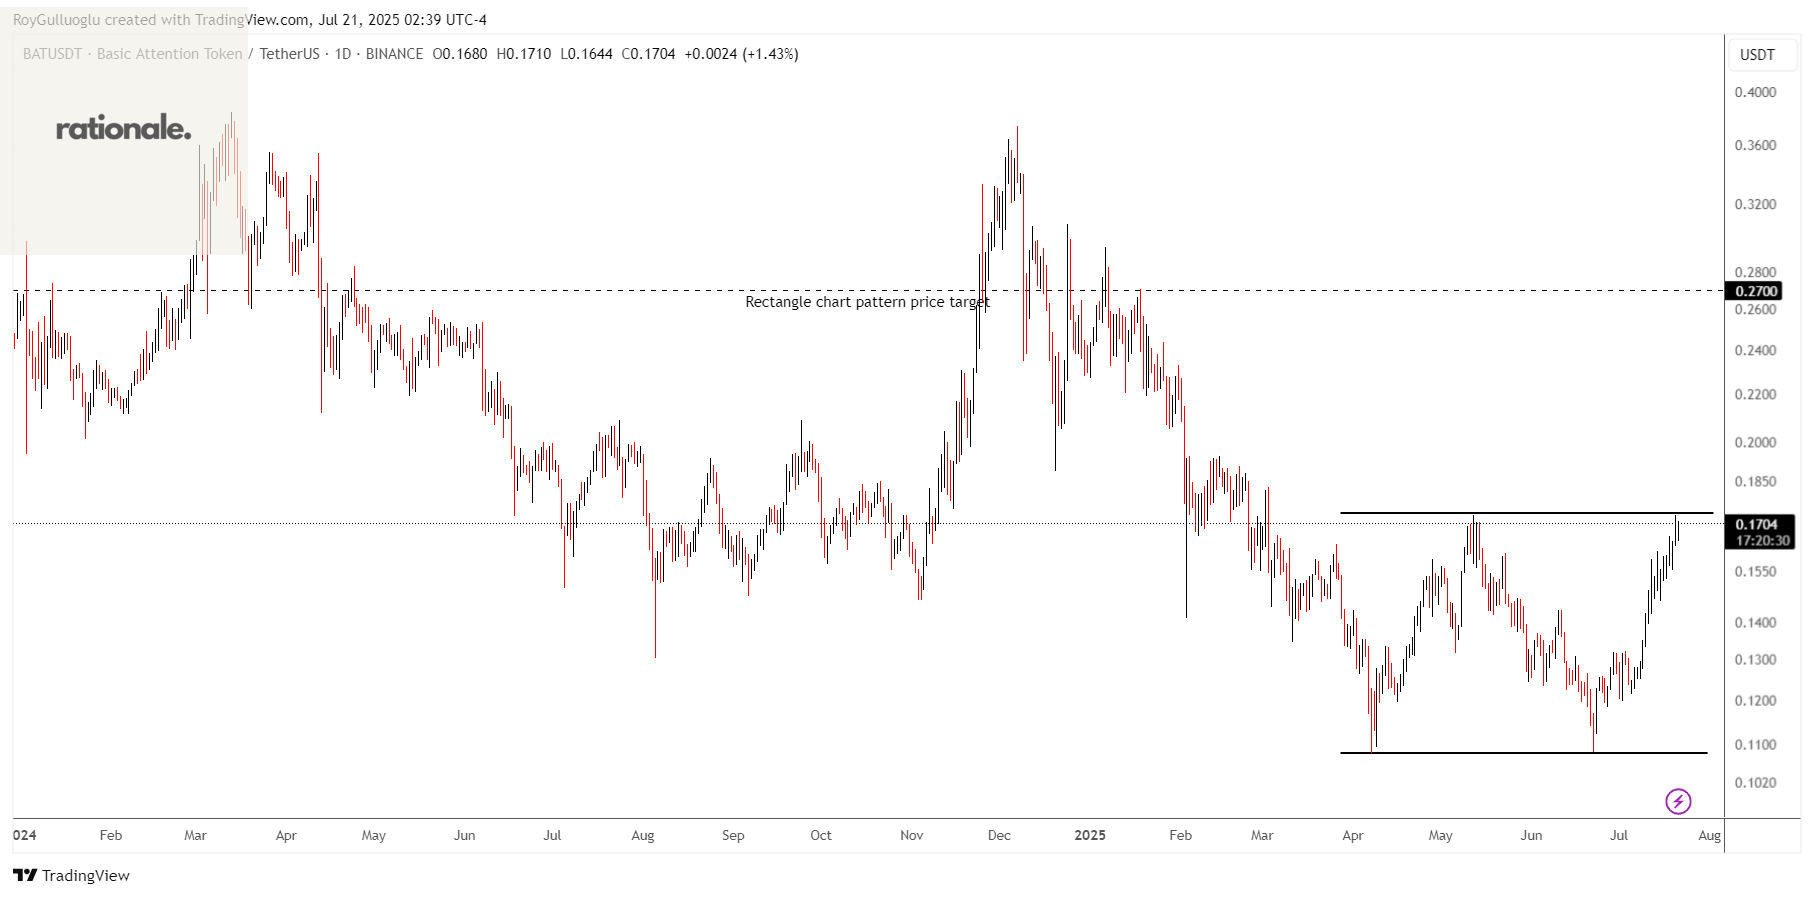
The above daily chart formed an approximately 3-month-long rectangle chart pattern as a bullish reversal after a downtrend.
The horizontal boundary at 0.1736 levels acts as a resistance within this pattern.
A daily close above 0.1788 levels would validate the breakout from the 3-month-long rectangle chart pattern.
Based on this chart pattern, the potential price target is approximately 0.27 levels.
ARBUSDT-Long Idea
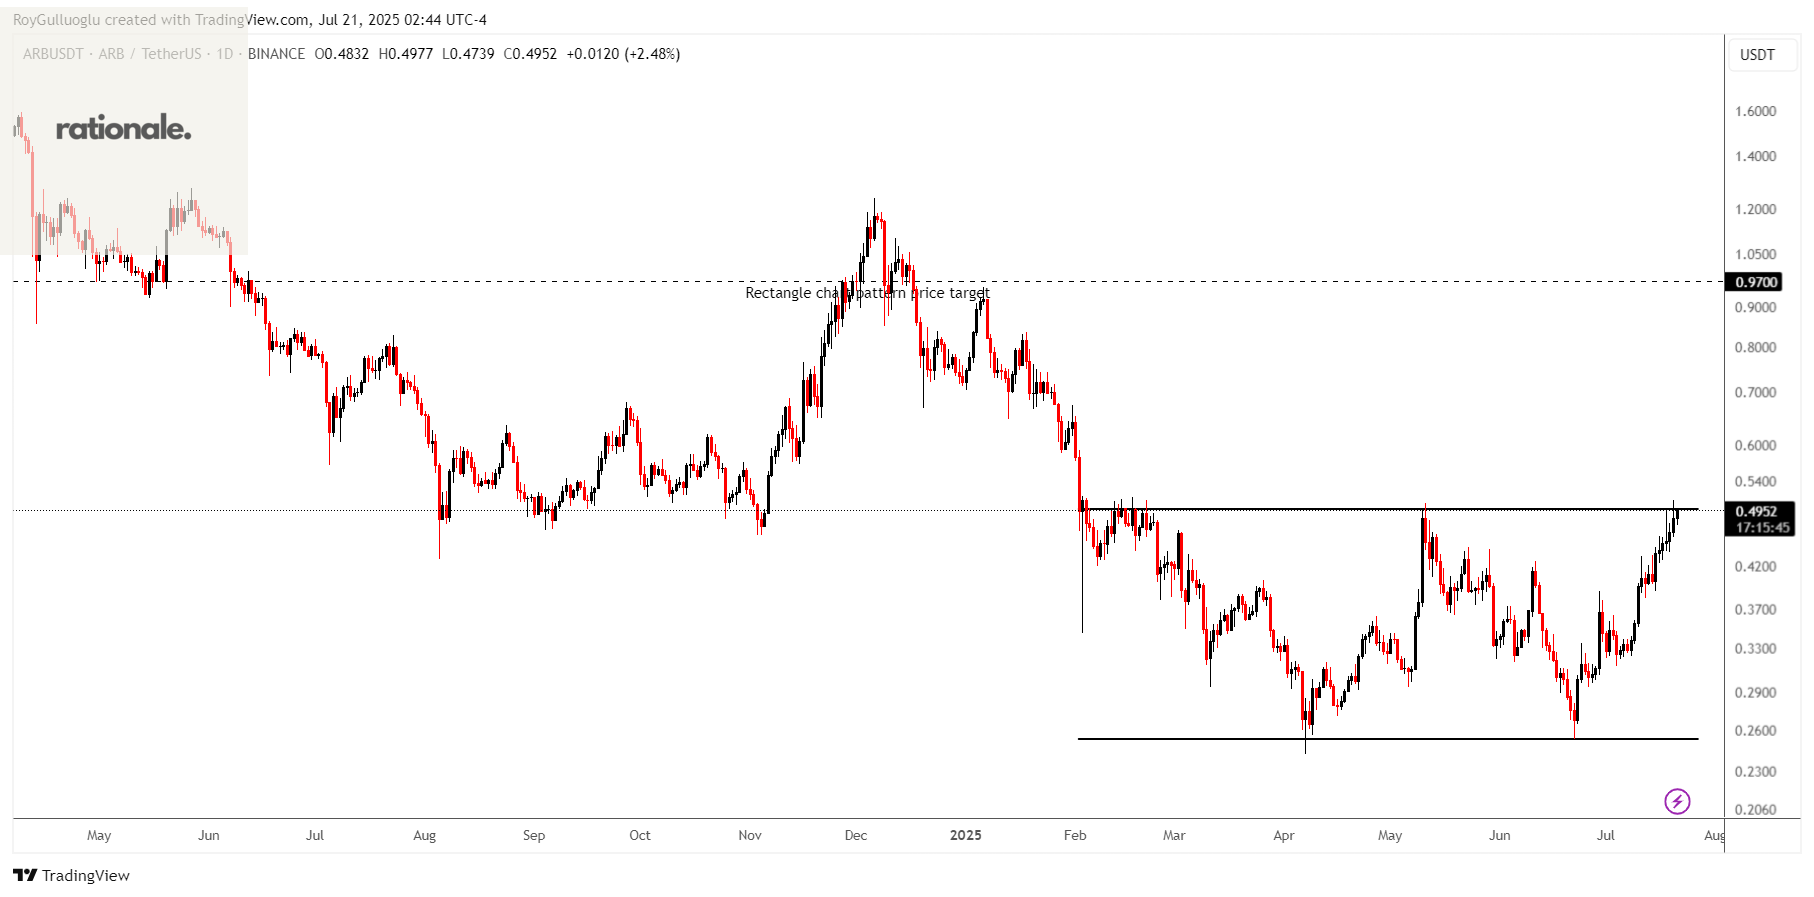
The above daily chart formed an approximately 5-month-long rectangle chart pattern as a bullish reversal after a downtrend.
The horizontal boundary at 0.4968 levels acts as a resistance within this pattern.
A daily close above 0.5117 levels would validate the breakout from the 5-month-long rectangle chart pattern.
Based on this chart pattern, the potential price target is approximately 0.97 levels.
Teşekkürler Roy