


XLP(The Consumer Staples Select Sector SPDR Fund)-Short Idea
Consumer staples have been one of the weakest performing sectors this year.Tech and AI related names have attracted flows while defensive areas such as staples have been left behind.
Consumer staples produce steady cash flow even when the economy is under pressure, but their growth tends to trail the average company in the S&P 500.
Walmart is one of the few large names in the ETF holding up well, while others such as Costco and P&G have been lagging the broader market.
If economic conditions deteriorate or volatility rises, investors may rotate back into defensive and income-oriented ETFs like XLP. In that context shorting defensive stocks becomes a risk on bet.
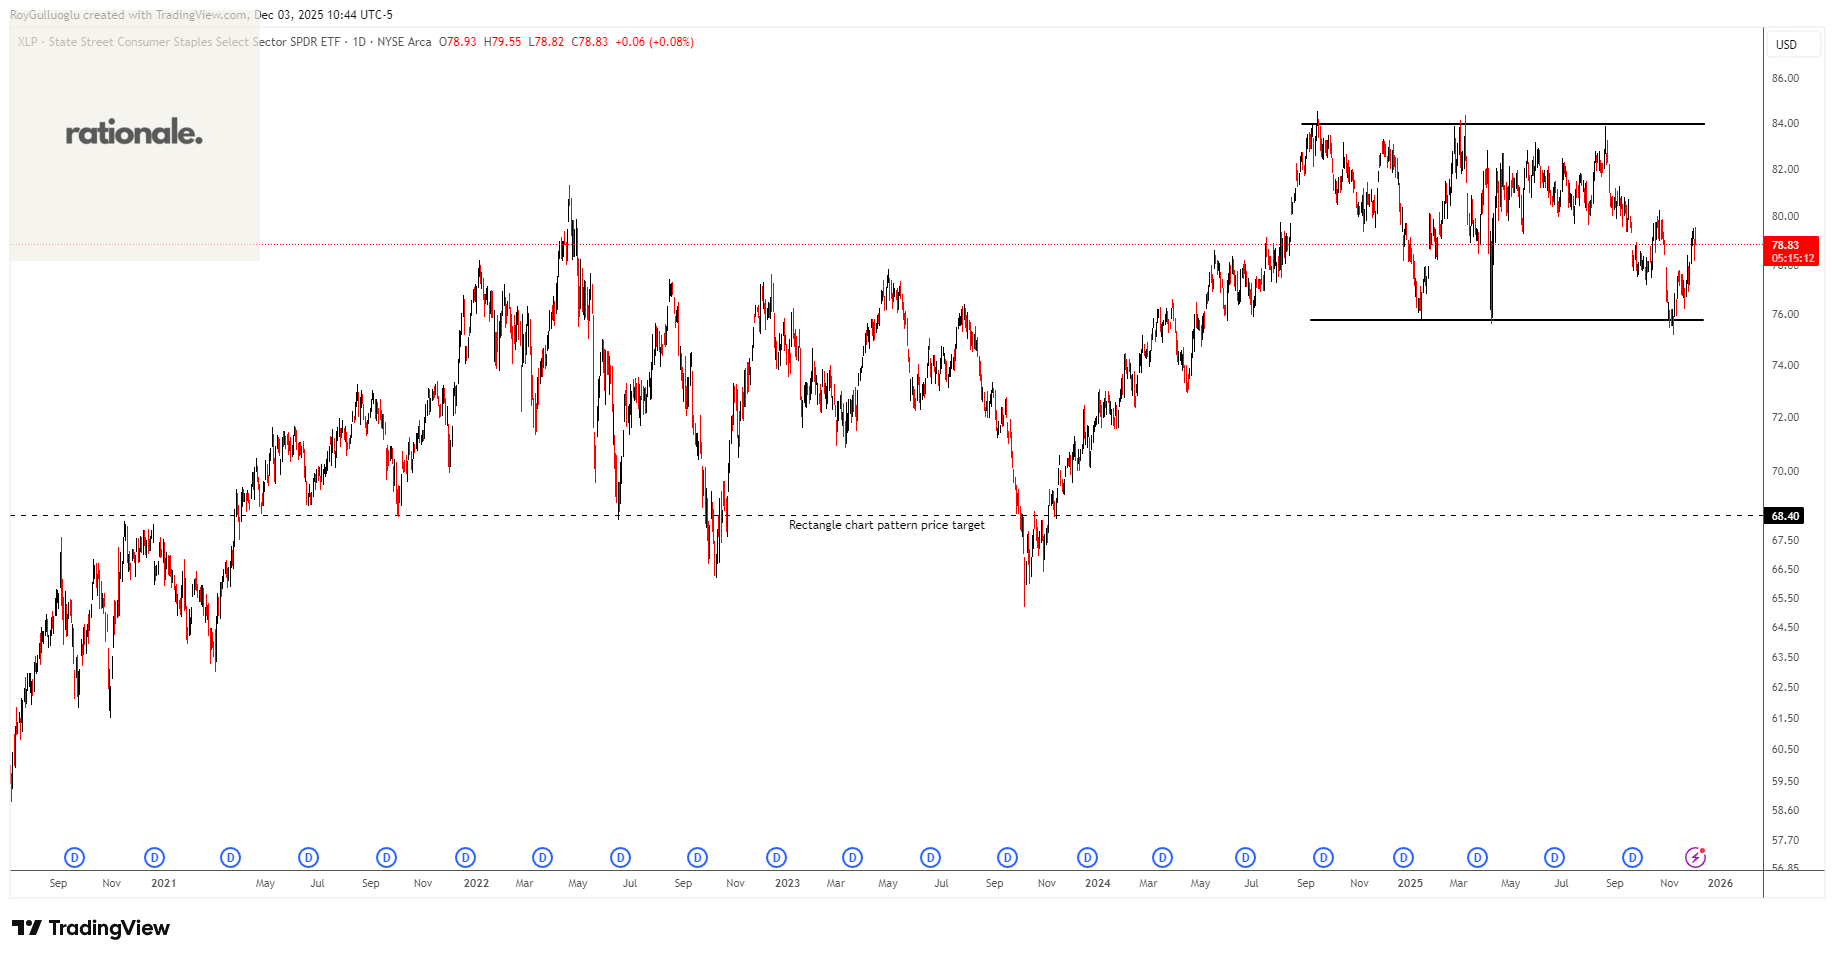
The above daily chart formed an approximately 15-month-long rectangle chart pattern as a bullish reversal after a downtrend.
The horizontal boundary at 75.76 levels acts as a support within this pattern.
A daily close below 75 levels would validate the breakout from the 15-month-long rectangle chart pattern.
Based on this chart pattern, the potential price target is approximately 68.4 levels.
NEARUSDT-Short Idea
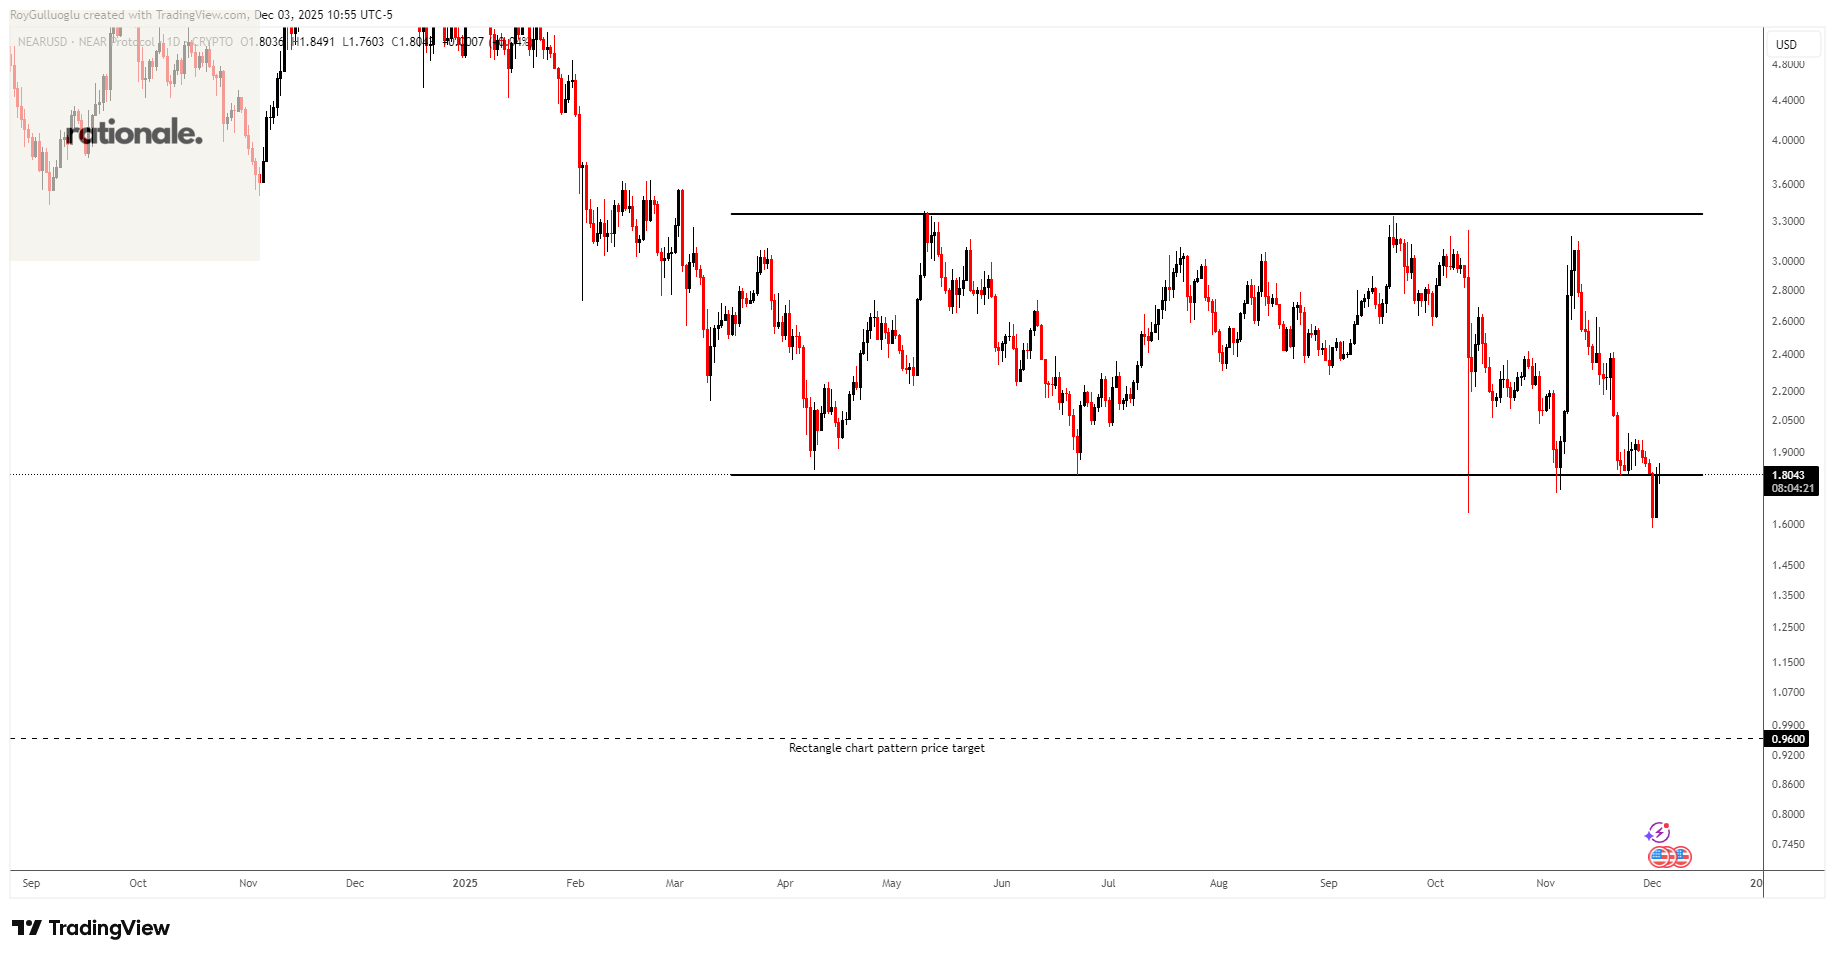
The above daily chart formed an approximately 8-month-long rectangle chart pattern as a bearish continuation after a downtrend.
The horizontal boundary at 1.7985 levels acts as a resistance within this pattern.
A daily close below 1.745 levels would validate the breakout from the 8-month-long rectangle chart pattern.
Based on this chart pattern, the potential price target is approximately 0.96 levels.
Daily active accounts have been trending lower compared with earlier peaks, which signals softer user engagement and weaker network activity.
Transaction count has been relatively stable but not showing strong expansion. In a competitive layer one environment this lack of acceleration often limits investor enthusiasm.
Total value locked in NEAR based applications remains far below previous cycles. This suggests limited capital commitment to the ecosystem and lukewarm demand for its applications.
RC1!(Robusta Coffee Futures)-Short Idea
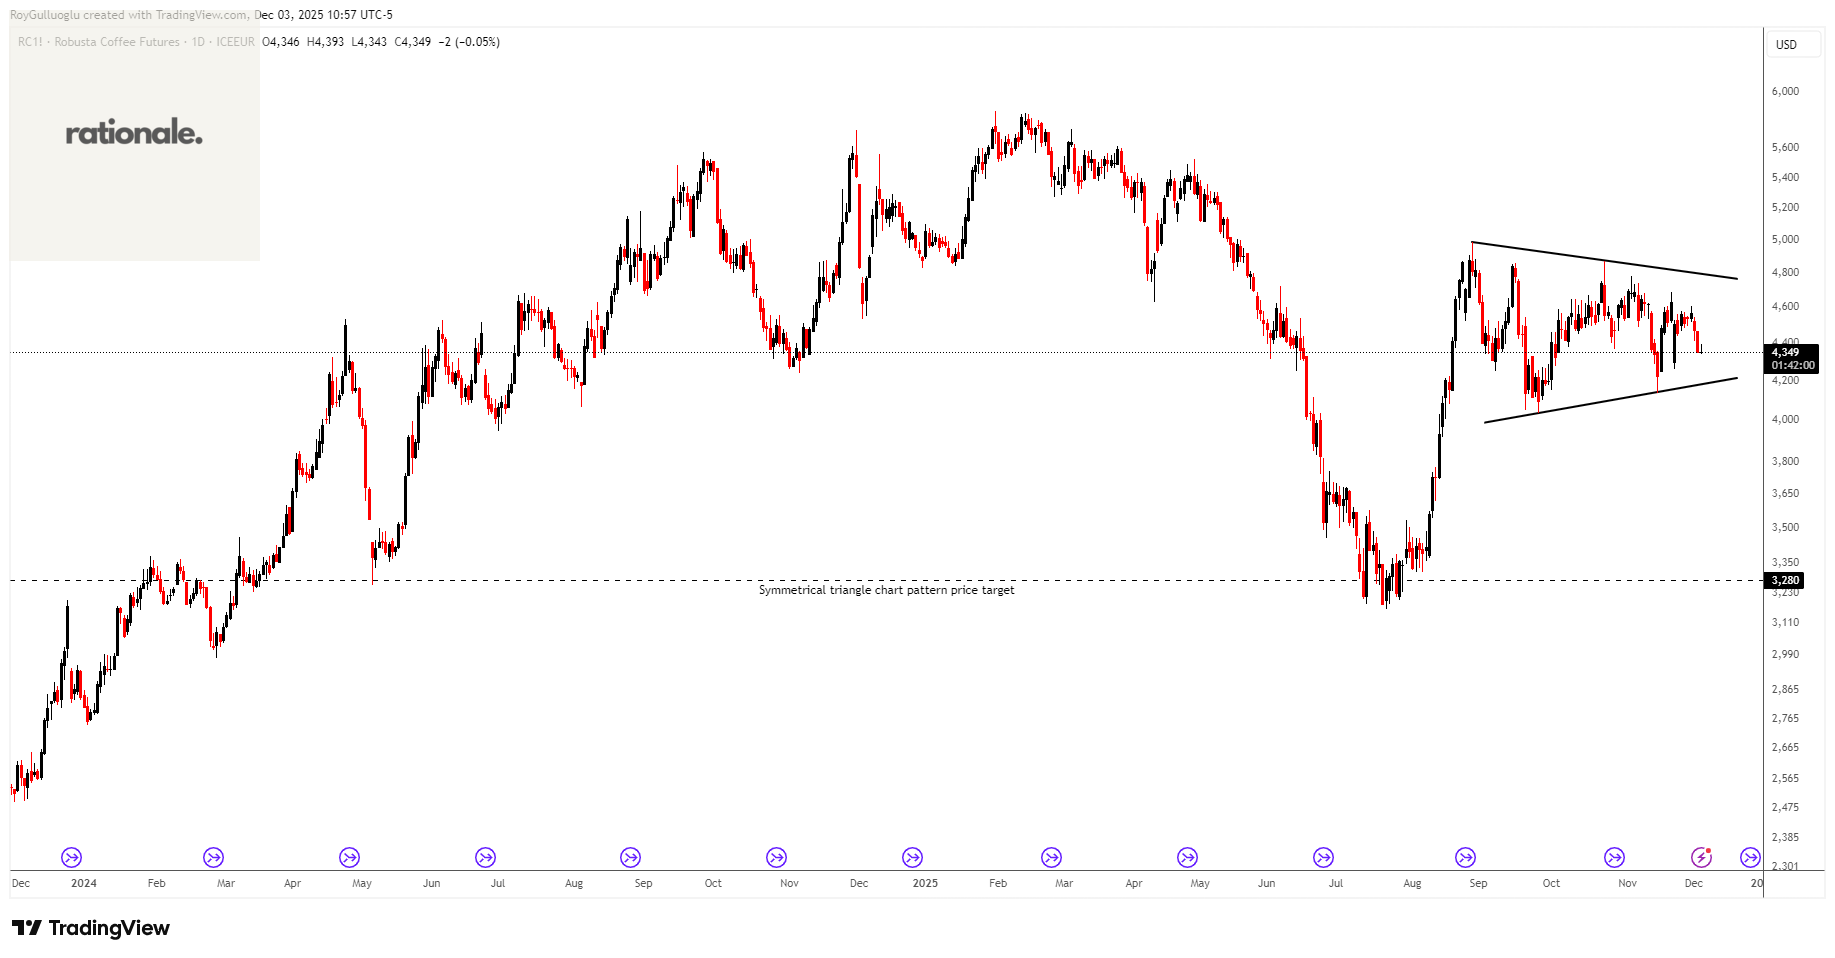
The above daily chart formed an approximately 3-month-long symmetrical triangle chart pattern as a bearish reversal after an uptrend.
A daily close below 4158 levels would validate the breakout from the 3-month-long symmetrical triangle chart pattern.
Based on this chart pattern, the potential price target is approximately 3280 levels.
Global prices dropped sharply after the Donald J. Trump administration removed a 40% tariff on Brazilian coffee imports, reducing a major supply distortion.
Output from Brazil is ramping up strongly. 2025 crop collection is reportedly on track to exceed initial estimates, which adds to robusta supply pressure.